What is Graphiant’s Local Web Server?
Graphiant’s Local Web Server provides you direct access to your Edge.
The local web server is key in helping you:
Set the WAN configuration to get your Edge connected to the Graphiant Portal when DHCP is not available
Troubleshoot connection issues when not connected to the Graphiant Portal
This article covers troubleshooting connection issues.
For information on onboarding your Edge, see Onboarding Your Graphiant Edge Using the Local Web Server.
How Do I Locate Graphiant’s Local Web Server
Ensure that you are connected to your Graphiant Edge through the last (local management) port.
Note:
You must be on the same network as the local management interface.
The Graphiant Local Web Server is only reachable via your web browser.
Point your browser to: https://192.168.1.1
You will receive a security warning due to Graphiant using a Self-Signed Certificate; accept to connect.
You will see the Graphiant Local Web Server Portal.
Simply click ‘Login’ to access your edge.
If your Graphiant Edge has previously been connected to the Graphiant Portal:
You will need to enter the password you configured there.

You will now be in the Graphiant Local Web Server for your Edge.
Note:
When your Edge comes up and doesn’t connect to the Portal, it will enable a DHCP server on its management interface to give you an IP address.
As soon as the connection to the Graphiant Portal comes up, the Edge will disable that DHCP server but you can still access the management interface via https://192.168.1.1 by setting a static IP address on your laptop.
When troubleshooting, you will utilize these sections of the Local Web Server:
Dashboard: Contains the configuration summary information for your Edge
Network Tools: Testing via ping, trace route, and throughput, in addition to ARP and DNS lookup
Diagnostics & Logs: Shows insight into logs for packet capture, support, device and reboot histories
‘Reboot Device’ and ‘Logout’ are available at all times at the top of your screen.
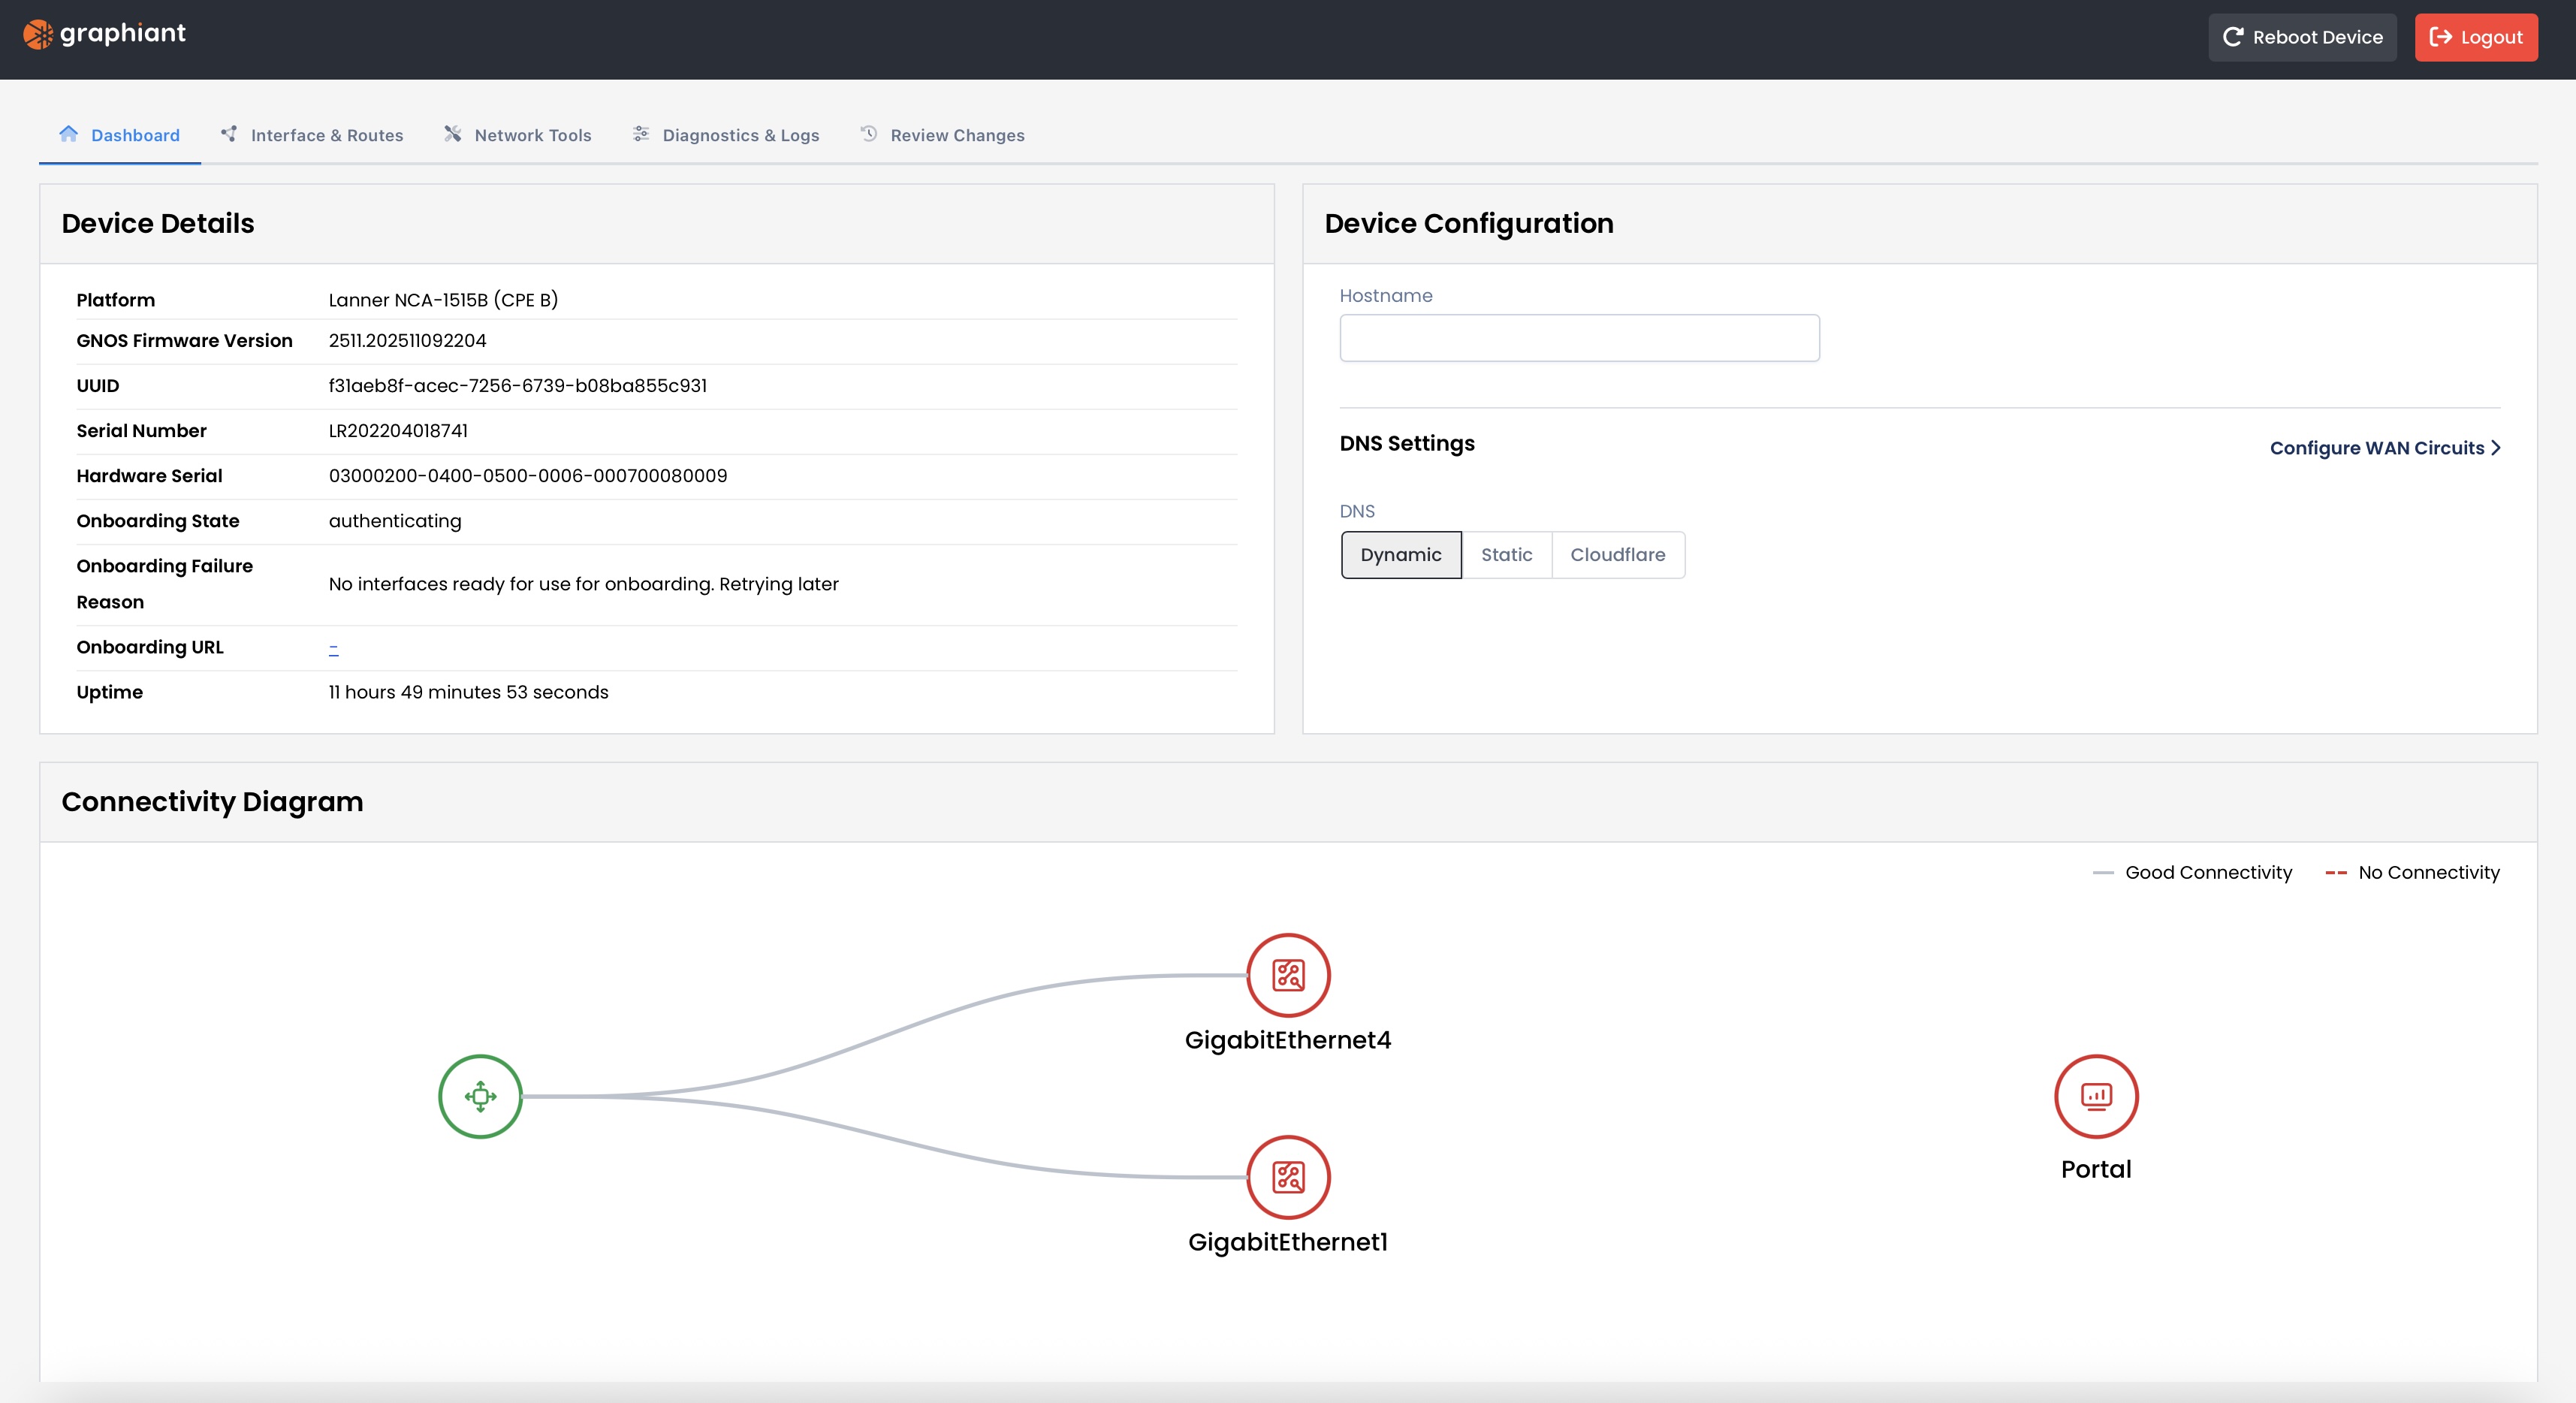
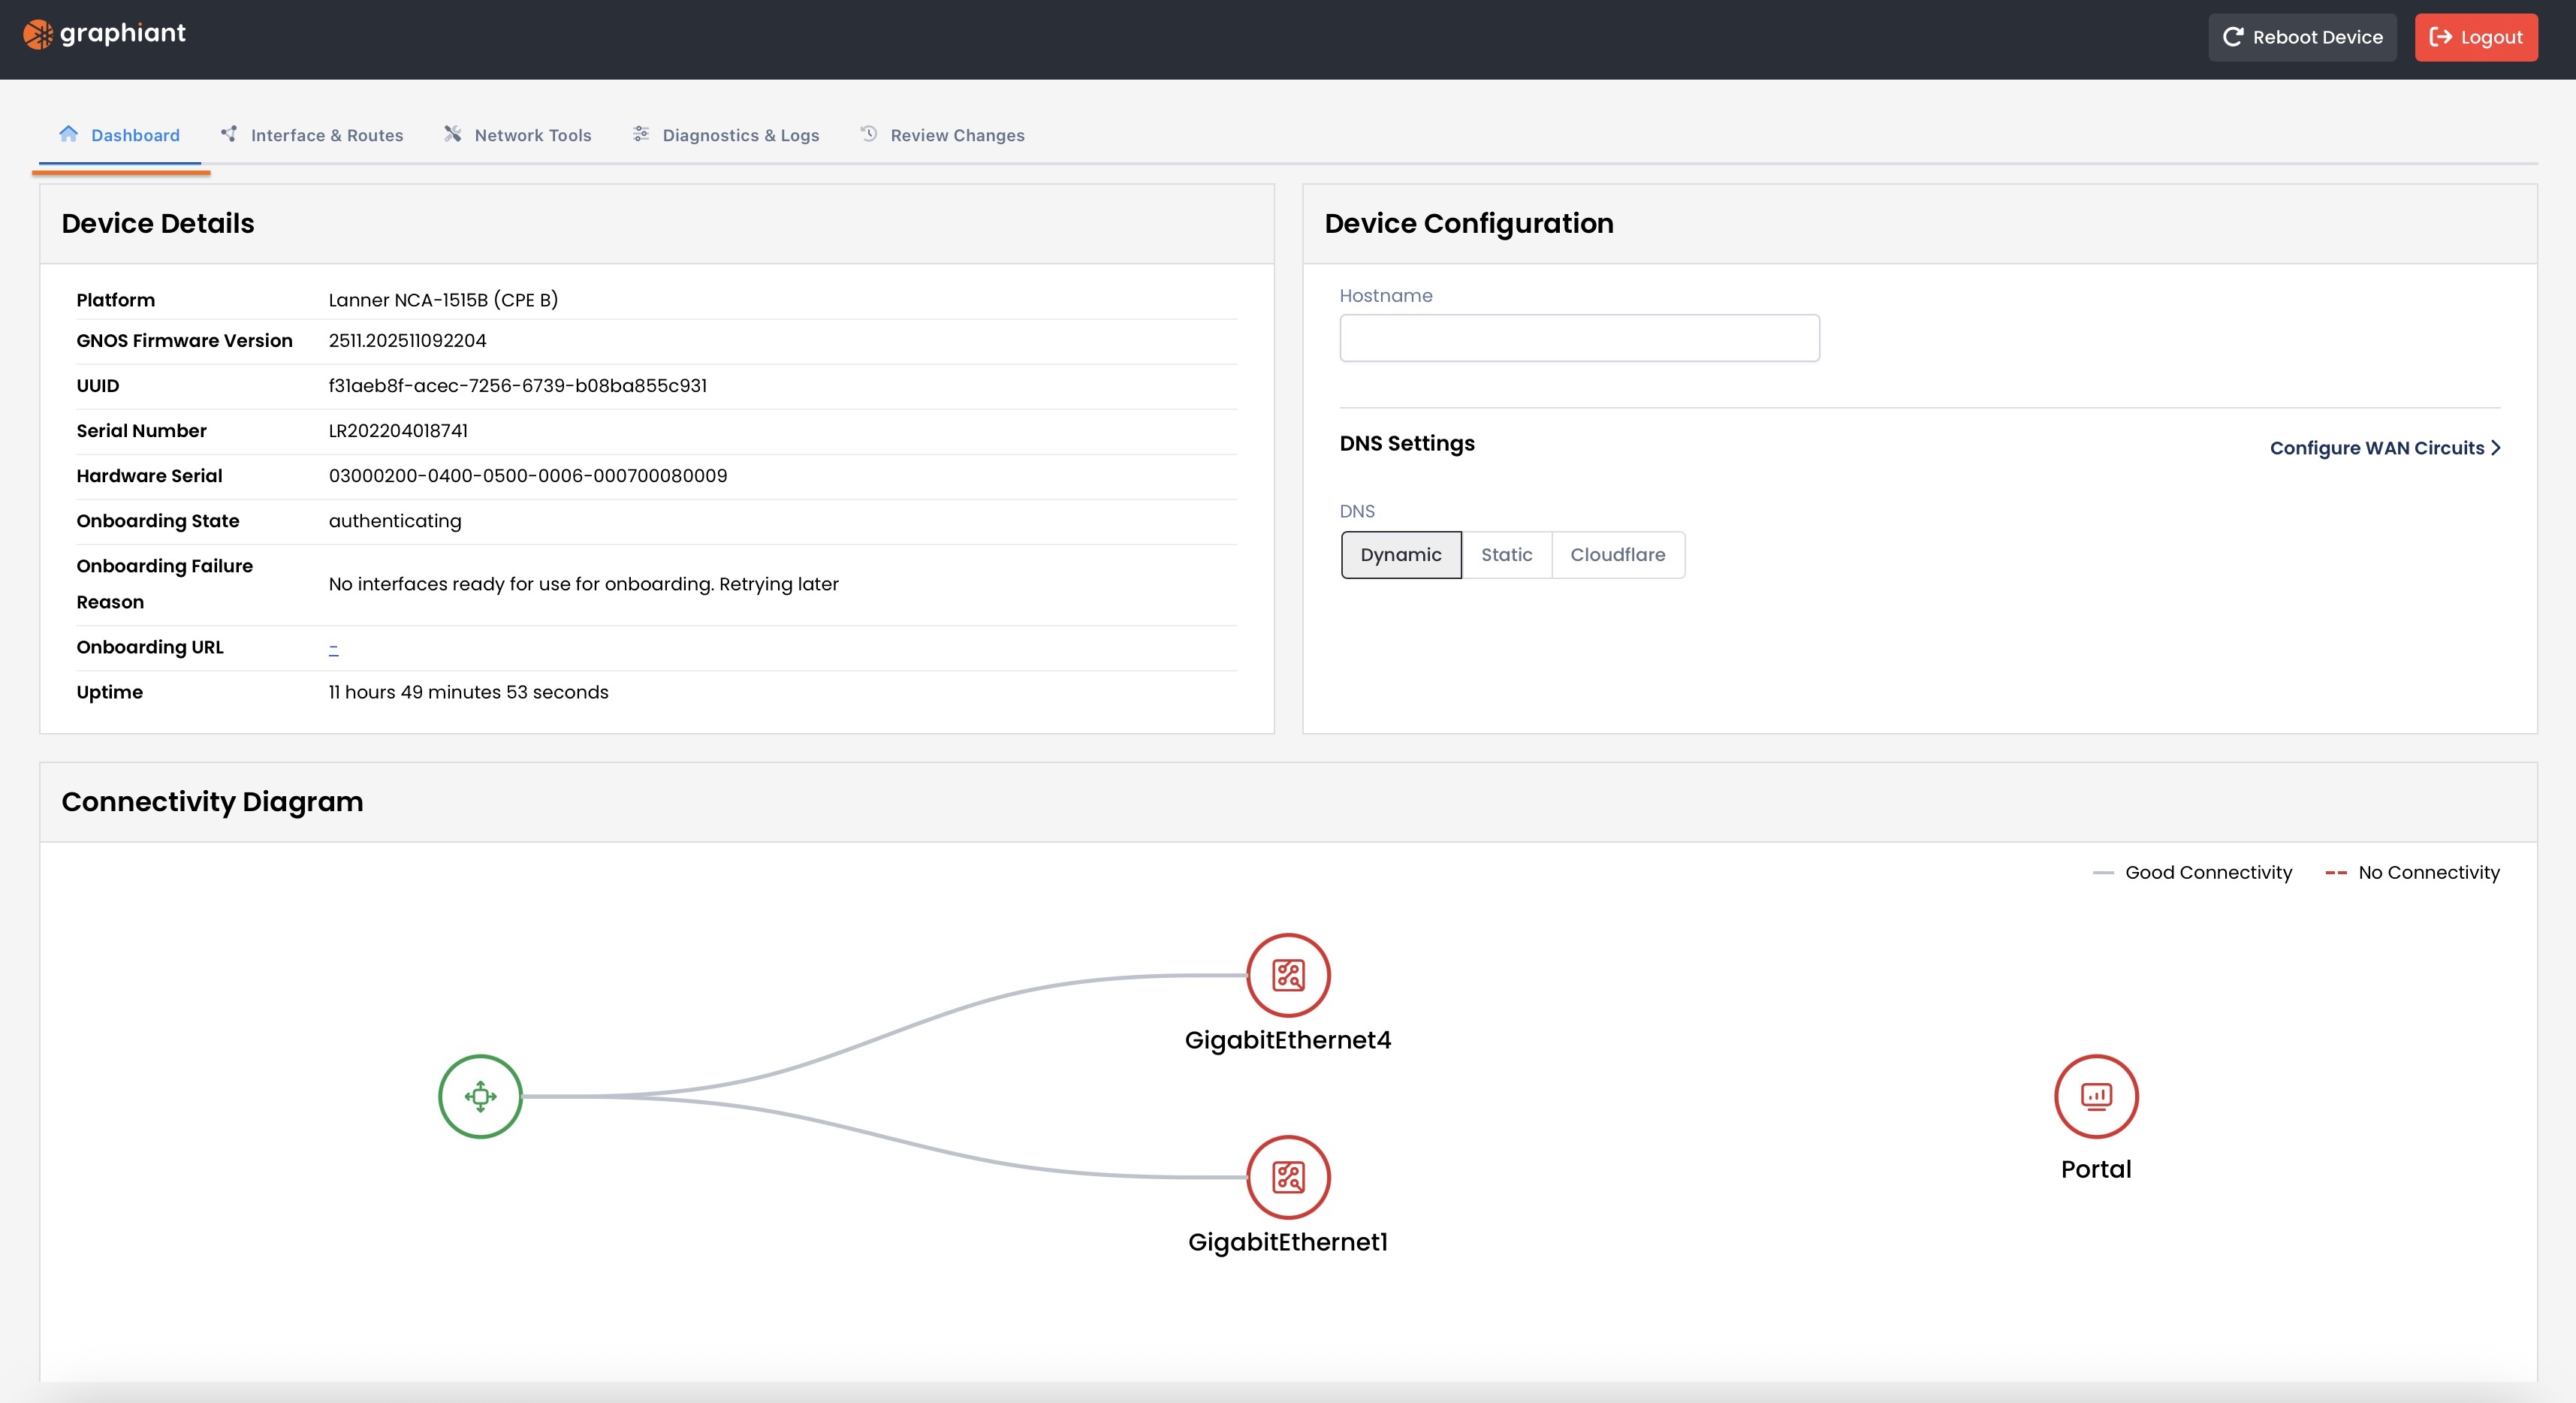
Local Web Server Dashboard
The landing page for the local web server is the Dashboard.
This gives you all of the following:
Device Details
Platform
Graphiant Network Operating System Firmware Version
UUID
Serial Number
Hardware Serial
Onboarding State: Where the Edge is within it’s onboarding process
Onboarding Failure Reason: Should an onboarding attempt have been made, the reason will appear here
Onboarding URL: If onboarded, this will show the address your Edge uses to connect to the Graphiant network
Uptime: The length of time the connection to the local web server has been active
Device Configuration
Hostname: Reflects the name of your Edge that is assigned when connected to the Graphiant Portal; i
This field is uneditable
DNS Settings: Whether you are utilizing a Dynamic (DHCP) or Static DNS, or if you prefer to use Cloudflare
If ‘Static’ is selected: You will be asked to provide the primary and secondary IPv4/IPv6 addresses.
From here, you can select to go directly to configure your WAN circuits without going tab by tab.
Connectivity Diagram
The connectivity of your device to the Graphiant Portal is shown here.
As this Edge is not yet onboarded:
The Connectivity Diagram is not yet showing green to the Graphiant Portal.
Network Tools
The network tools tab houses the troubleshooting methods:
Ping: Tests connectivity by sending packets to a target and measuring response time
Trace Route: Shows the hop-by-hop network path the packets take to reach a destination and their metrics
Throughput Test: Measures data transmission speed
ARP: Displays IP-to-MAC address mappings to verify local device communication
DNS Lookup: Resolves a domain name to its IP address to confirm DNS is working correctly
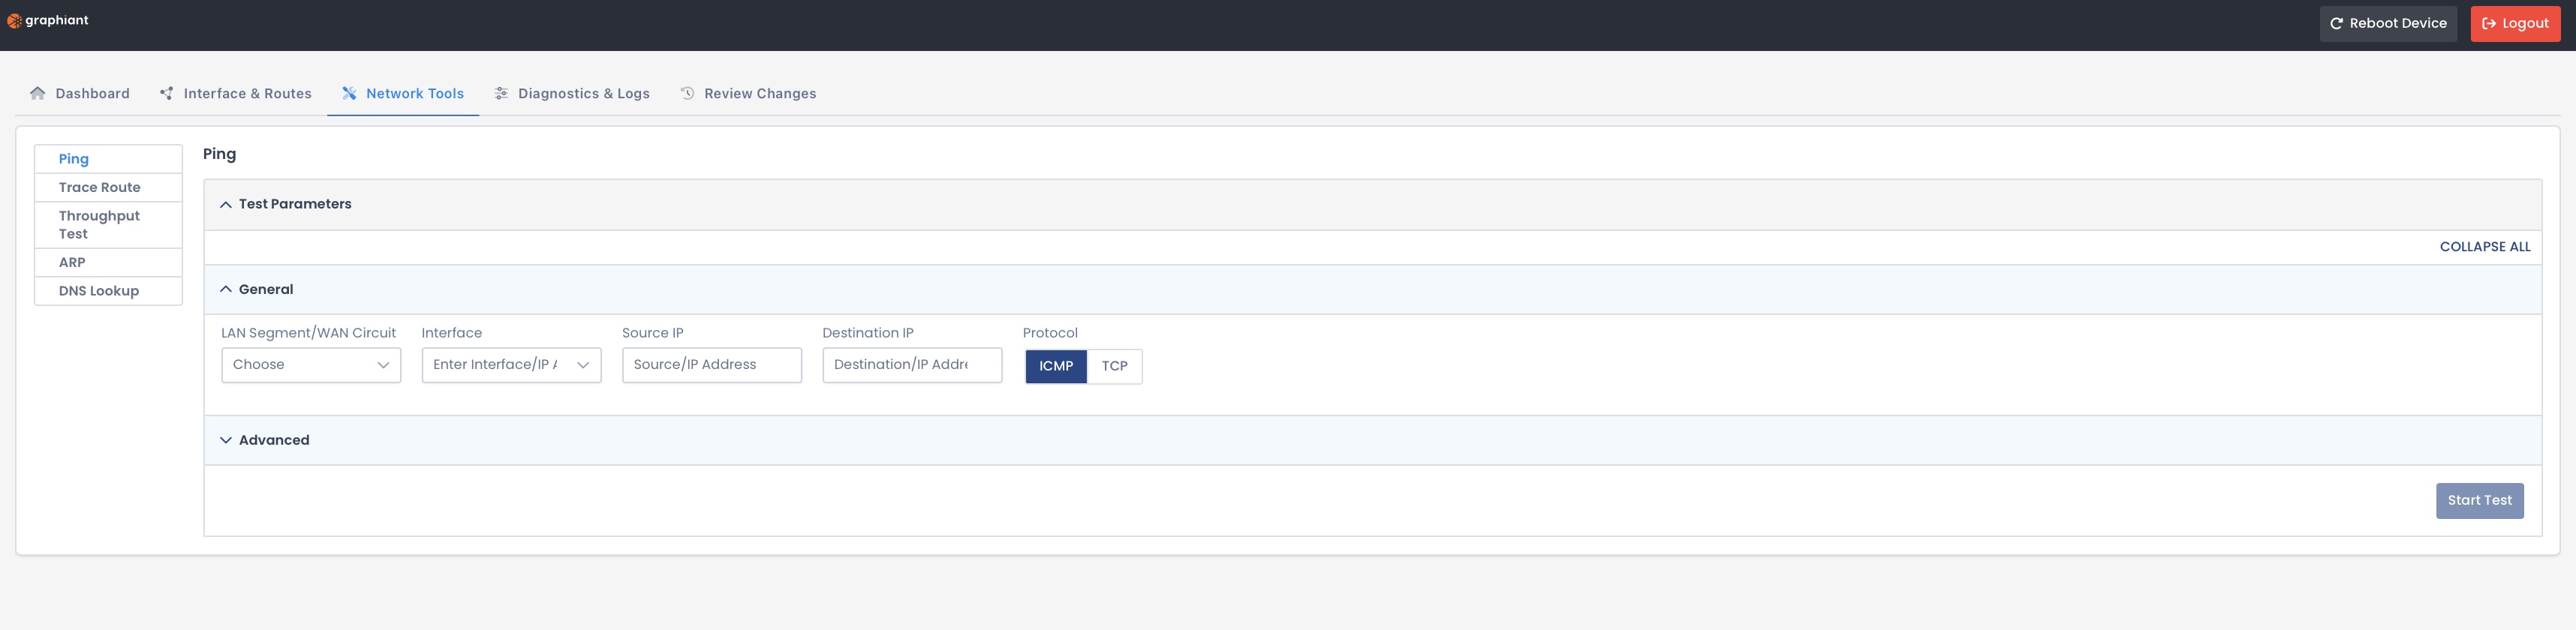
Ping
When you test connectivity using the Ping capability, you send packets to your target and measure the response time.
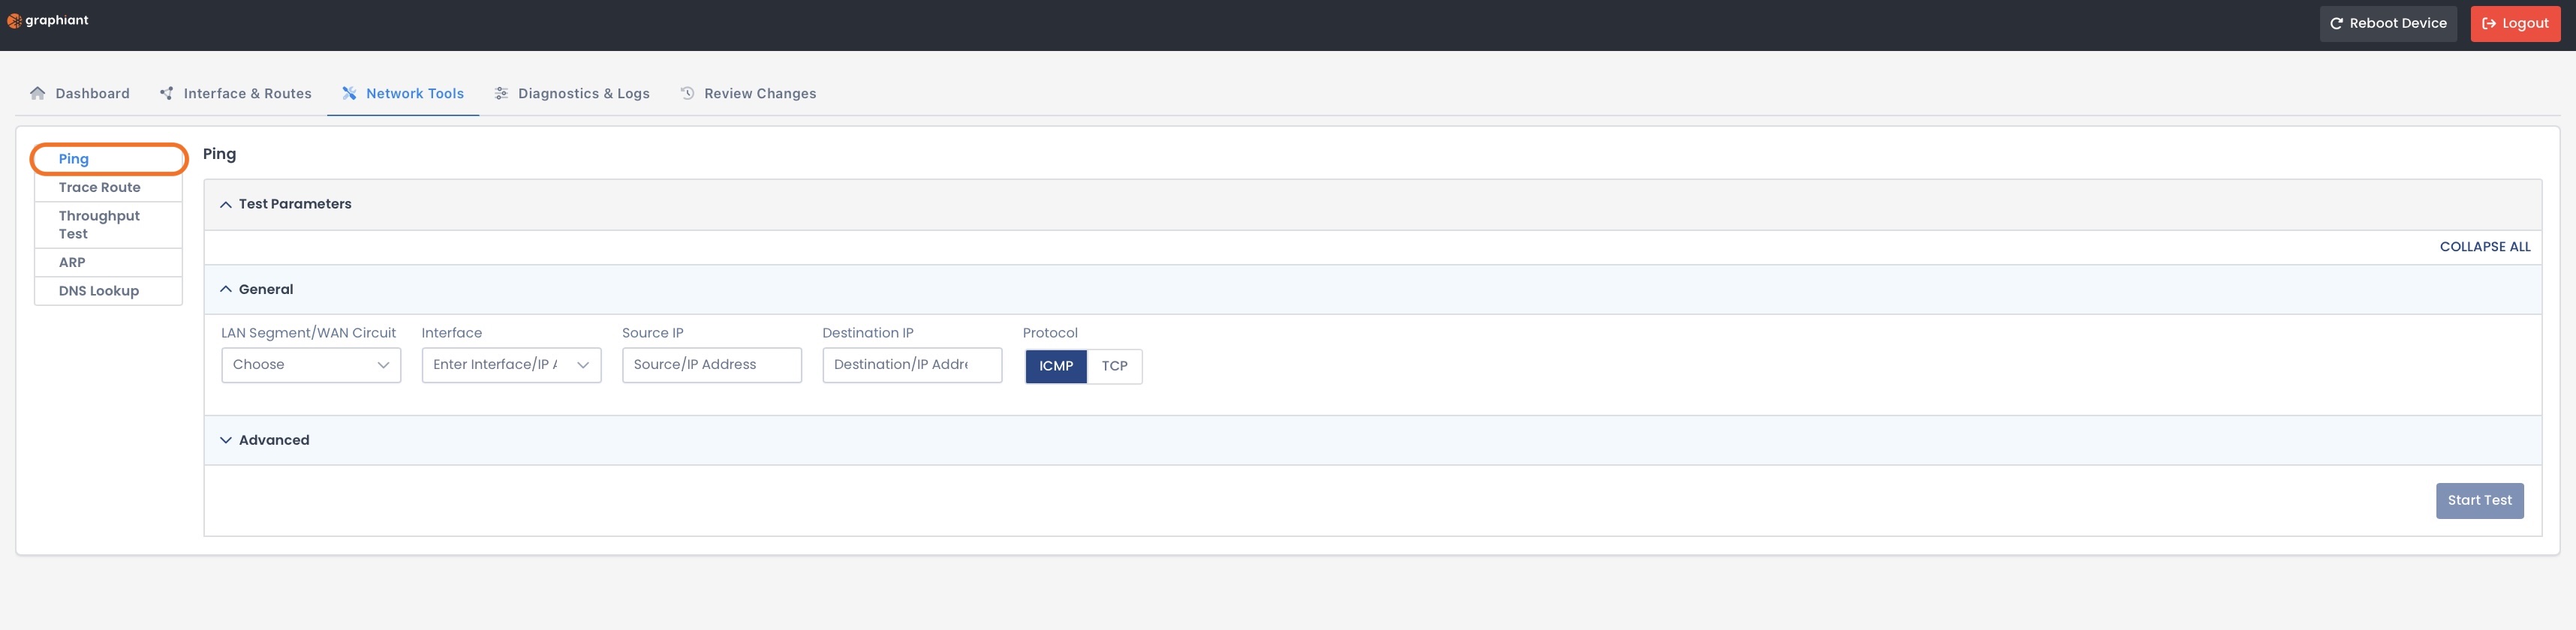
Fill out the following fields:
General:
LAN Segment / WAN Circuit: Source of the ping
Interface: Specific interface used to send the ping packets
Source IP: IP address sending the ping request
Destination IP: IP address you’re testing connectivity to
Protocol:
If selecting ICMP, there are no more General fields after “Protocol”
If selecting TCP you will need to also fill out:
Destination Port: The TCP port number used for the connection test; the port must be open and available for a successful test
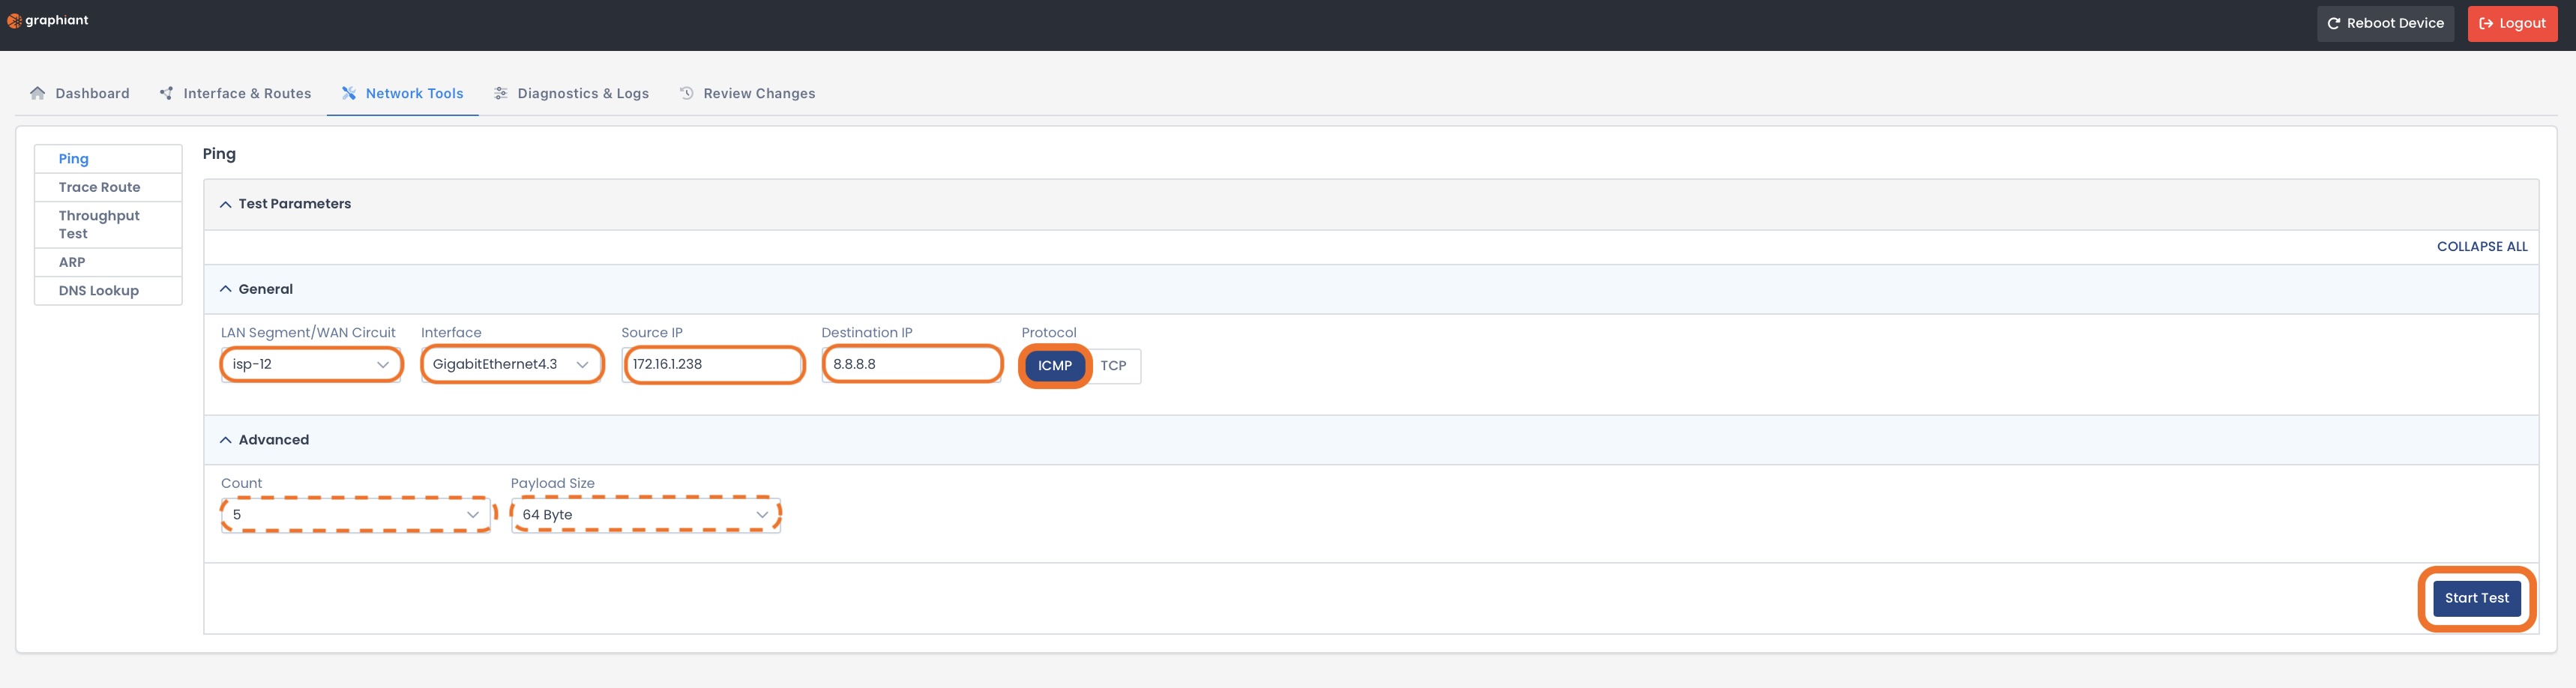
Advanced (Optional):
Count: Number of ping packets to send during the test (default = 5)
Payload Size: Amount of data contained in each ping packet (default = 64 bytes)
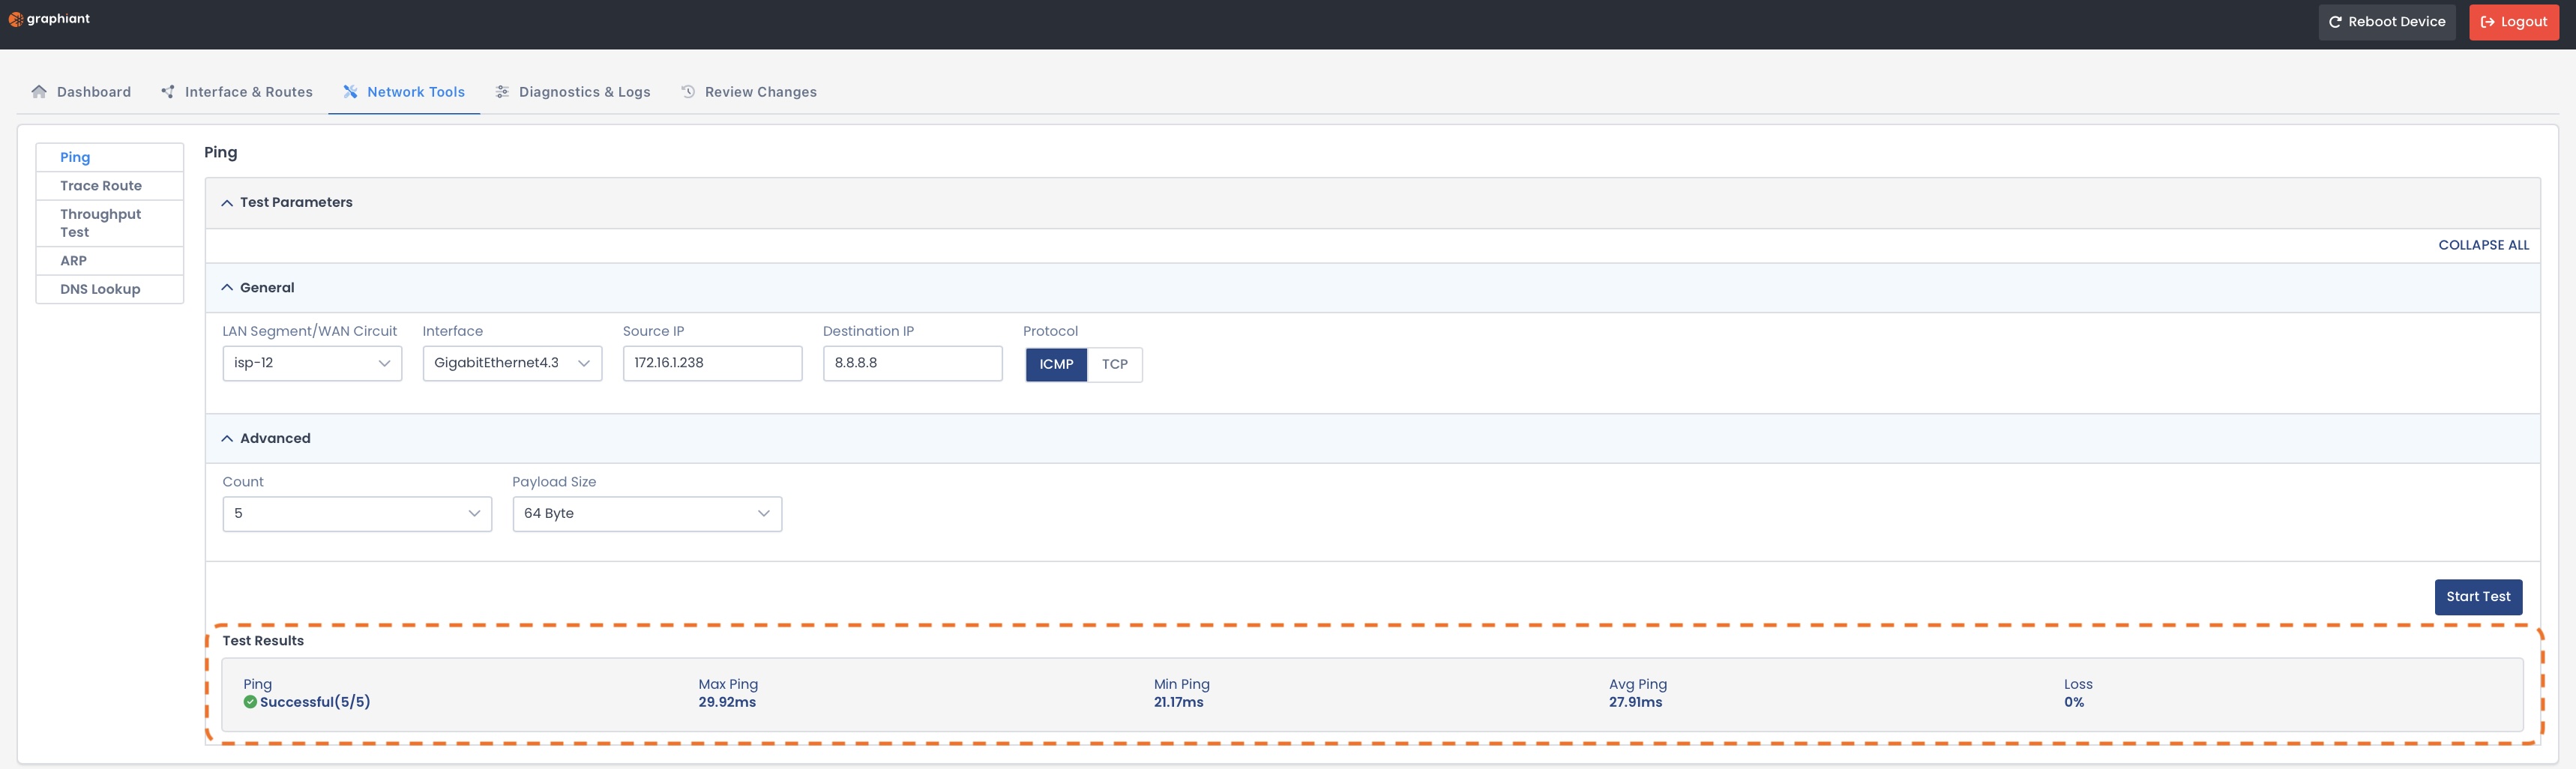
Click ‘Start Test’.
The results will appear at the bottom of the page, and include:
Ping: Successful / Unsuccessful
Max Ping: Longest response time from all ping replies.
Min Ping: Shortest response time from all ping replies
Avg Ping: Average response time across all ping replies
Loss: Percentage of ping packets that did not receive a reply
Trace Route
When you test connectivity using the Trace Route capability, you are able view the hop-by-hop path your packets are taking, along with their metrics.
Graphiant supports both:
Trace Route
A one-time snapshot view of the path your packets take from the source to the destination, listing each hop along the way and their latency
Trace Route with MTR
A repeated test (per your specified packet quantity) of the route that not only shows each hop, but also measures their latency and packet loss
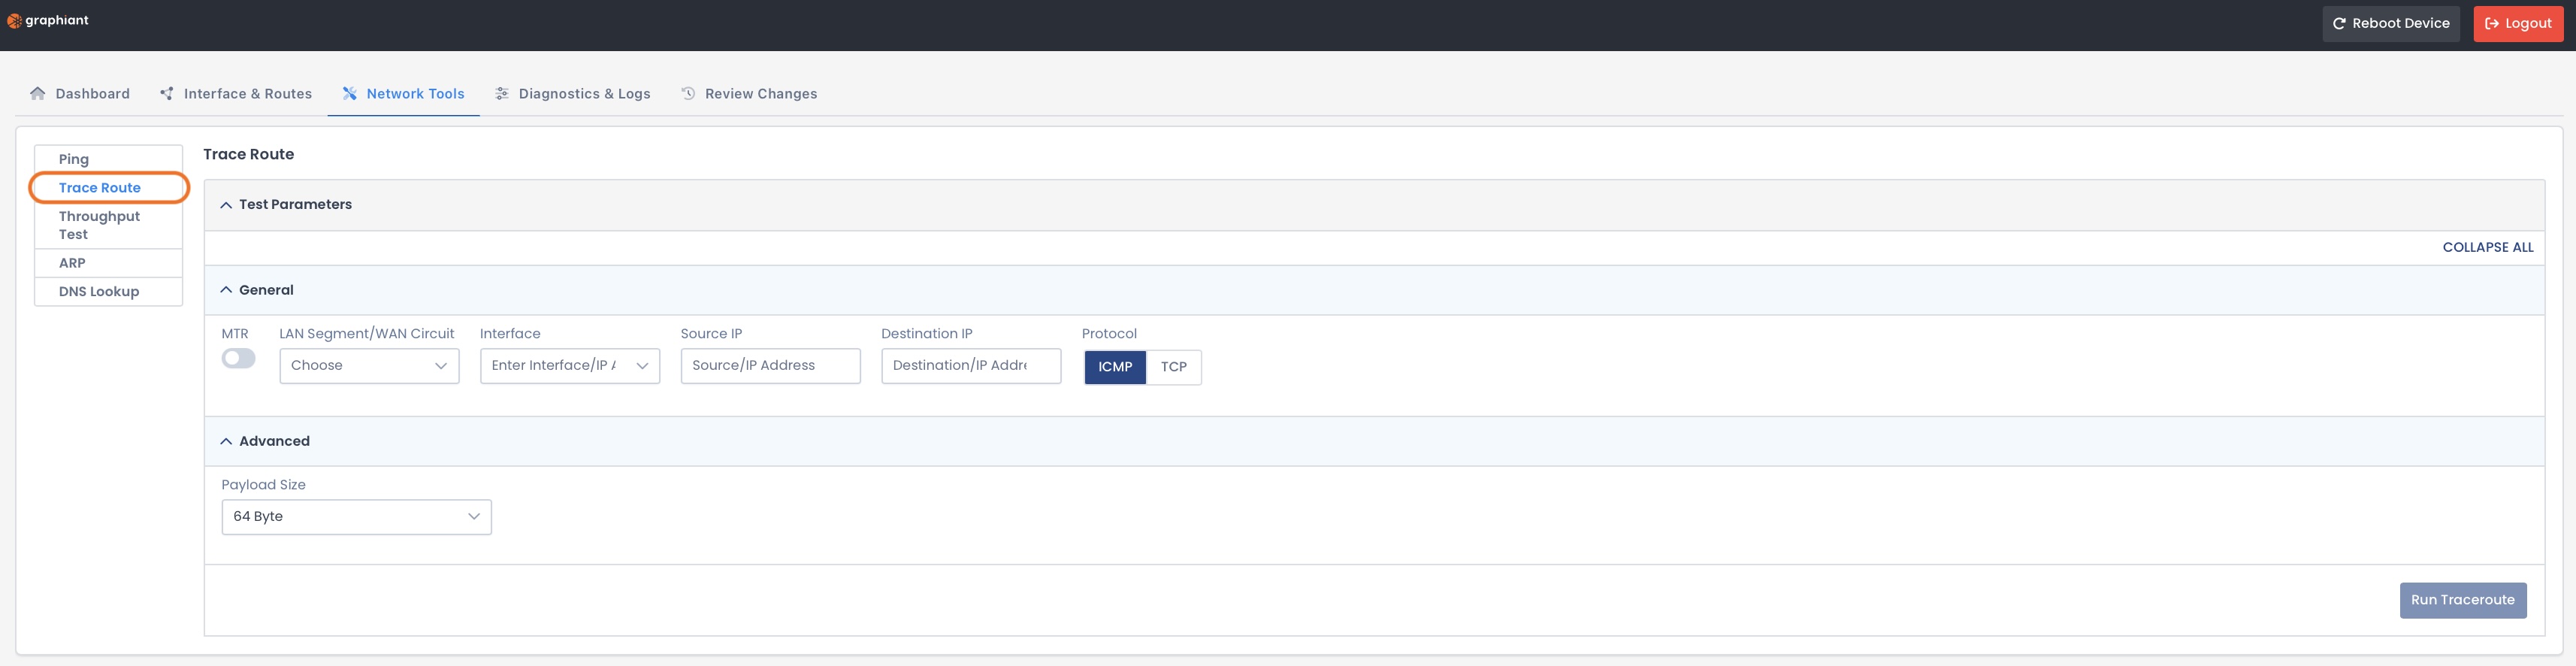
Fill out the following fields:
General:
MTR:
Toggled Off: Displays the one-time path and latency
Toggled On: Tests the route according to Poll Count per Hop, showing latency and packet loss per hop
Poll Count per Hop: Number of packets sent to each hop during the MTR test
LAN Segment / WAN Circuit: Source of the trace route
Interface: Specific interface used to send the trace route
Source IP: IP address initiating the trace route request
Destination IP: IP address you’re testing connectivity to
Protocol:
If selecting ICMP, there are no more General fields after “Protocol”
If selecting TCP you will need to also fill out:
Destination Port: The TCP port number used for the connection test; the port must be open and available for a successful test
Advanced (Optional):
Payload Size: Amount of data contained in each trace route packet (default = 64 bytes)
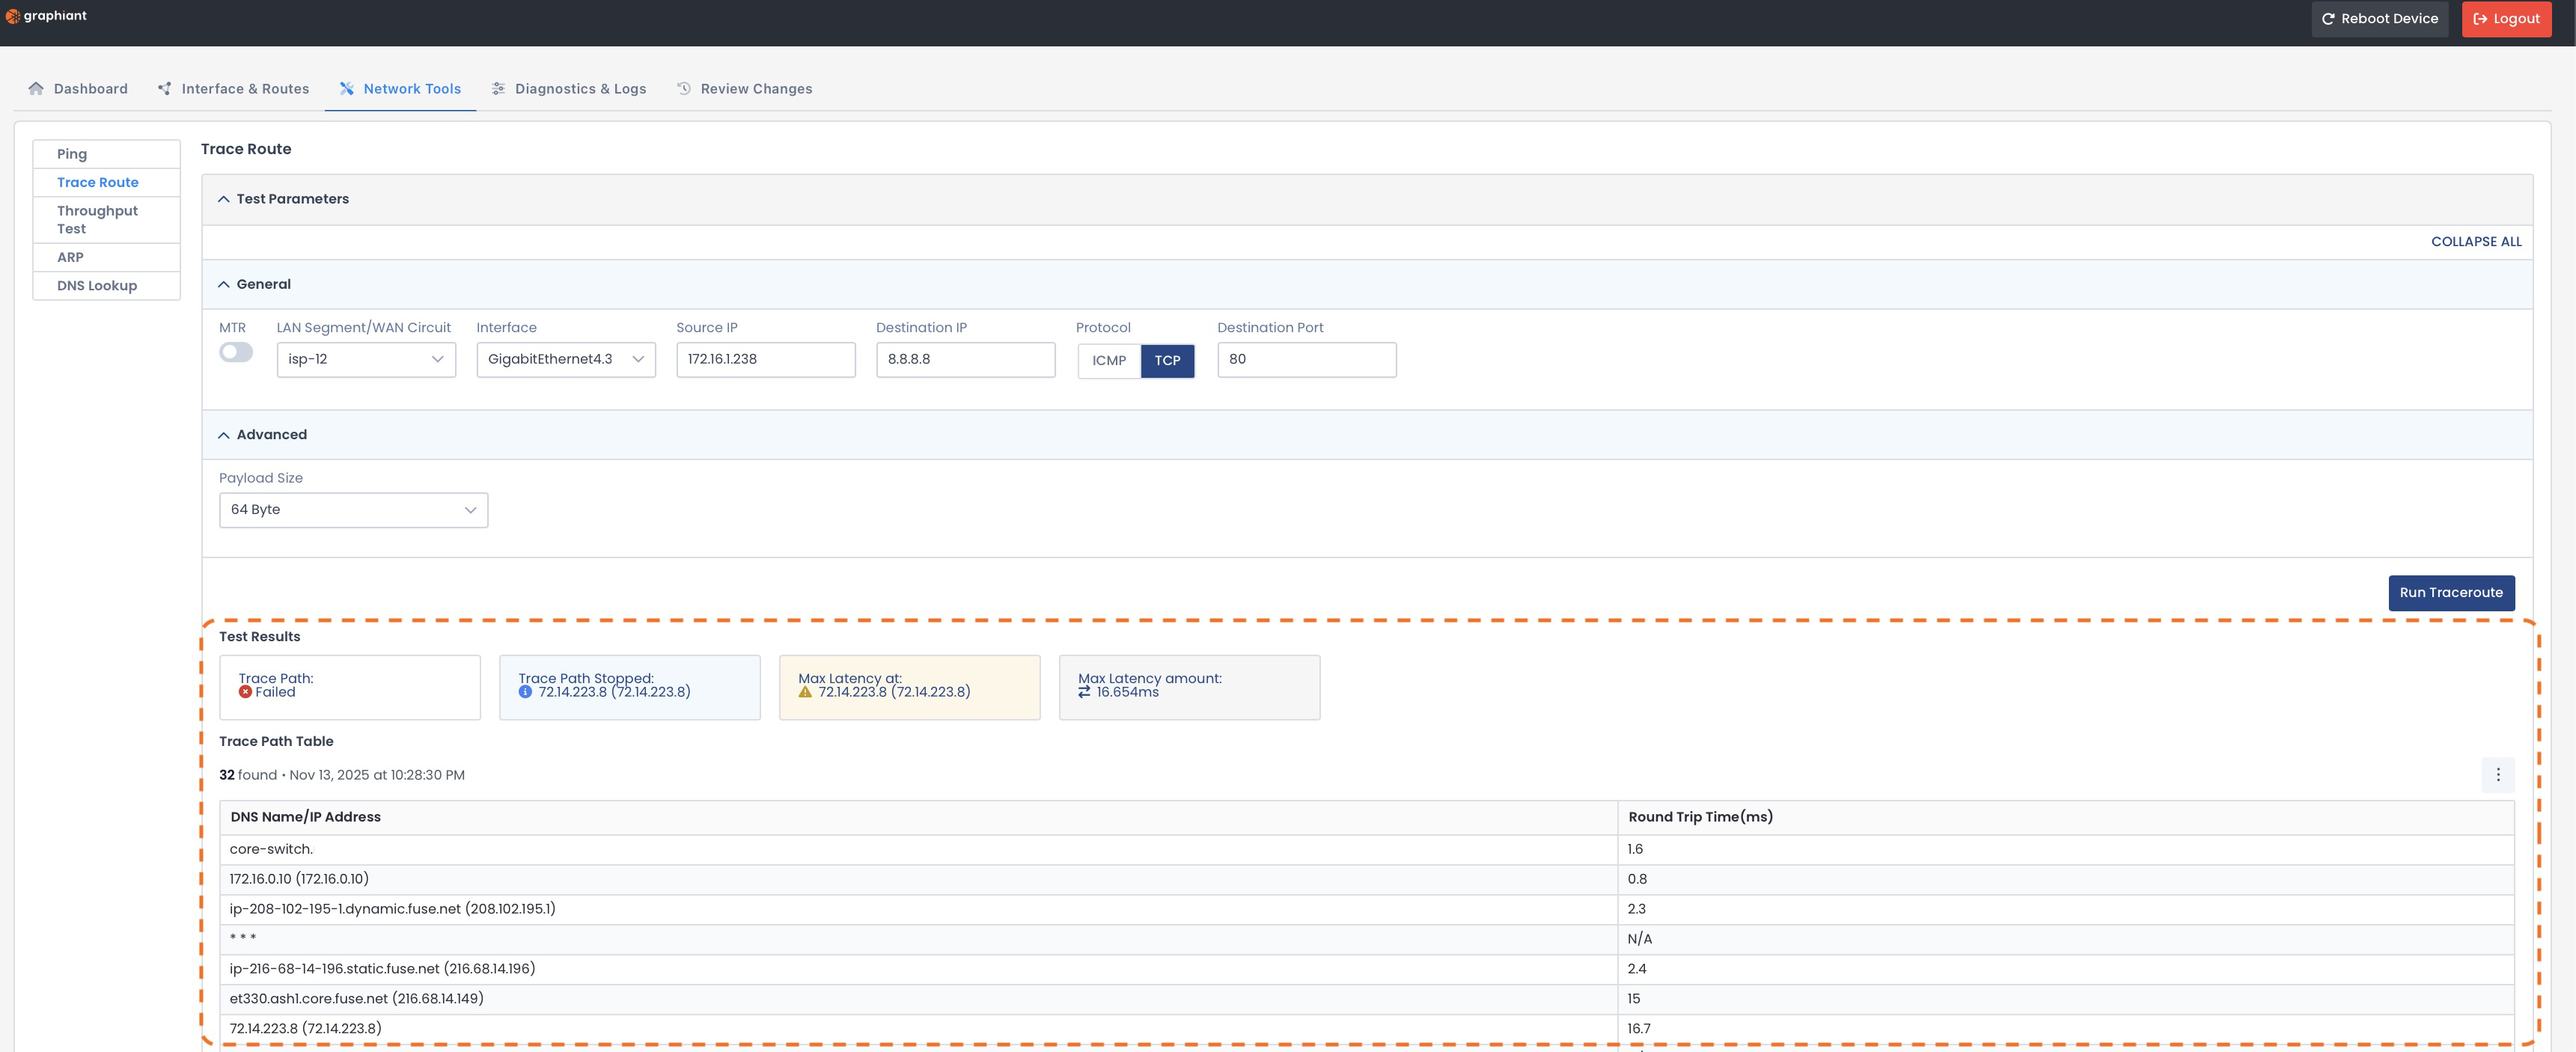
Click ‘Run Traceroute’.
.jpg)
Trace Route results (No MTR).
The results will appear at the bottom of the page and include:
Test Results:
Trace Path: Successful / Failed
Trace Path Stopped: Last hop that responded before the path stopped and ended the trace
Max Latency at: Which hop experienced the highest delay
Max Latency amount: Longest response time recorded during the trace
Trace Path Table:
DNS Name / IP Address: Hostname and IP address of each hop along the route
Round Trip Time: Time for a packet to reach a hop and return
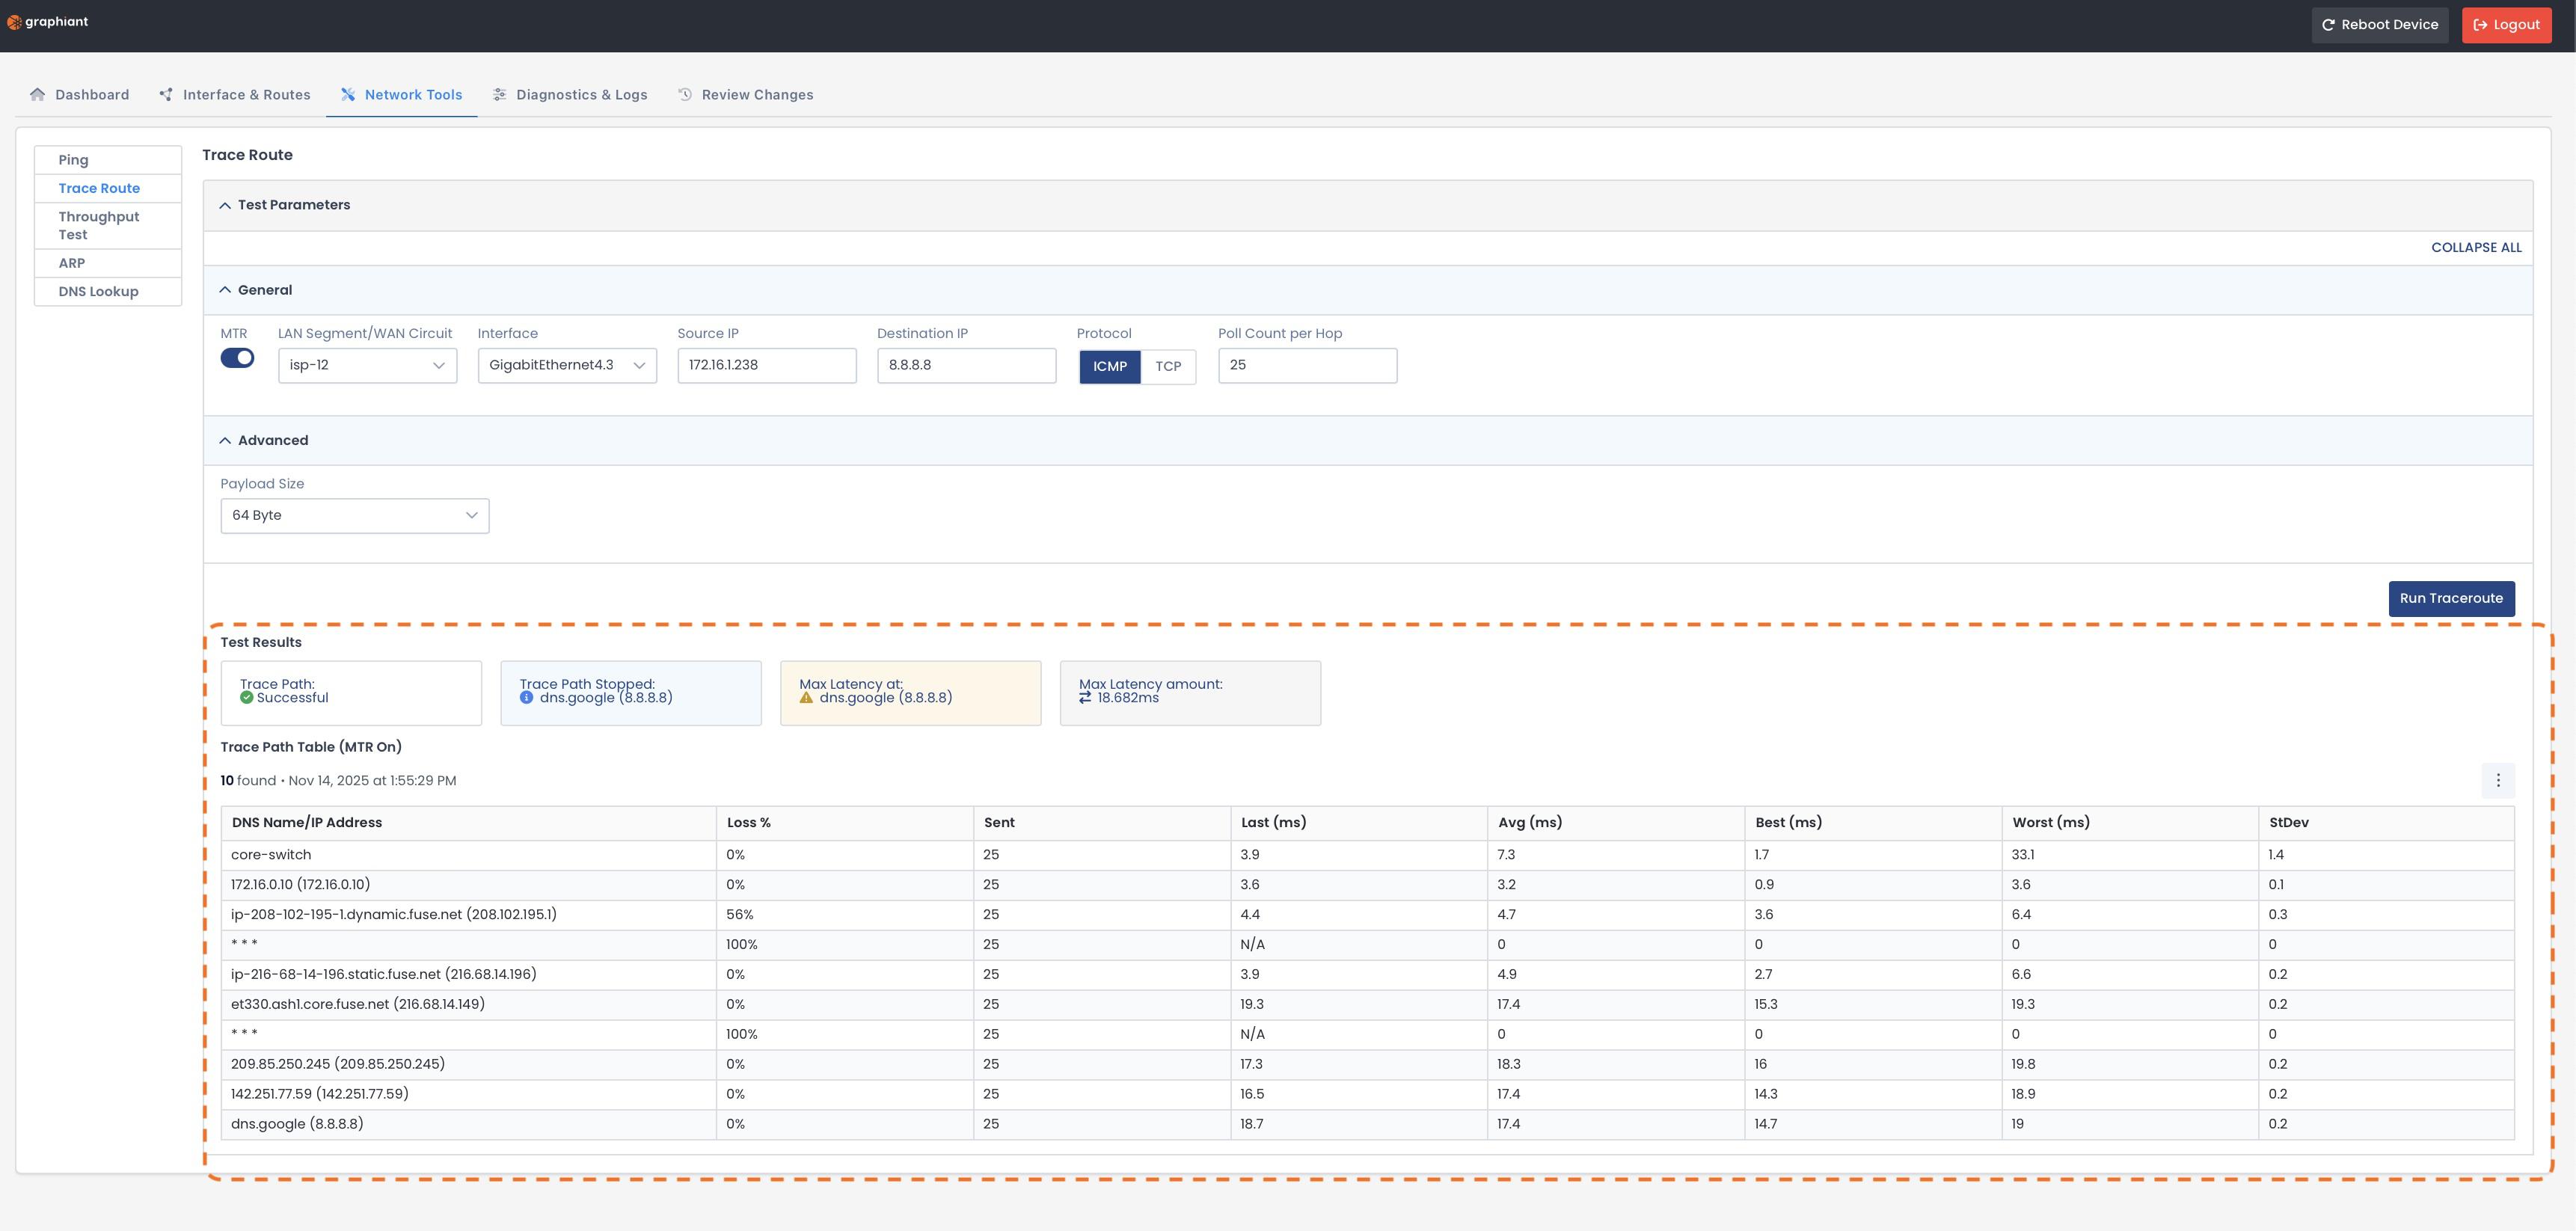
Trace Route with MTR Results
The results will appear at the bottom of the page and include:
Test Results:
Trace Path: Successful / Failed
Trace Path Stopped: Last hop that responded before the path stopped and ended the trace
Max Latency at: Which hop experienced the highest delay
Max Latency amount: Longest response time recorded during the trace
Trace Path Table:
DNS Name / IP Address: Hostname and IP address of each hop along the route
Loss %: Percentage of packets lost at each hop
Sent: Total number of probe packets sent to that hop
Last: Latency from the most recent probe packet
Average: Average round-trip time to that hop across all probes
Best: Shortest round-trip time recorded for that hop
Worst: Longest round-trip time recorded for that hop
StDev (Standard Deviation): How much the latency varies; higher values = less stable performance
Throughput Test
When you test connectivity using the Throughput Test capability, you measure the speed of your data transmission.
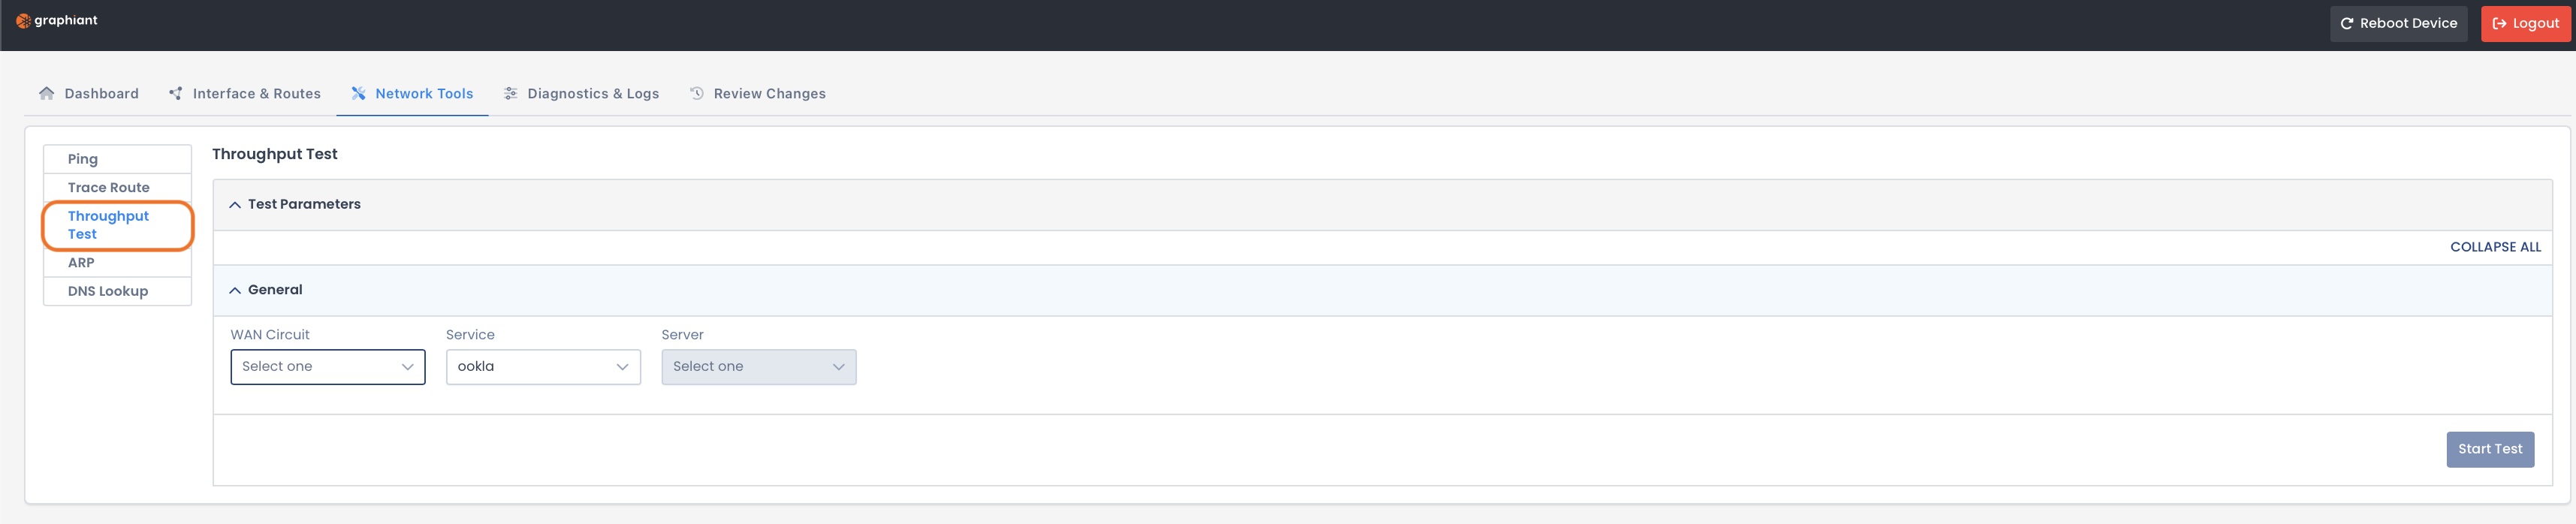
Complete the following fields:
WAN Circuit: Network connection used to run the throughput test
Service: Throughput test service provider
Server: Test endpoint that measures data transfer speed between your site and the network

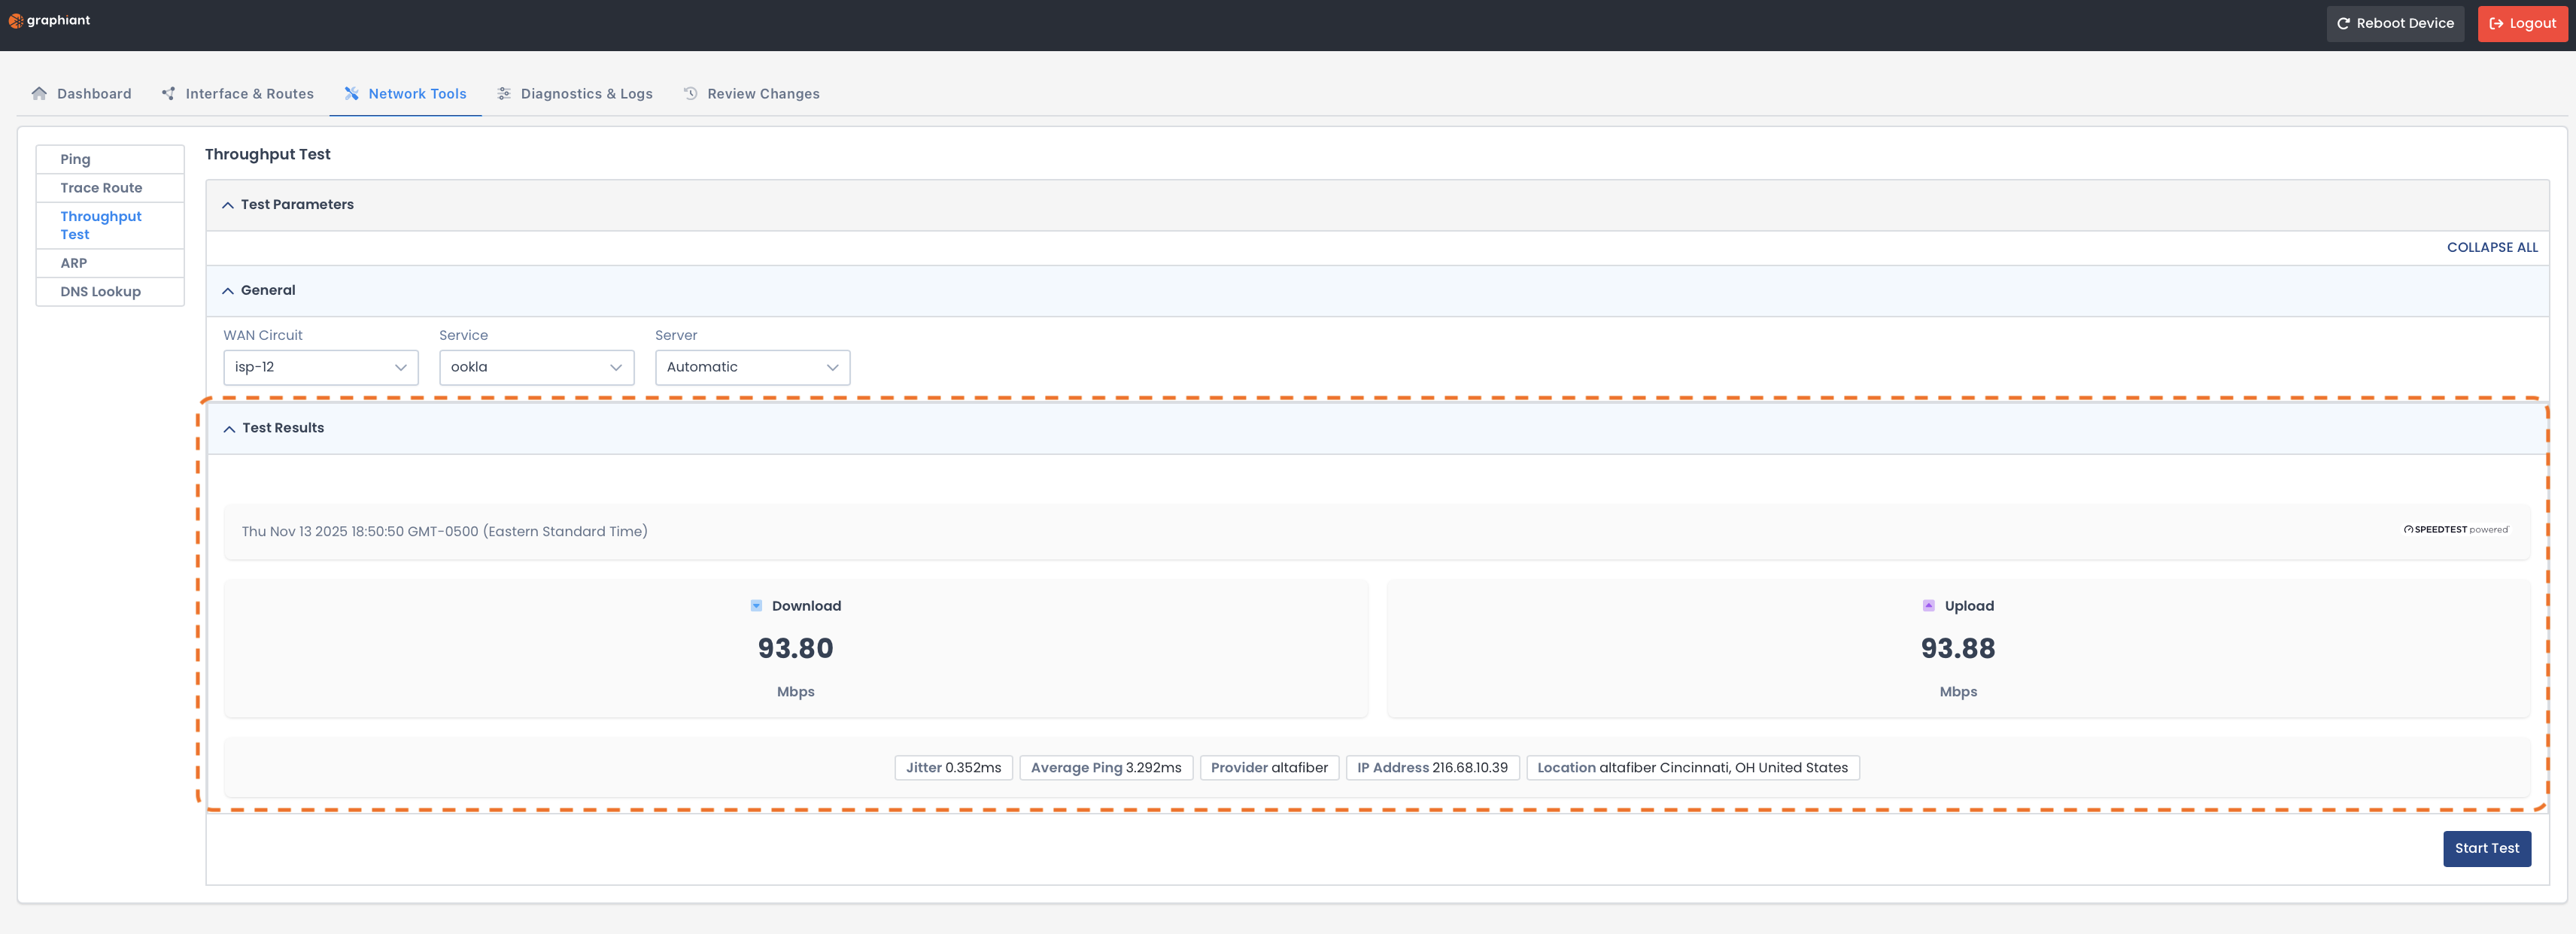
The results will appear at the bottom of the page and include:
Download: Speed at which data is received from the test server
Upload: Speed at which data is sent to the test server
Jitter: Variation in packet delay; lower values = more stable connection
Average Ping: Average round-trip time for test packets between your site and the server
Provider: Name of the internet service provider (ISP) used for this test connection
IP Address: Public IP address detected for the test server
Location: Geographic location of the test server
ARP (Address Resolution Protocol)
When you test connectivity using the ARP capability, you view IP-to-MAC address mappings to verify local device communication.
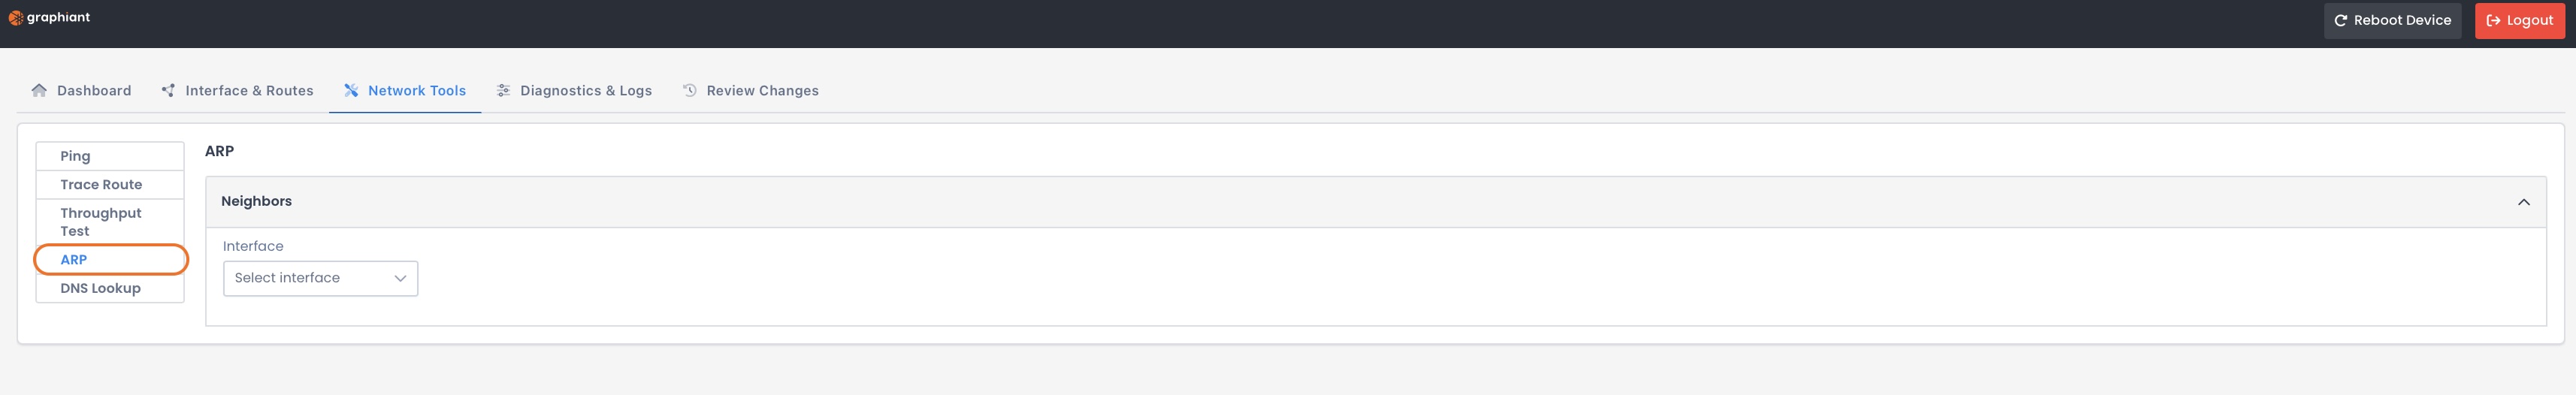
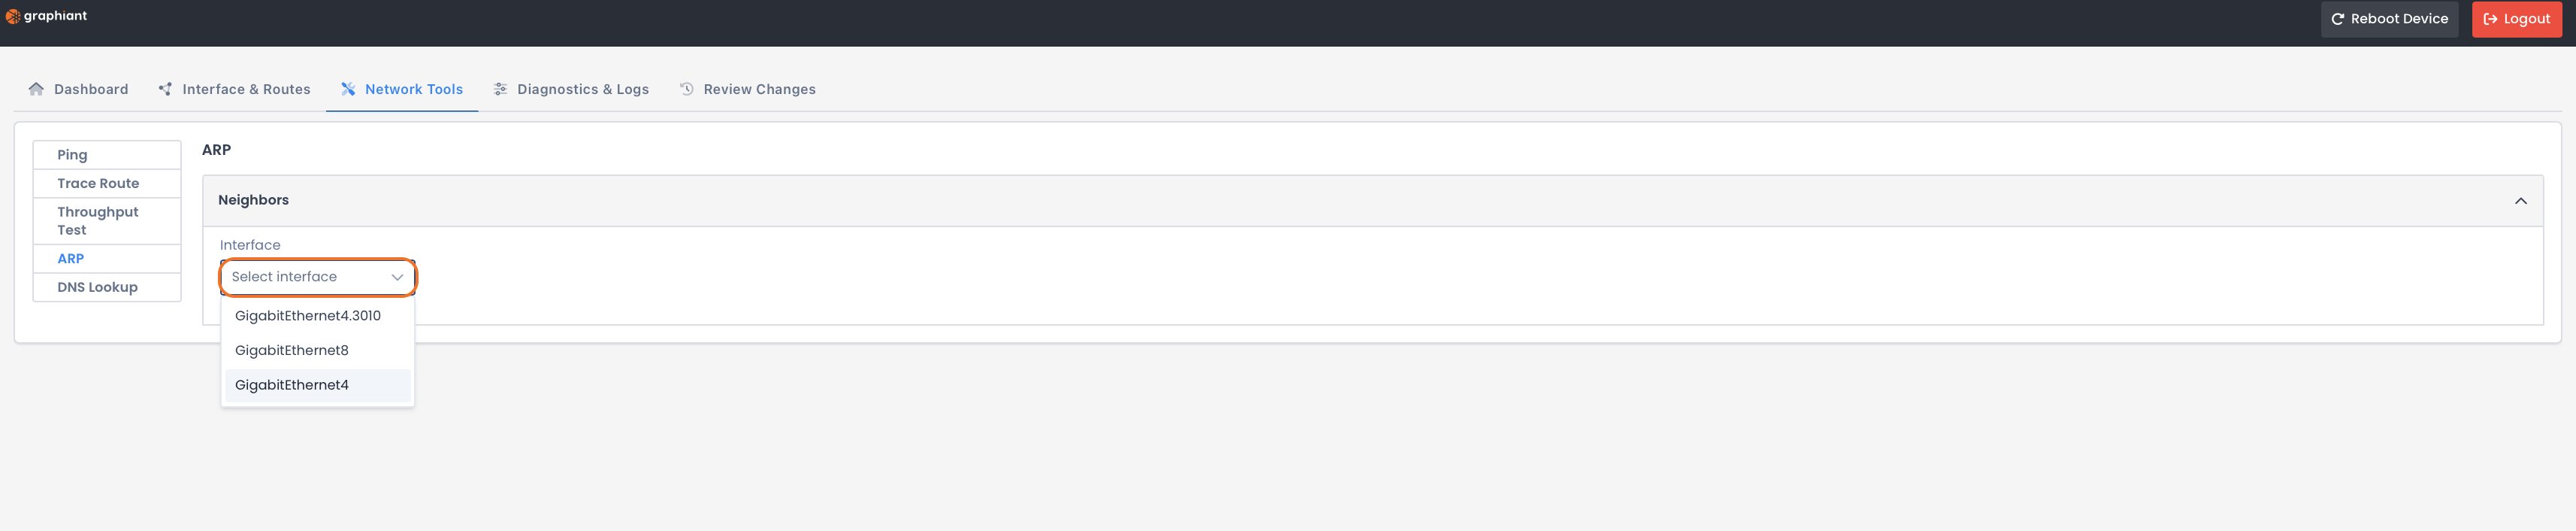
Select the interface you want to use to check for IP-to-MAC address mapping.
The ARP test will run immediately when you select the interface.
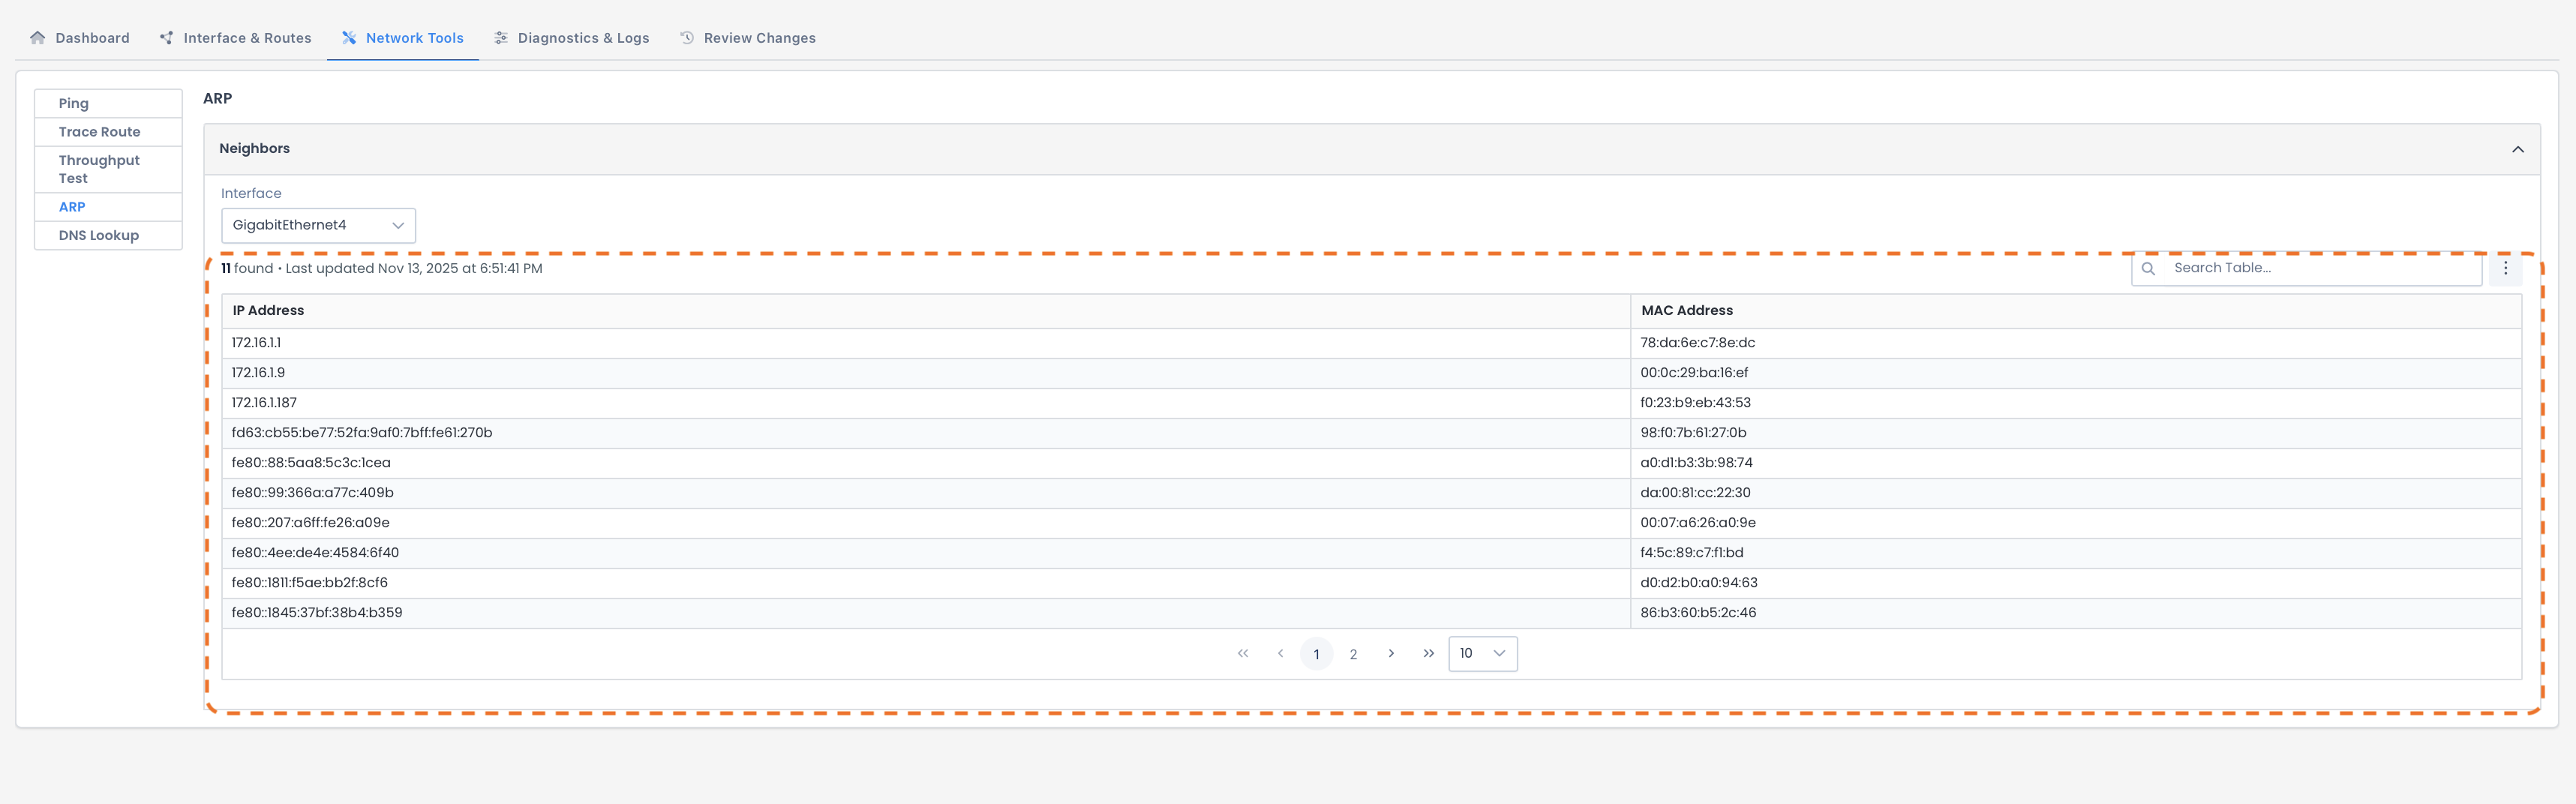
The results will appear at the bottom of the page and include:
IP Address: Network address of the device
MAC Address: Physical hardware address linked to that corresponding IP
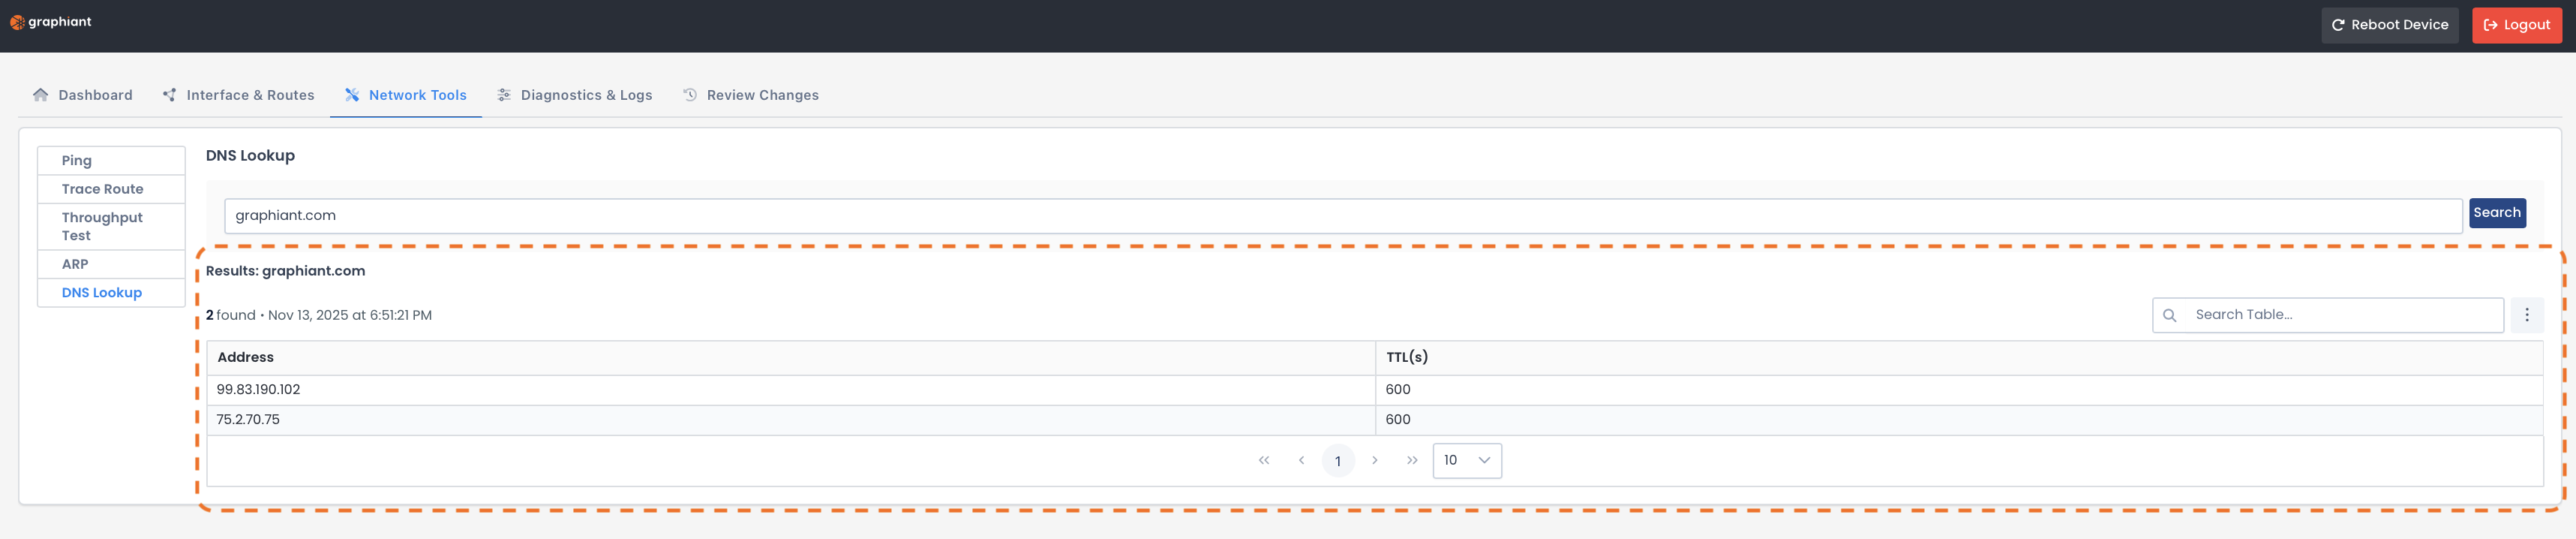
DNS Lookup
When you test connectivity using the DNS Lookup capability, the domain name is resolved to its IP address to confirm DNS is working correctly.
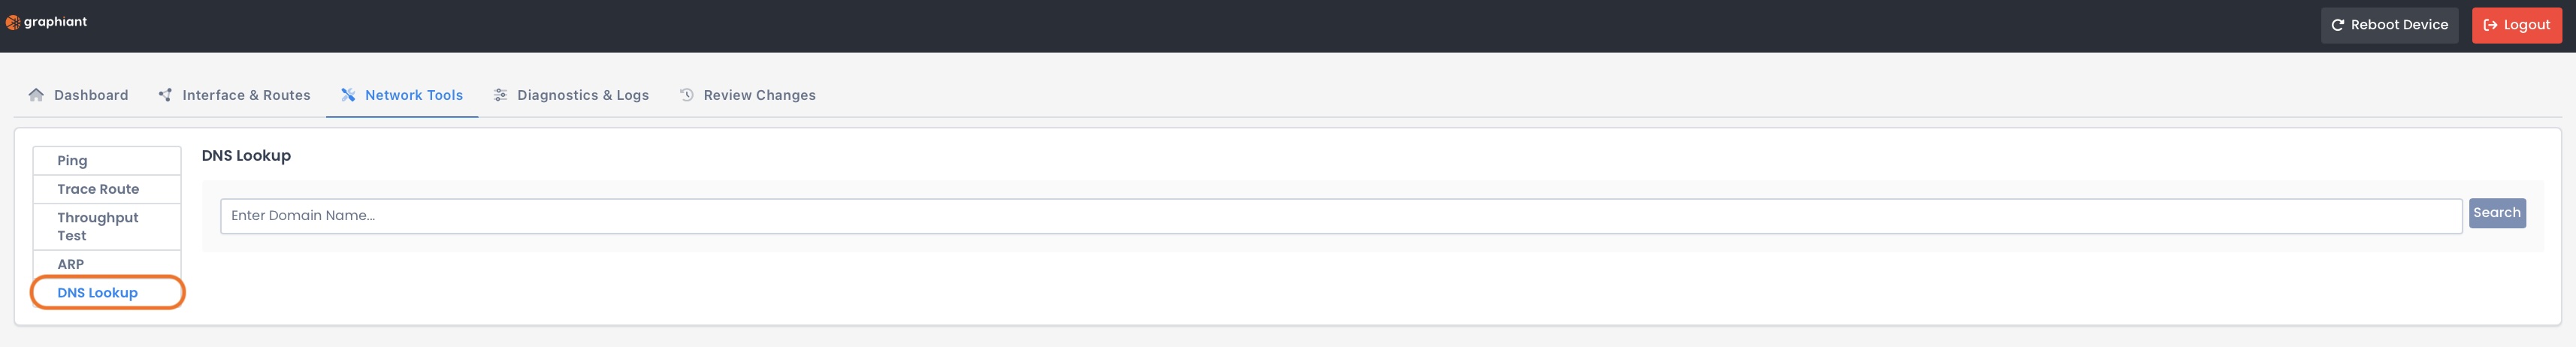
Type the hostname / website you want to look up.
Click ‘Search’.

The results will appear at the bottom of the page and include:
Address: IP address resolved for the domain
TTL (Time To Live): Time in seconds the DNS record remains valid before refresh
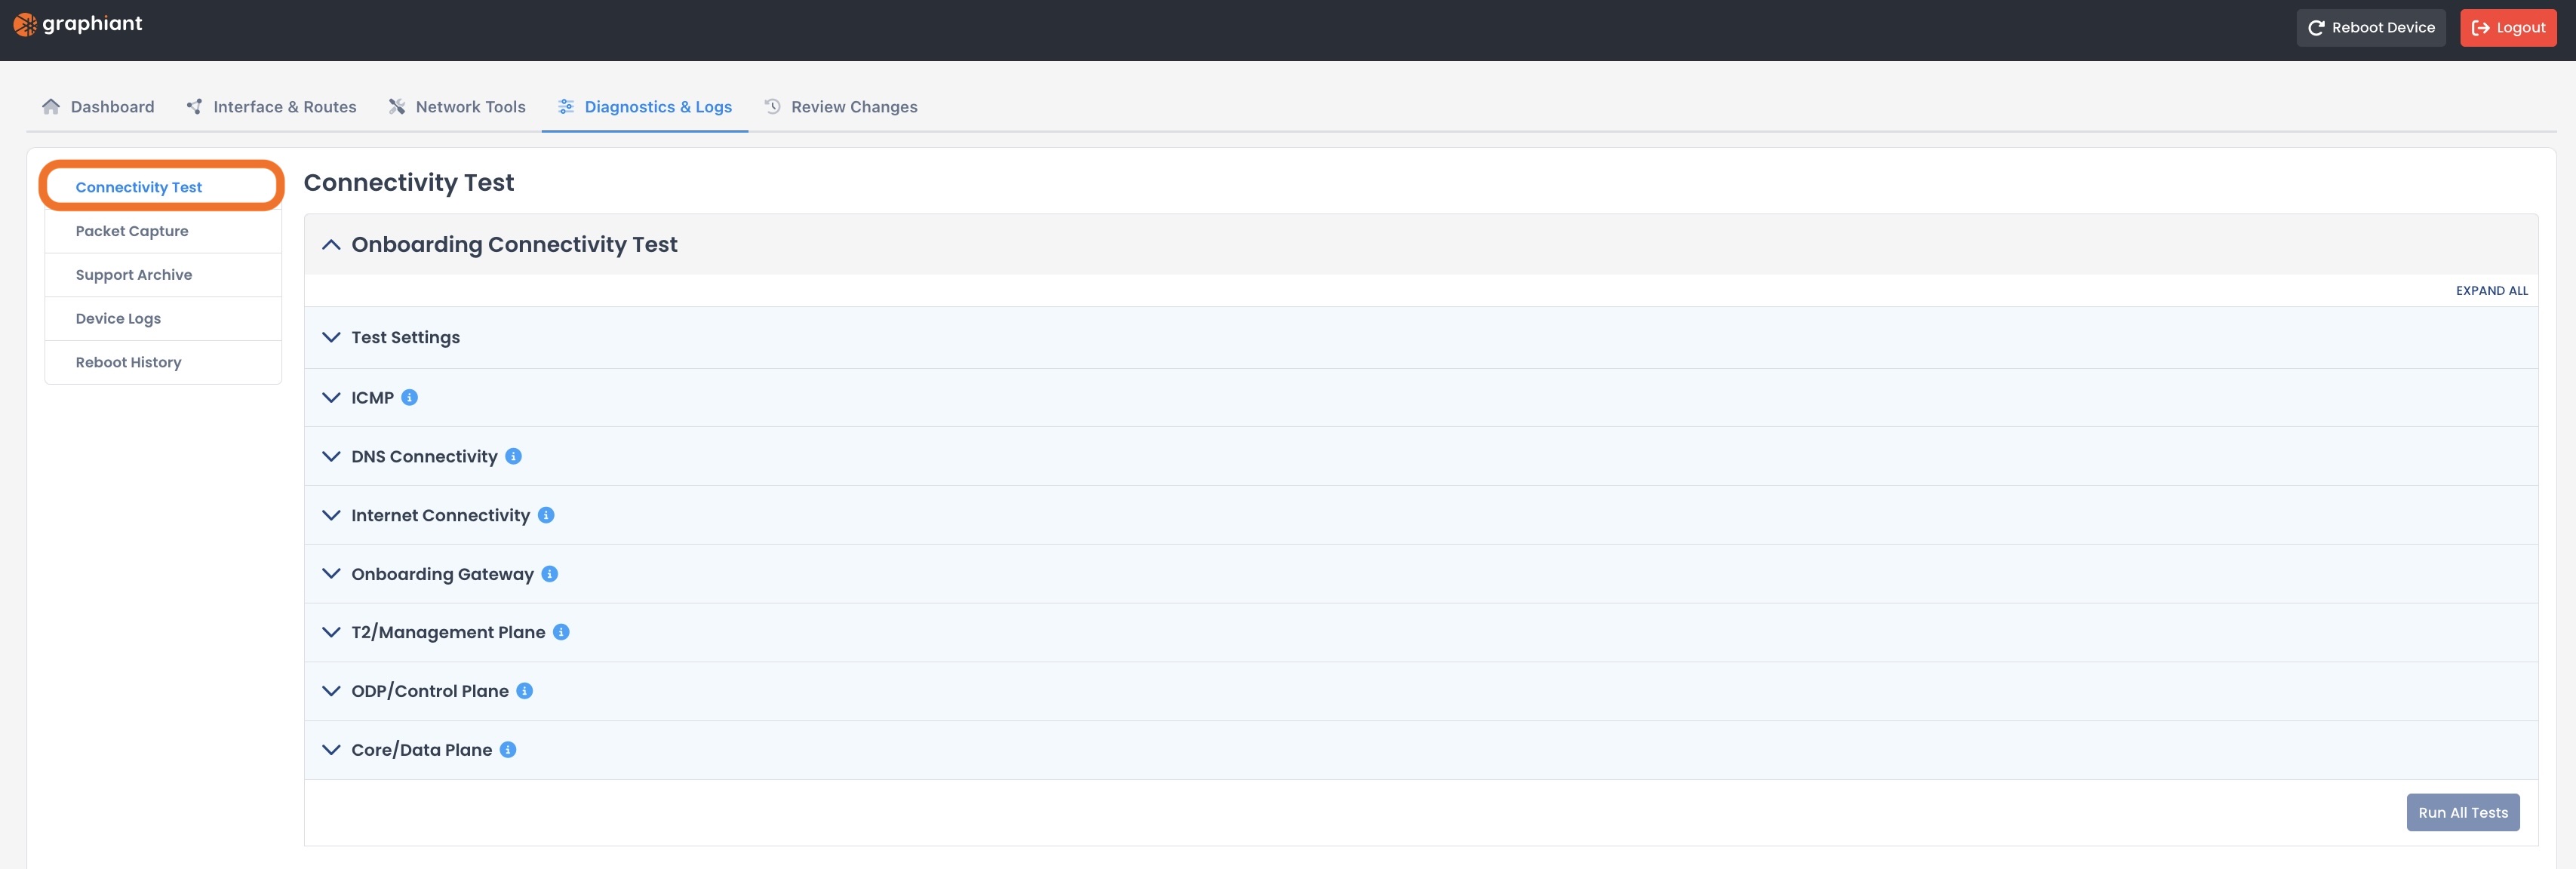
Diagnostics & Logs
The Diagnostics & Logs tab provides access to the following data and histories for troubleshooting and analysis:
Connectivity Test: Checks that your Edge can reach internal and external endpoints
Packet Capture: Captures live network traffic on a selected interface to help analyze communication or troubleshoot issues
Support Archive: Gathers and bundles a comprehensive snapshot of a network device’s configuration and status for troubleshooting
Device Logs: Shows recorded activity for the device, including configuration or connection changes over time
Reboot History: Displays a log of past device reboots, including timestamps and reasons when available.
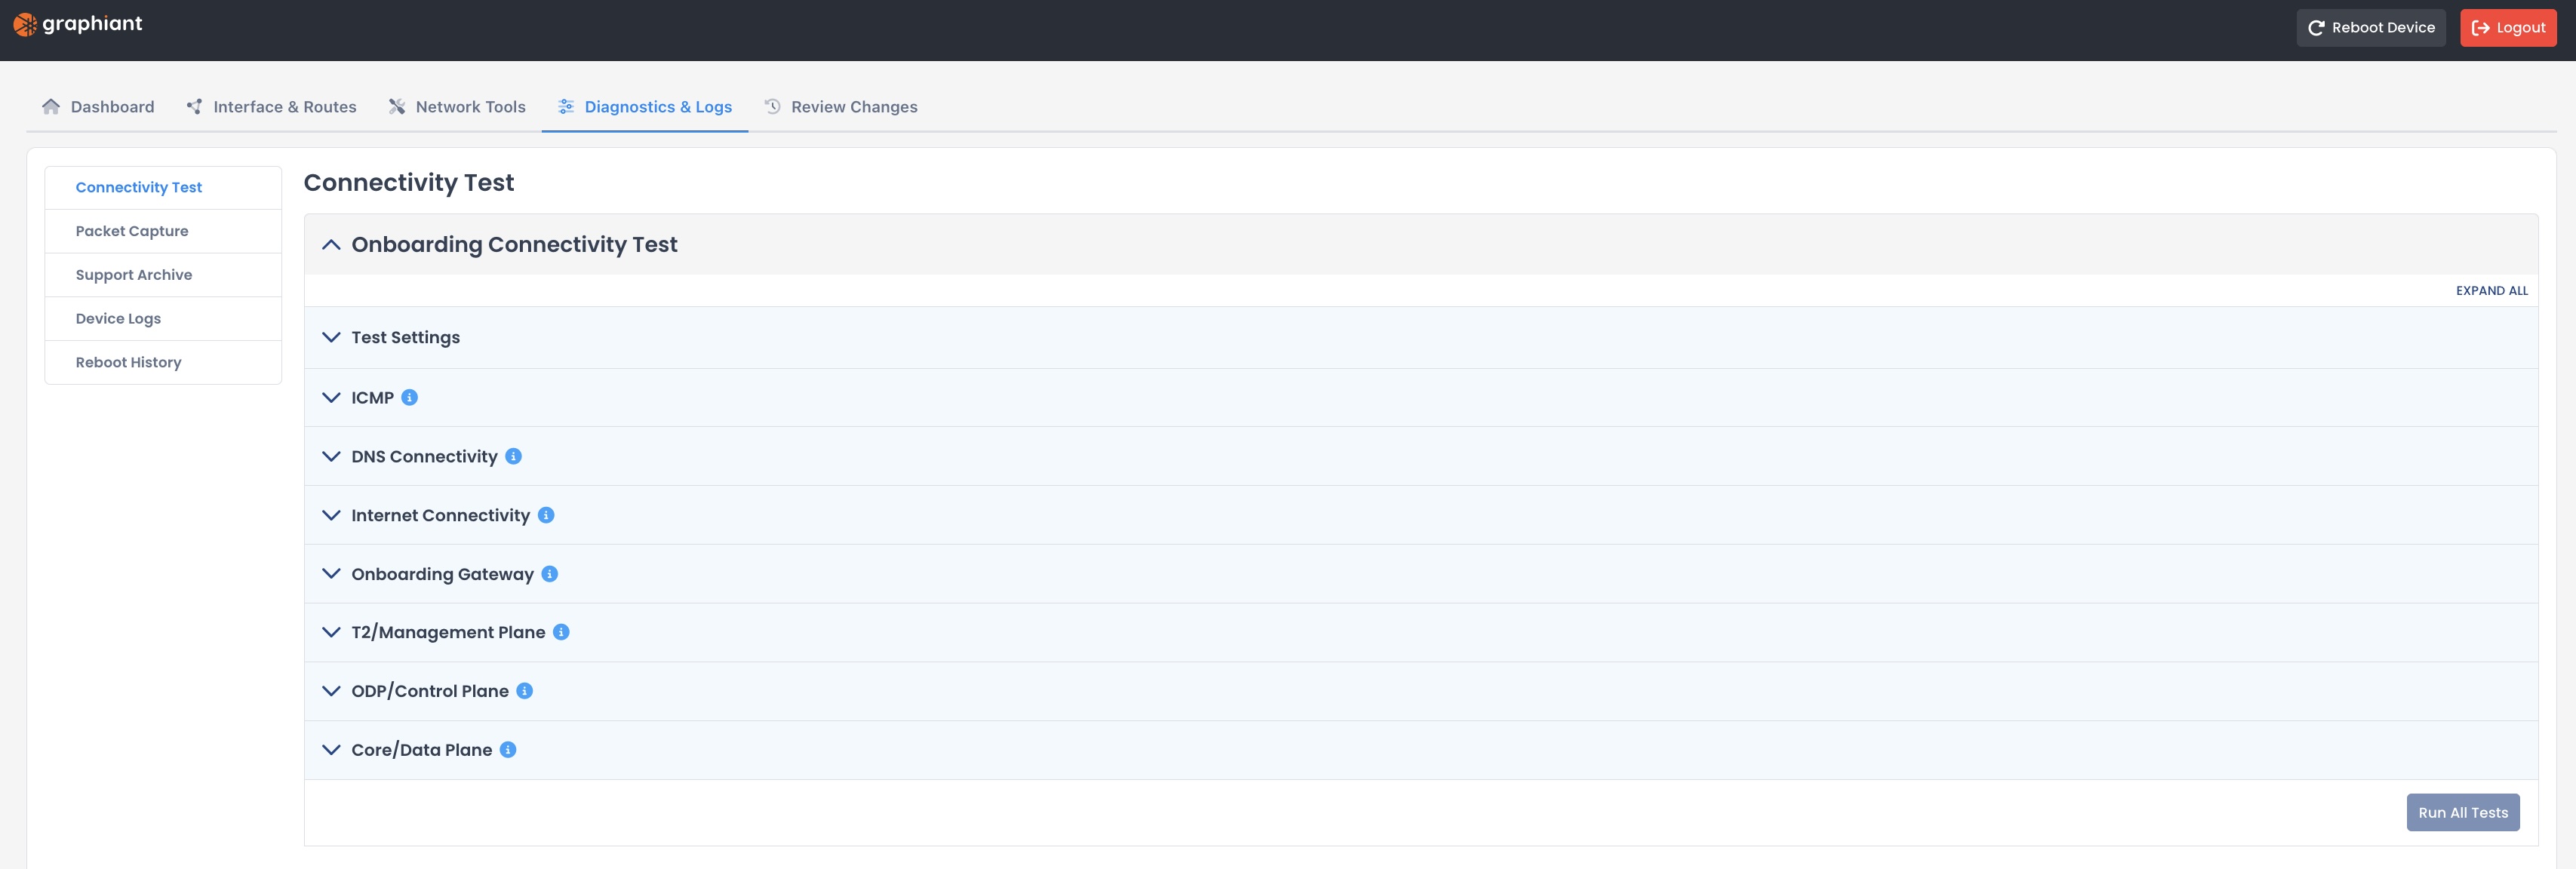
Connectivity Test
The connectivity test verifies that your Edge can reach Graphiant services as well as external endpoints across all necessary network planes and protocols.
Click the carat for Test Settings.
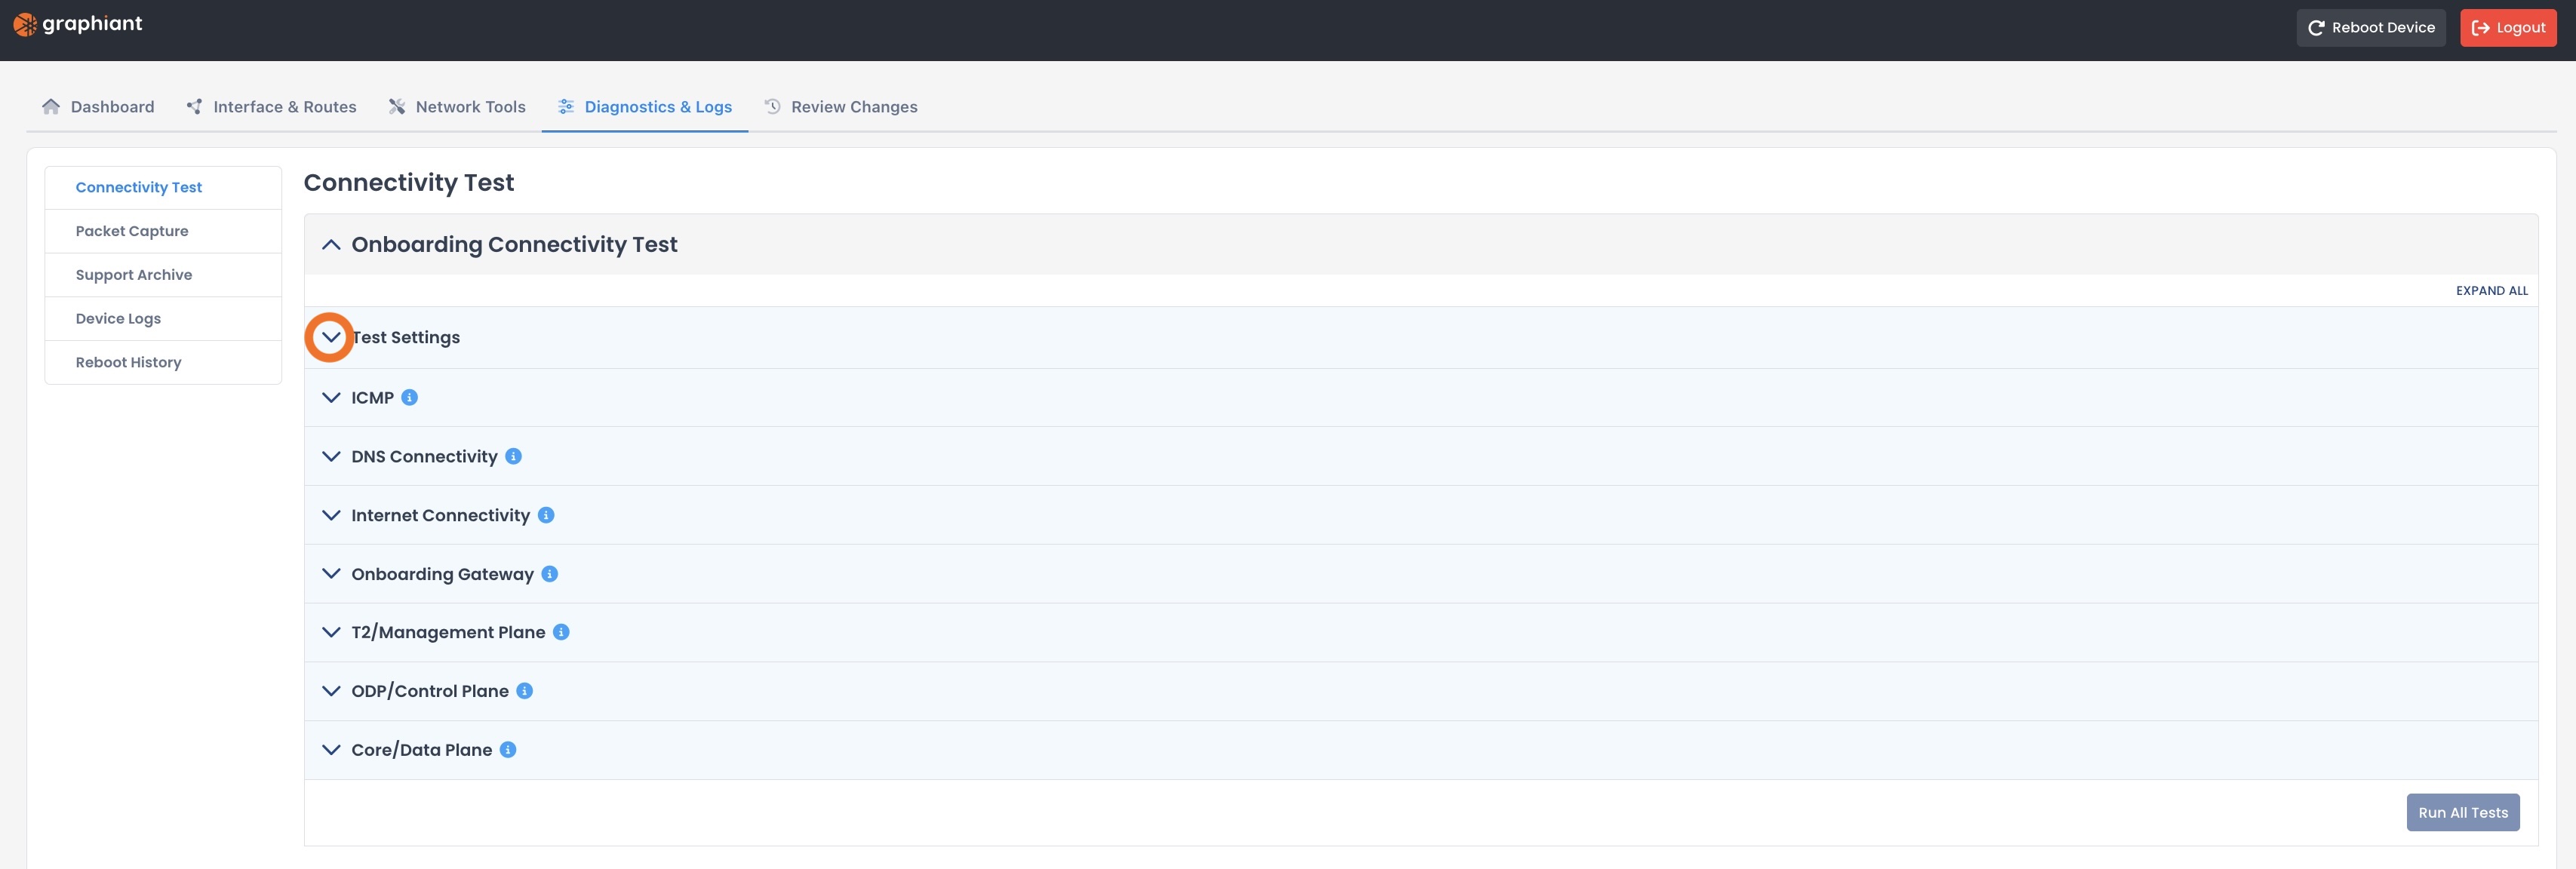
Select the circuit that you wish to test.
Note:
By default:
isp-11 is assigned to the first WAN interface
isp-12 is assigned to the second WAN interface
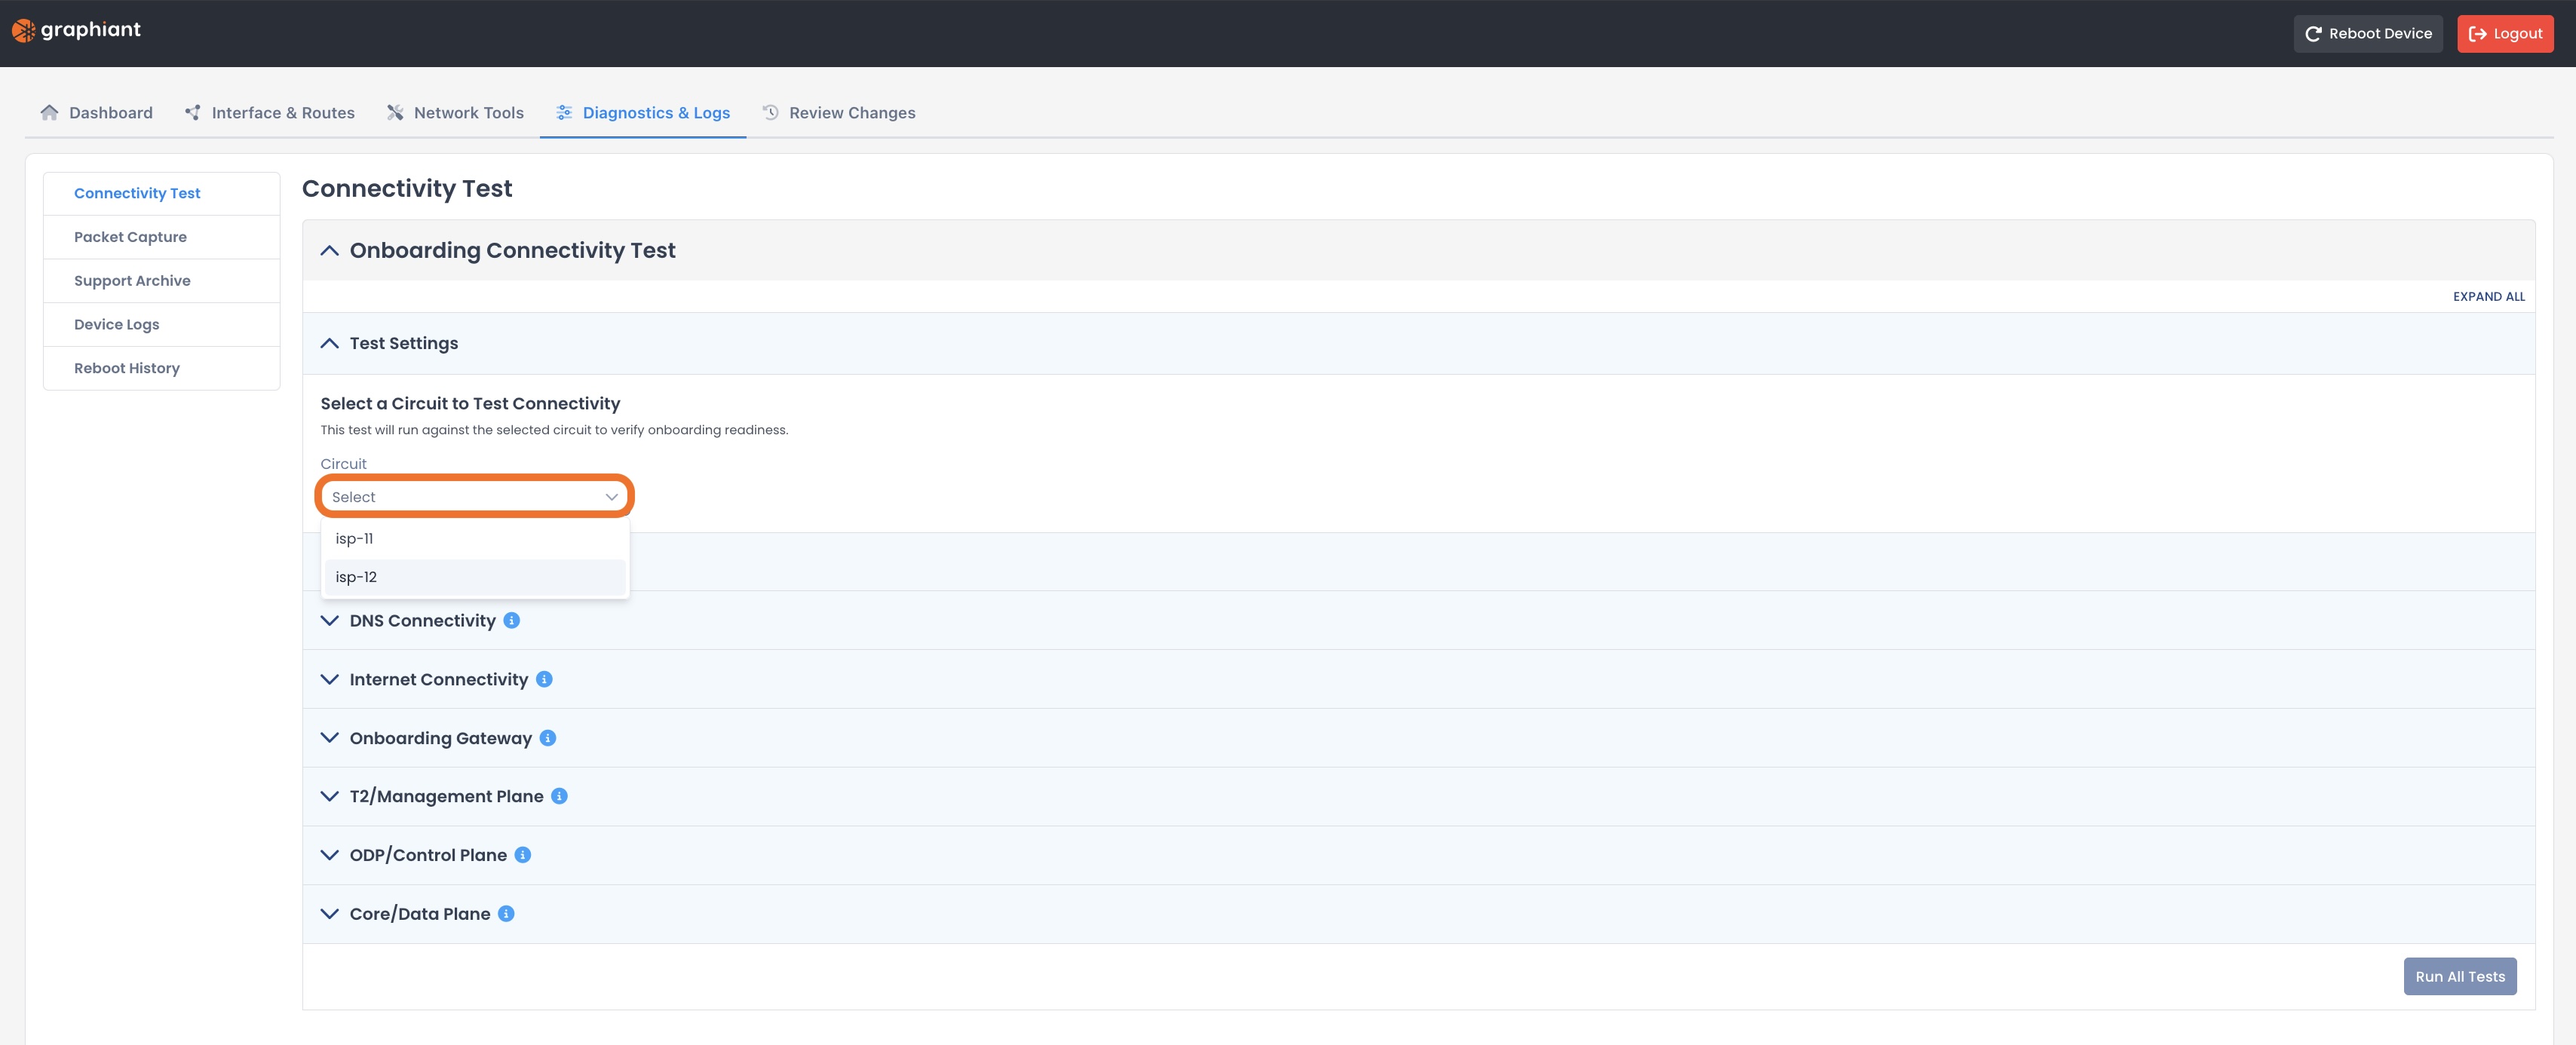
Click ‘Run All Tests’.
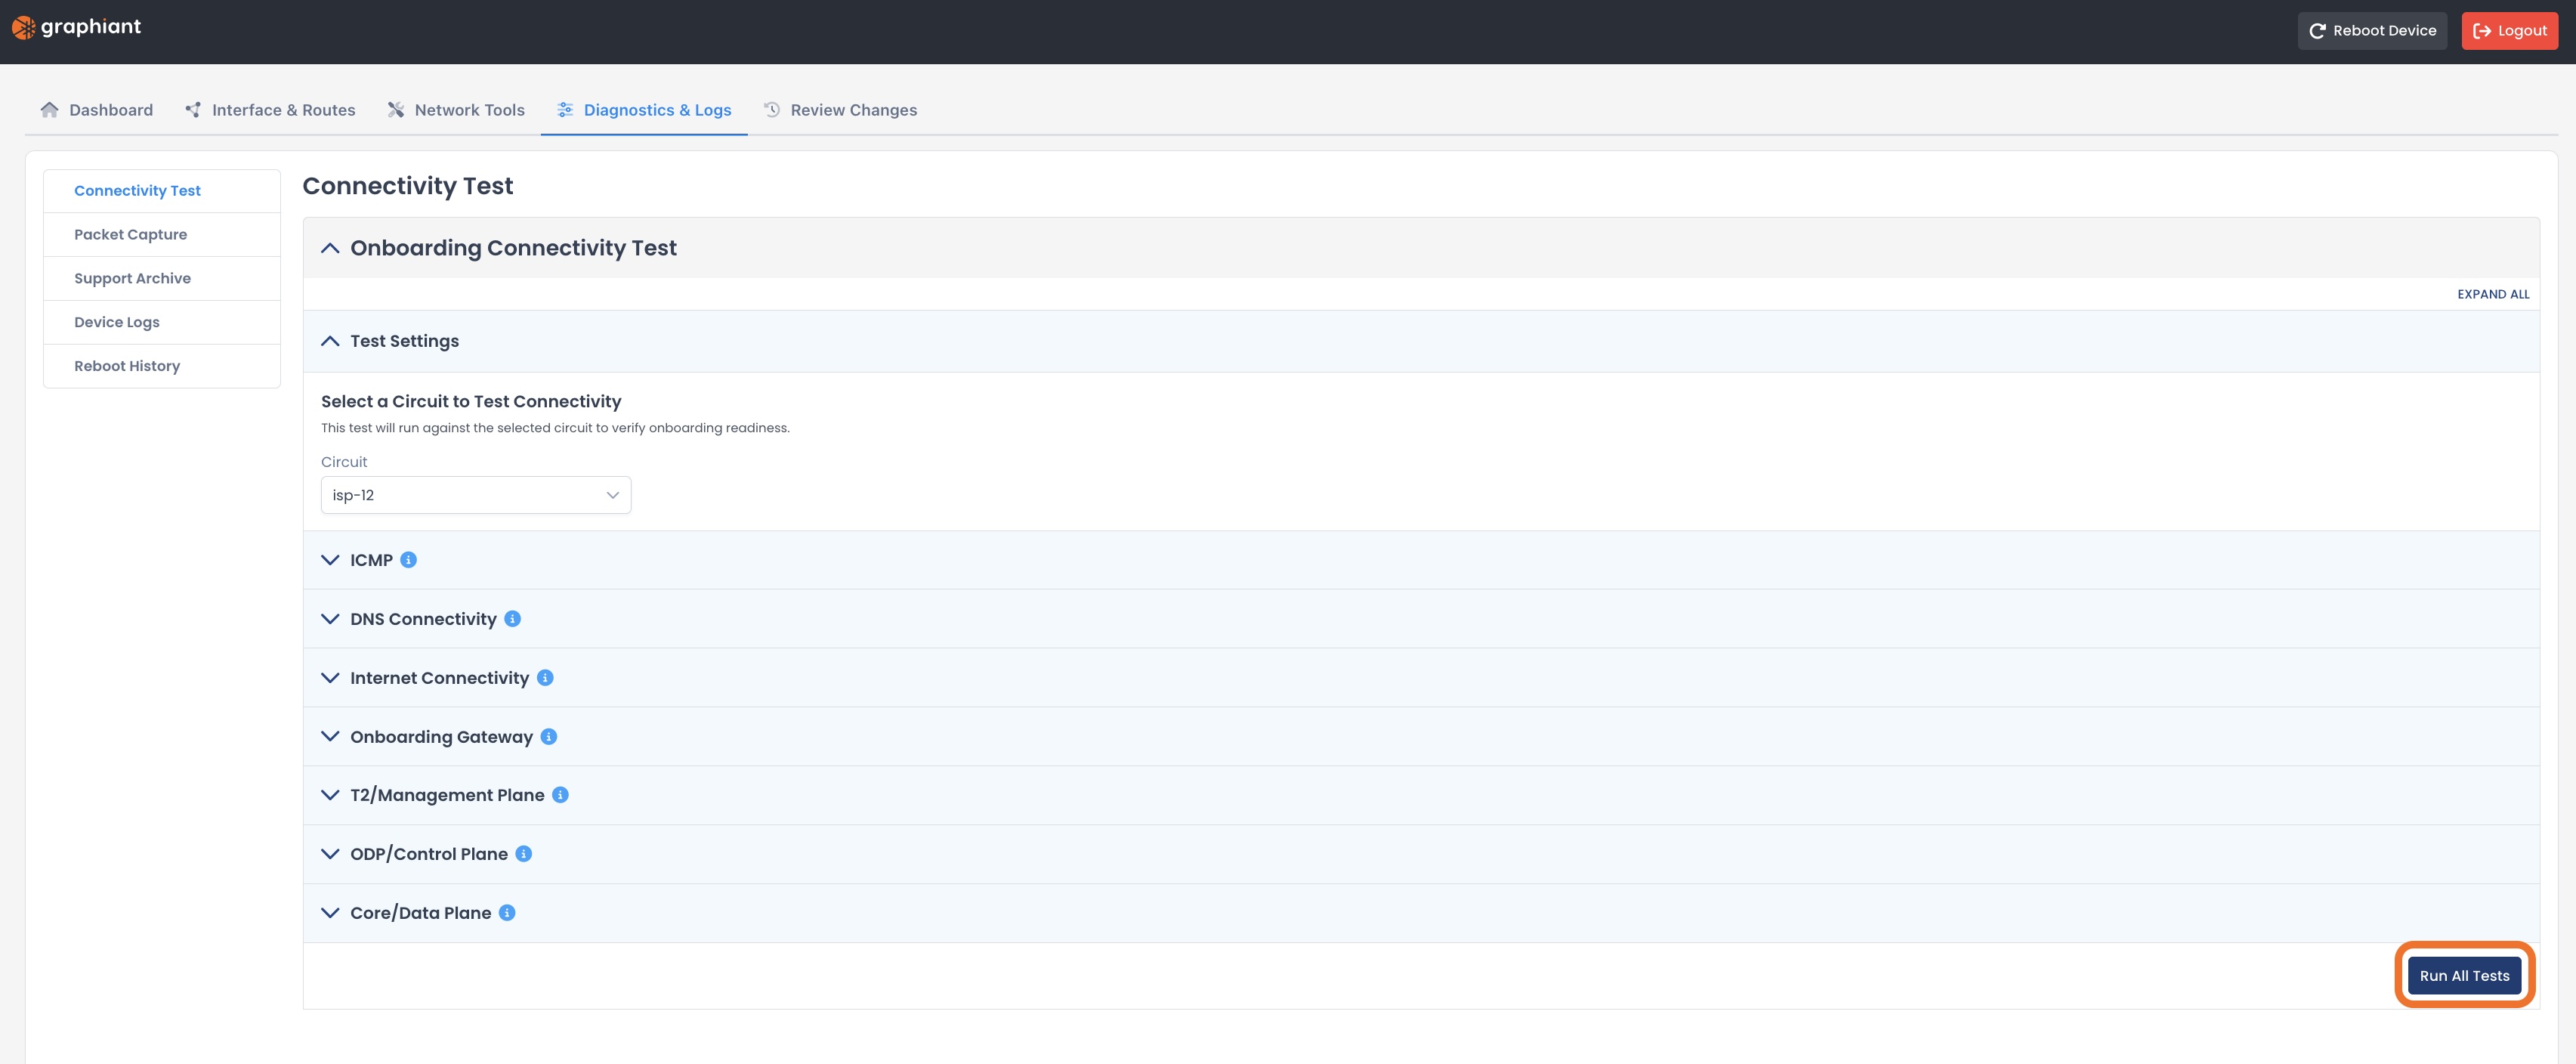
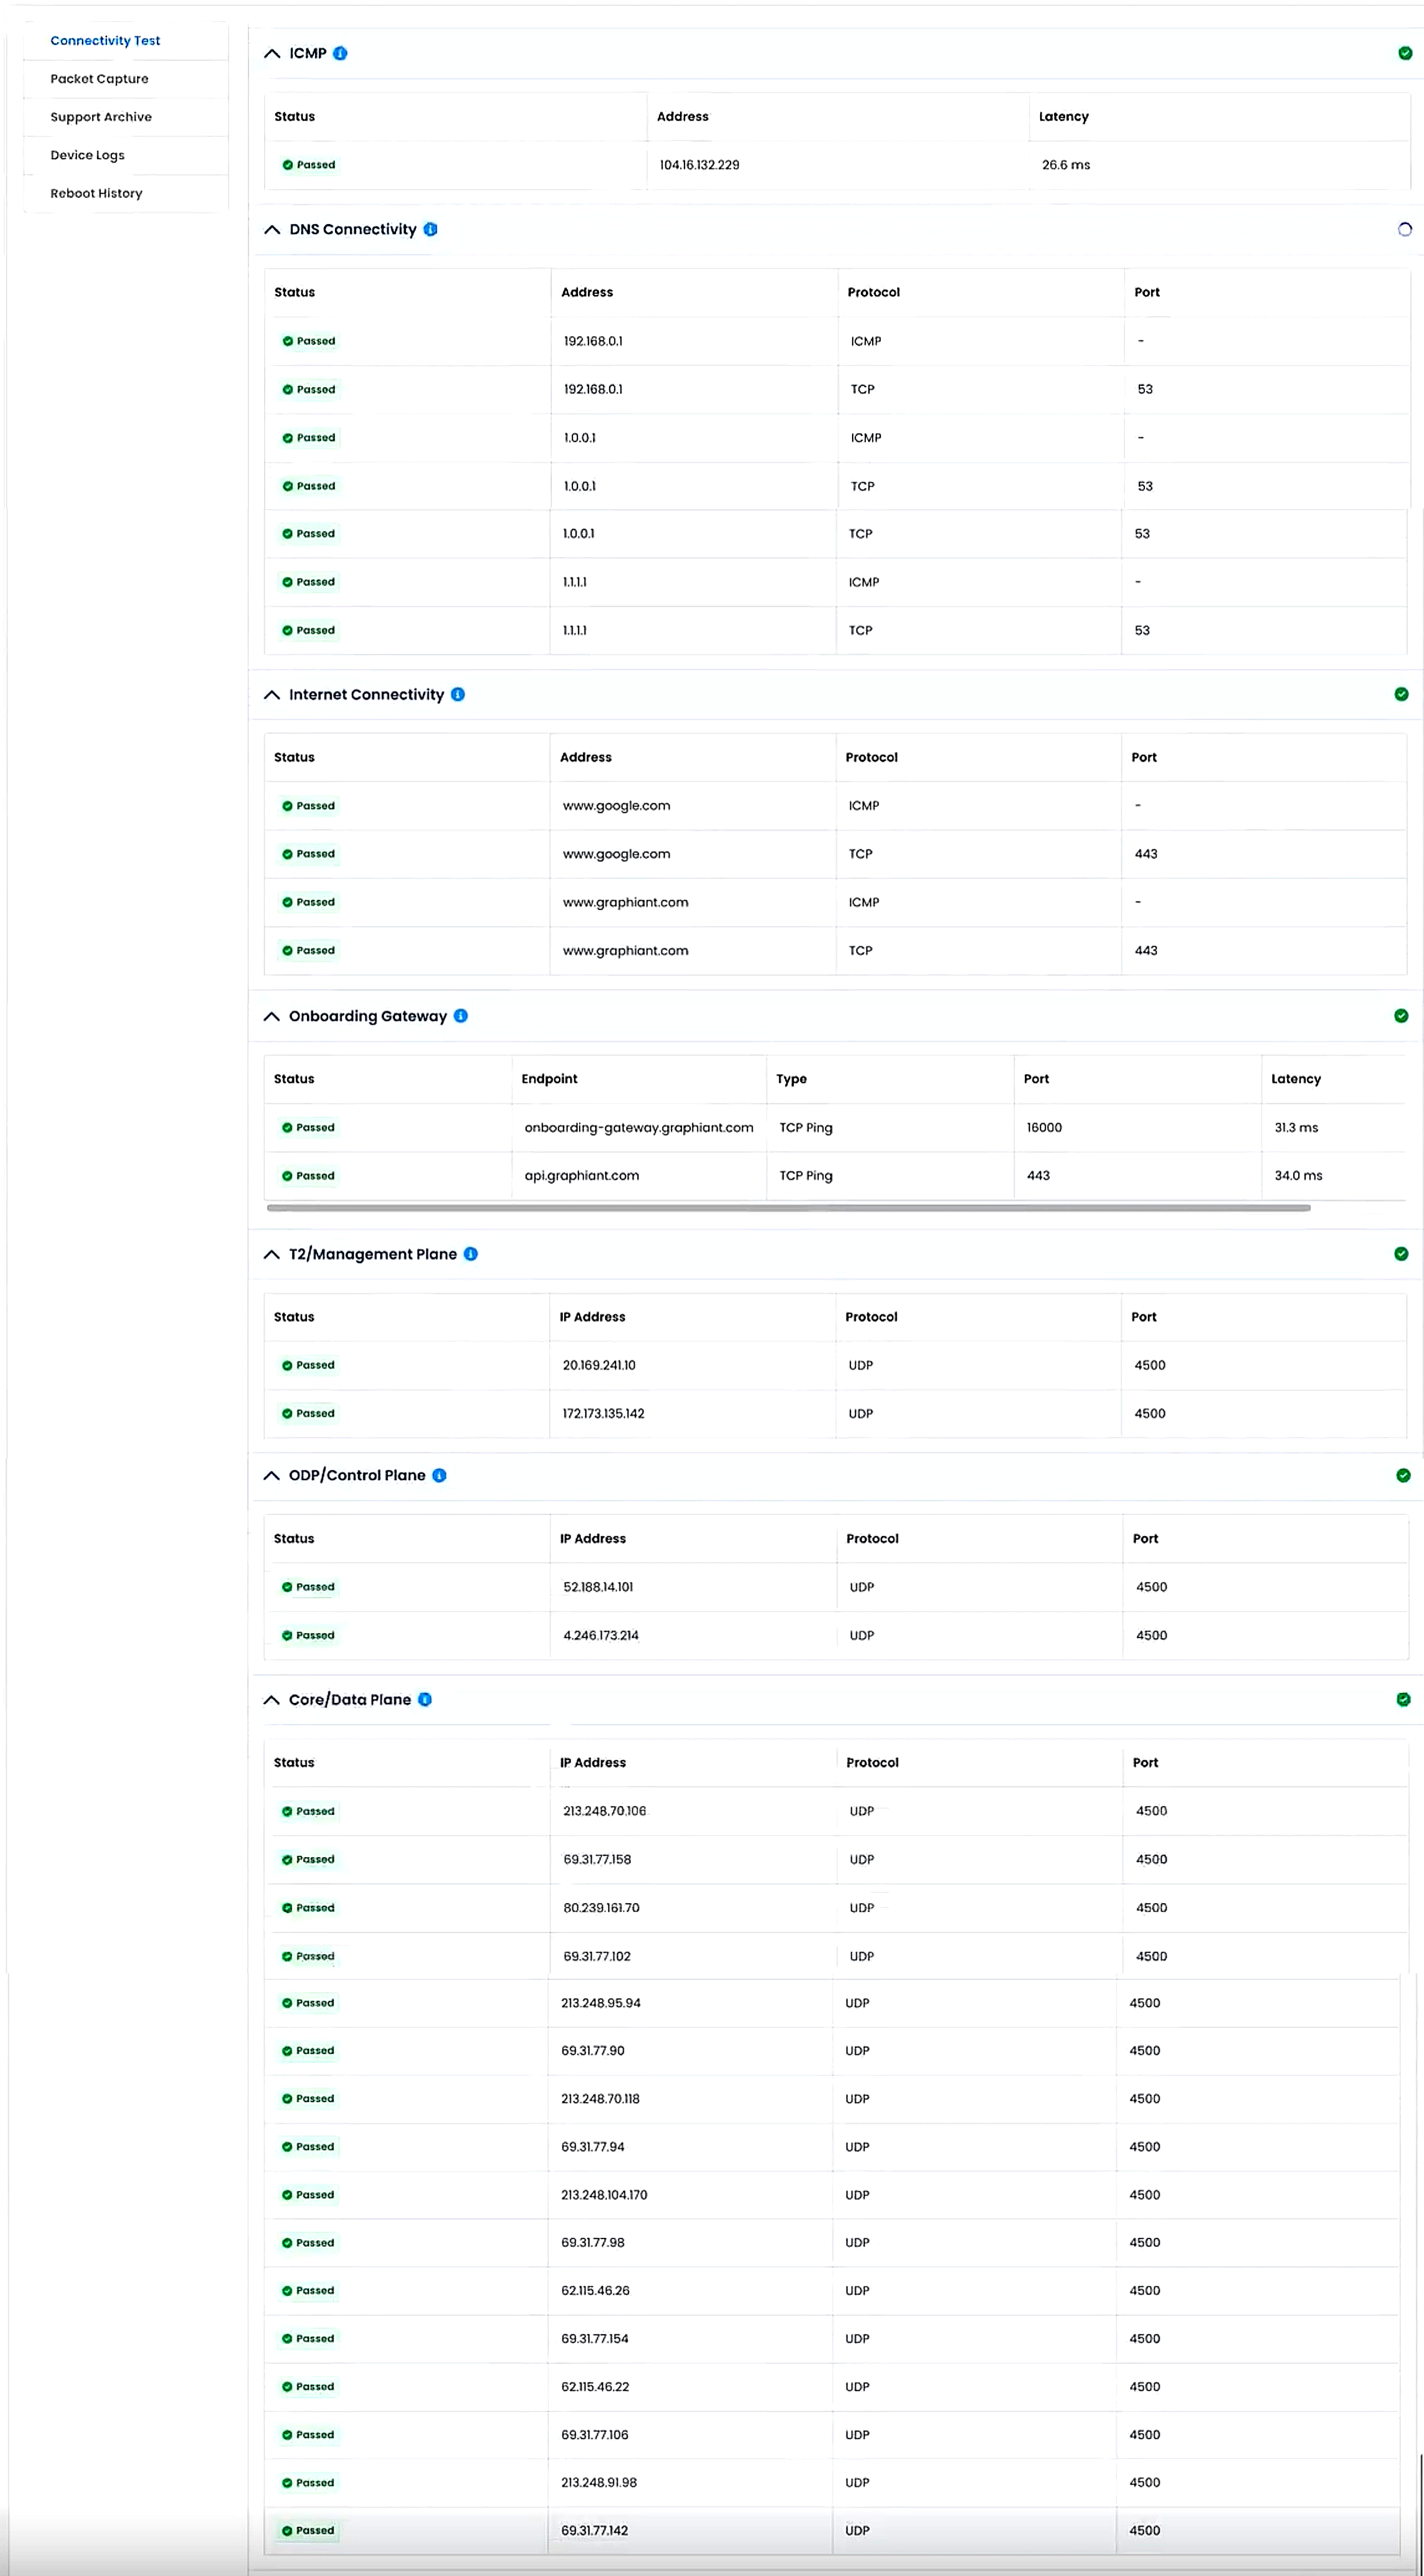
The specific test results will be shown under each test.
Packet Capture
Packet Capture helps you analyze communication, and troubleshoot issues, by capturing live network traffic on a specific interface.
.jpg)
Complete the following fields:
General:
WAN Circuit: Location of the packet capture
Interface: Specific network interface on that circuit from which to capture packets
Duration: How long the capture will run before automatically stopping
Max Packet Capture (Optional): Limit on the total number of packets to capture before ending the session
Regarding‘Duration’ and ‘Max Packet Capture’ values:
Whichever value is hit first will be the deciding end of the session
Filters (Optional):
Any, all, or no filters can be filled out depending on your needs.
Source
IP Address or Prefix: Captures only packets coming from this IP address or network range
Port: Captures only packets using this source port number
Destination
IP Address or Prefix: Captures only packets going to this IP address or network range
Port: Captures only packets using this destination port number
DSCP: Filters traffic to show only traffic with a specified DSCP value
Protocol: Limits capture to a specific protocol
Click ‘Start Capture’.

The results will be in an exportable file.
Click ‘Export’.

Support Archive
Support Archive gives you a comprehensive snapshot of a network device’s configuration and status for troubleshooting, able to be utilized by our Support team.
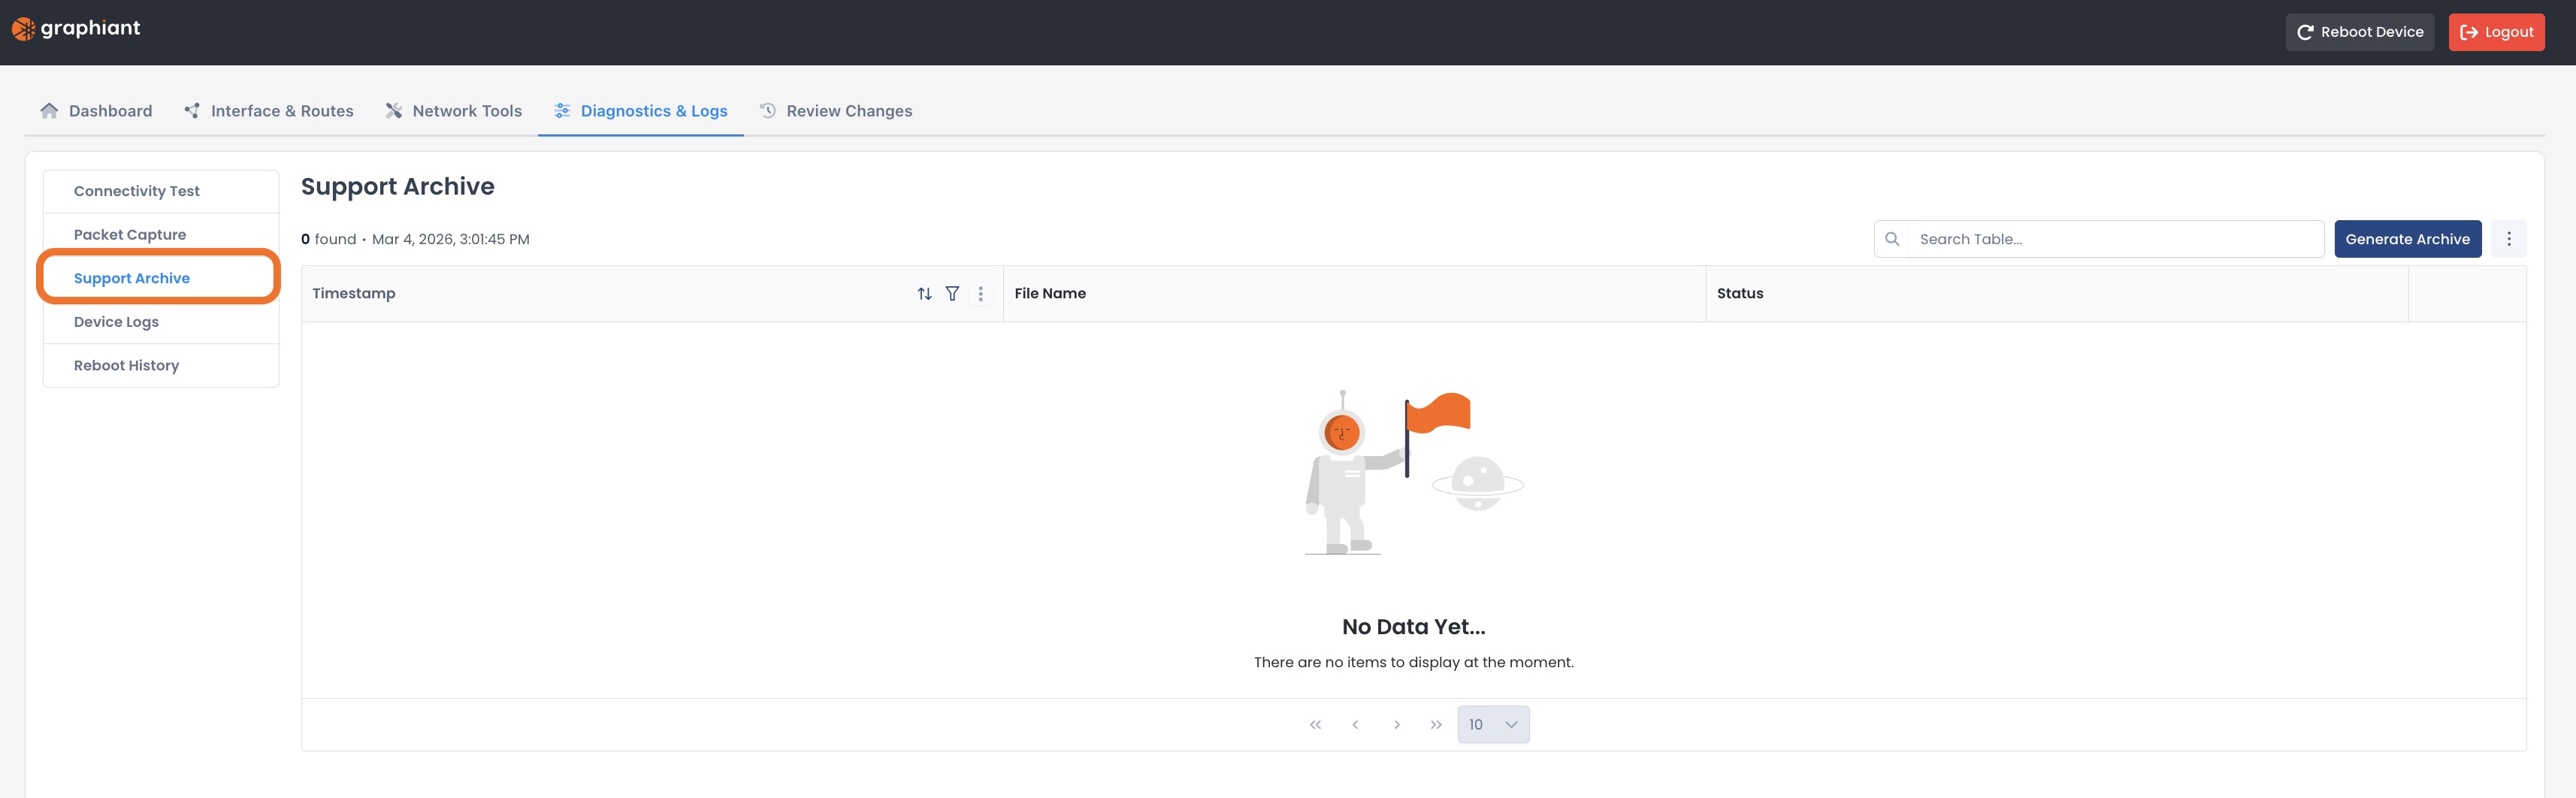
Click ‘Generate Archive’.
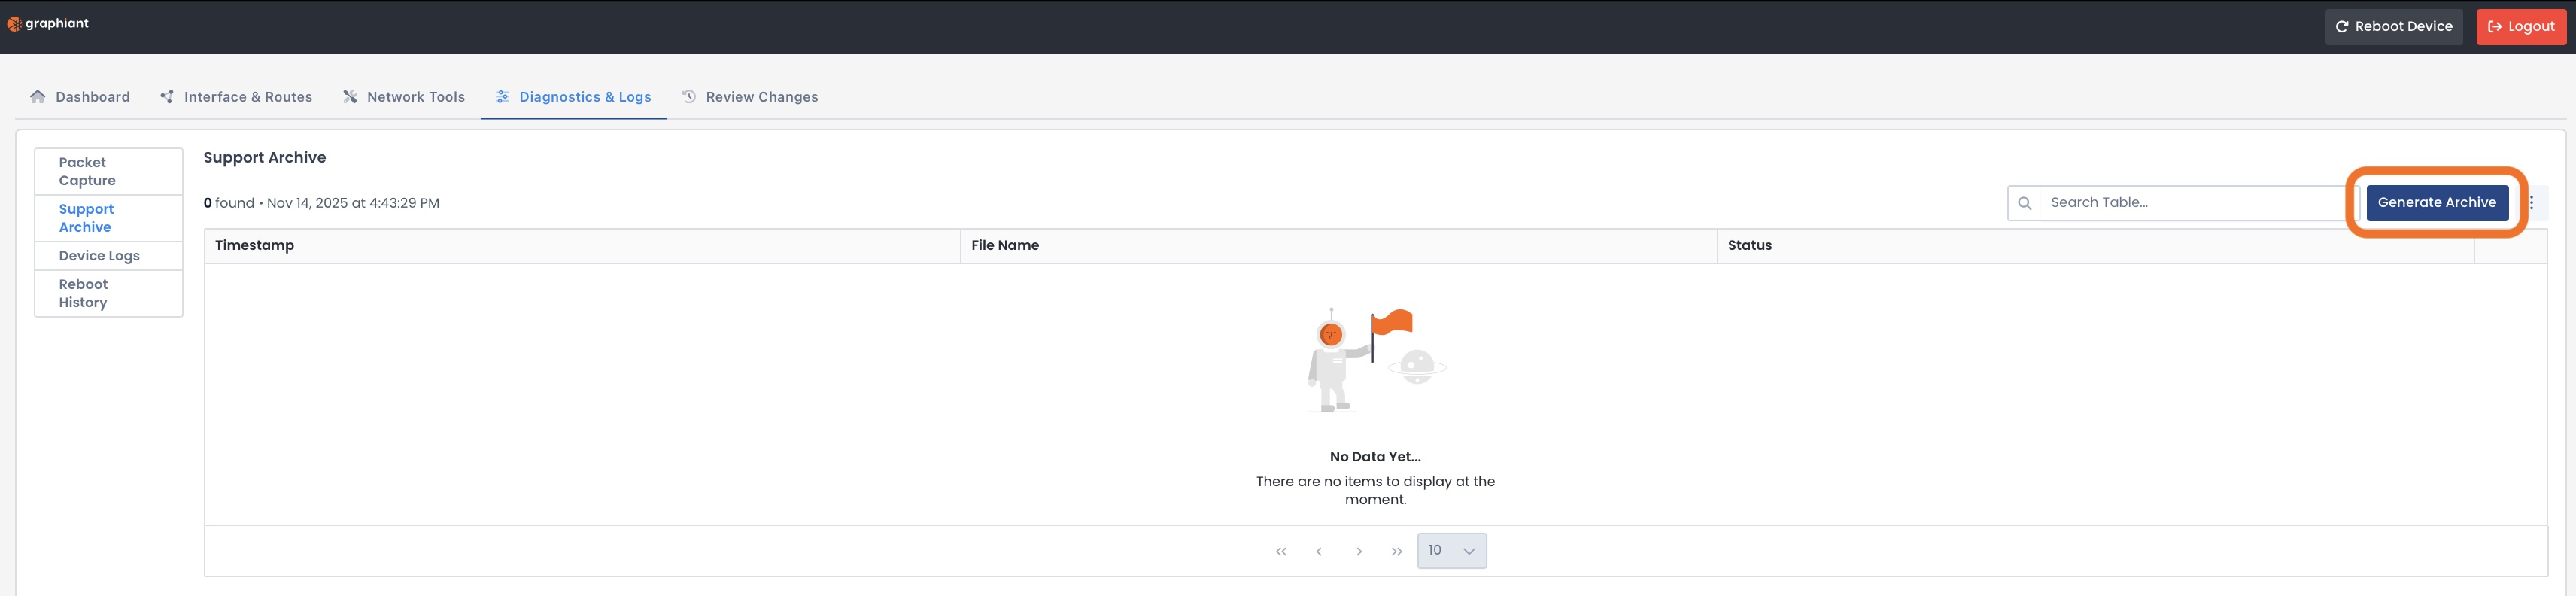
When finished, the status will show “Completed”, and give you the file name and timestamp.
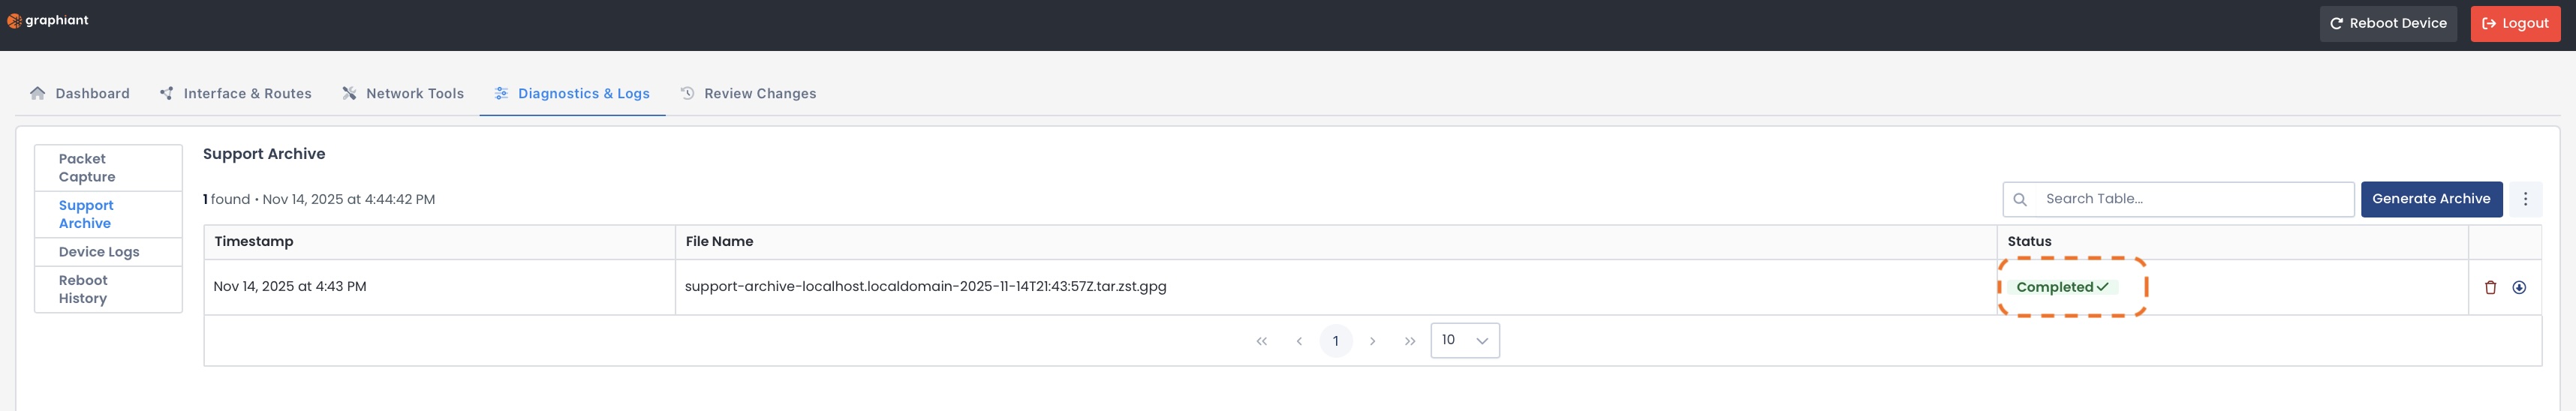
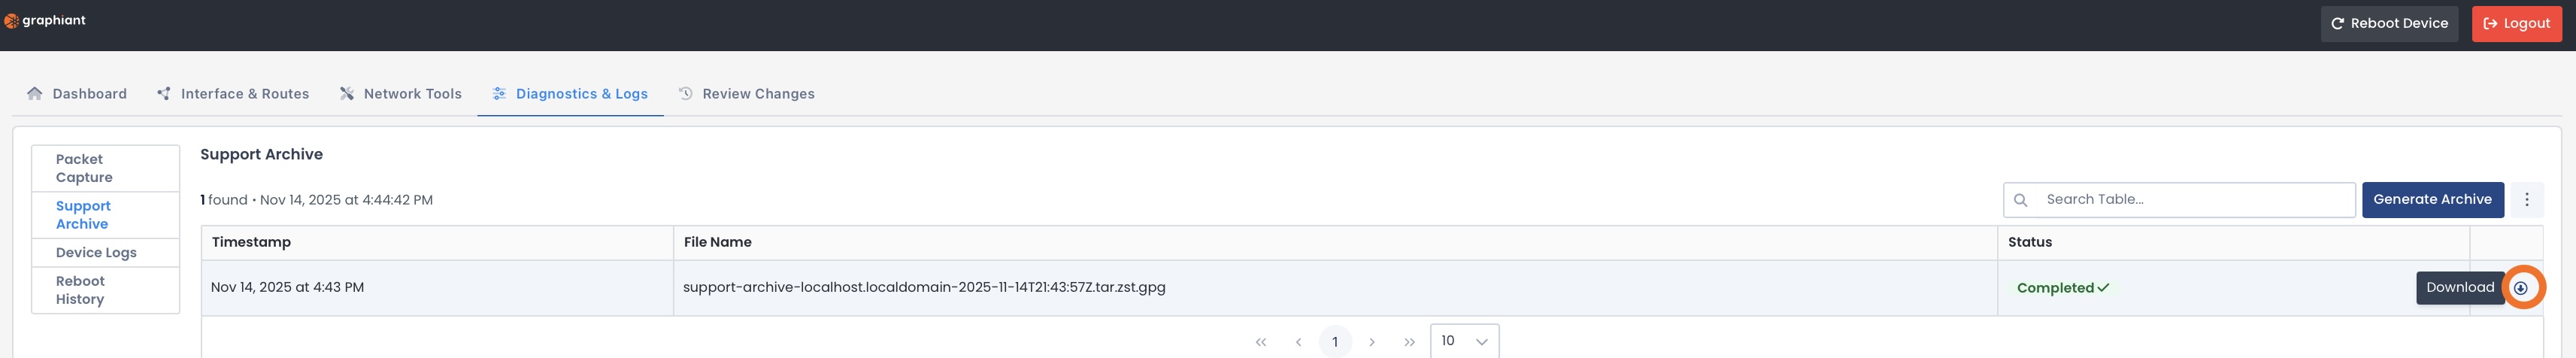
Click ‘Download’ to have your Support Archive on file.
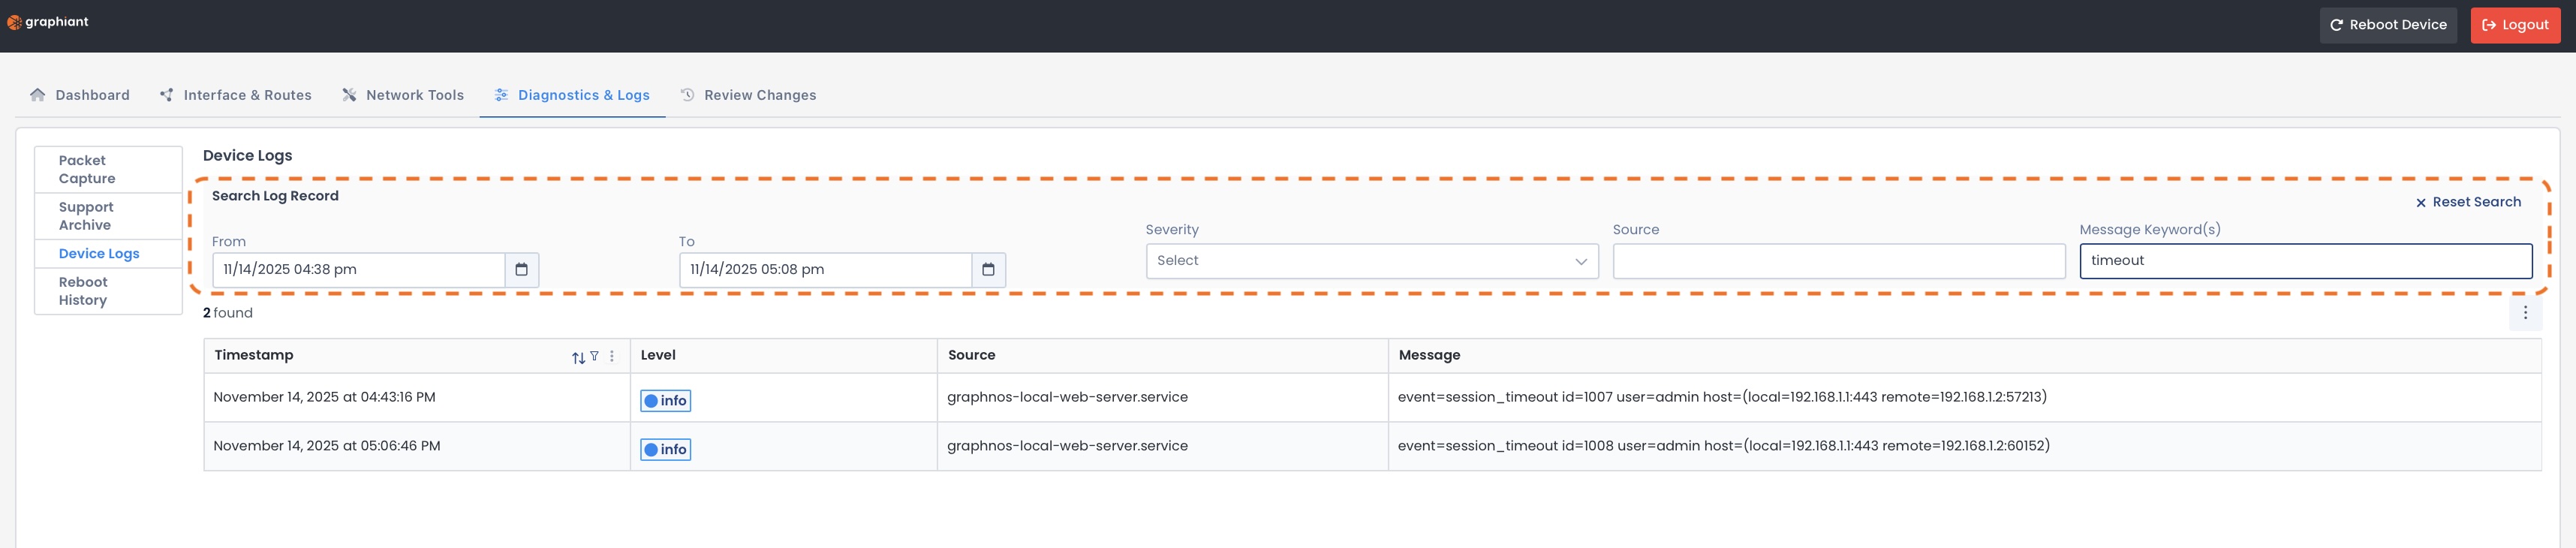
Device Logs
Device Logs show configuration and connection changes over time in the recorded activity for the device.
Information provided includes:
Timestamp
Severity level of event
Source (Originating System)
Message
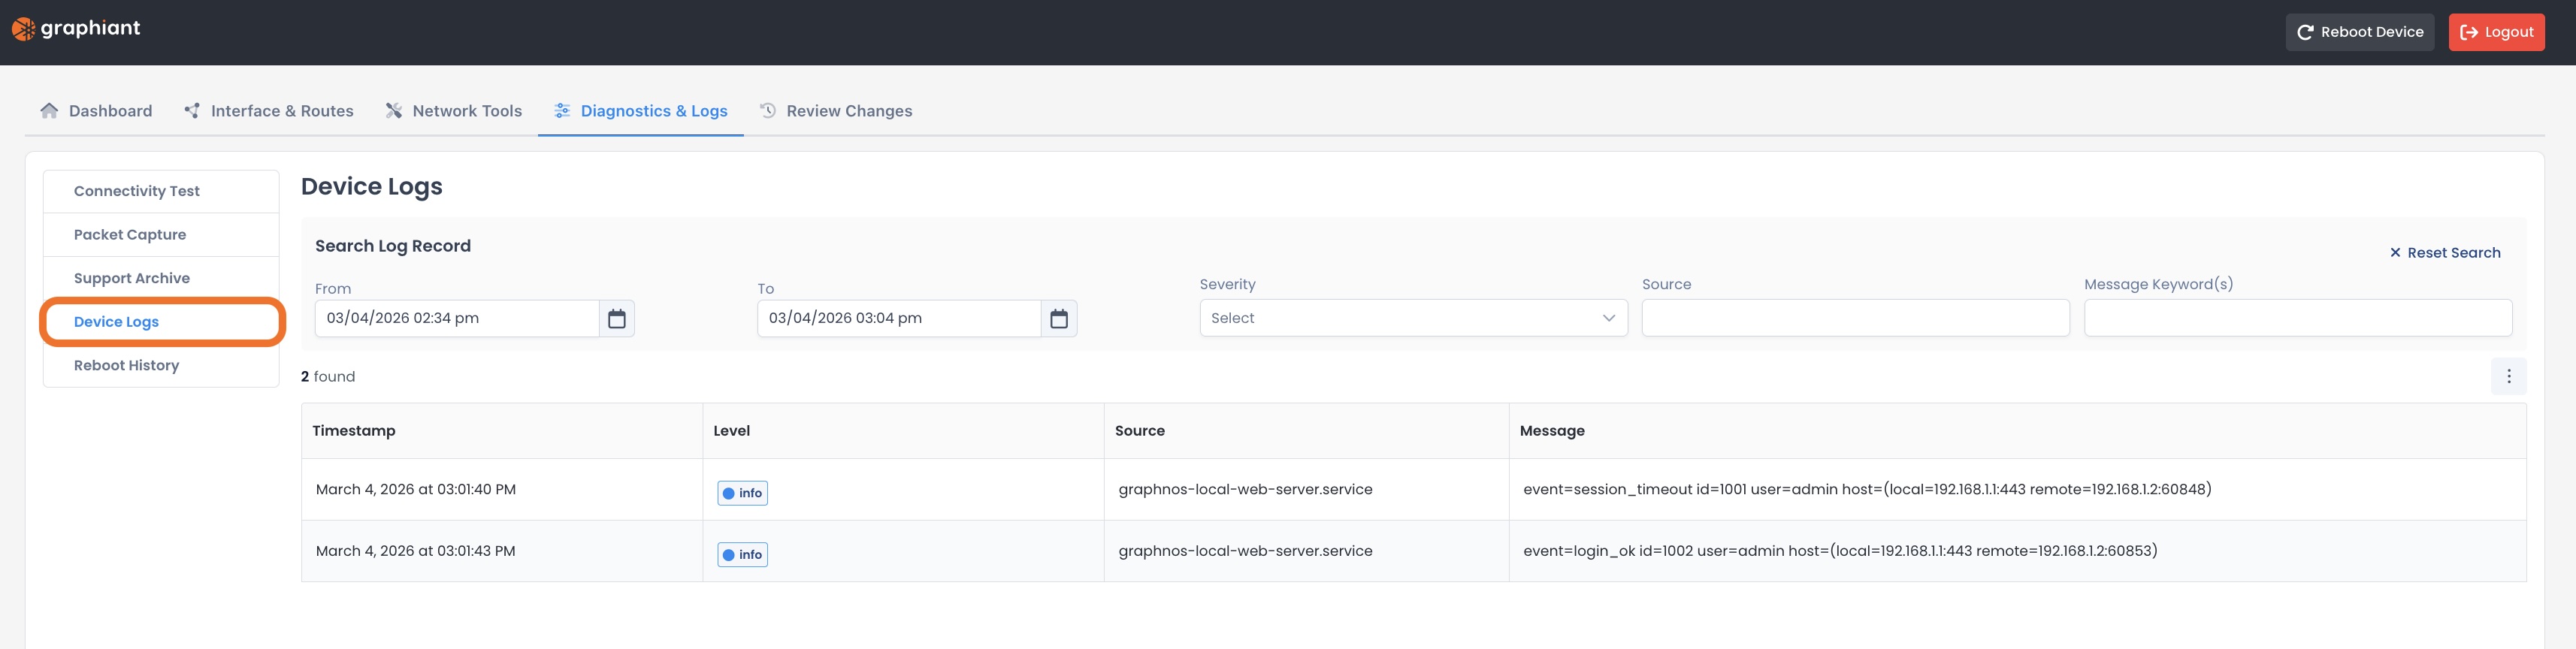
You can search your Log Record using filters based on:
Date / Date Range
Severity of Event
Source (Originating system)
Message
The filter will take effect immediately.
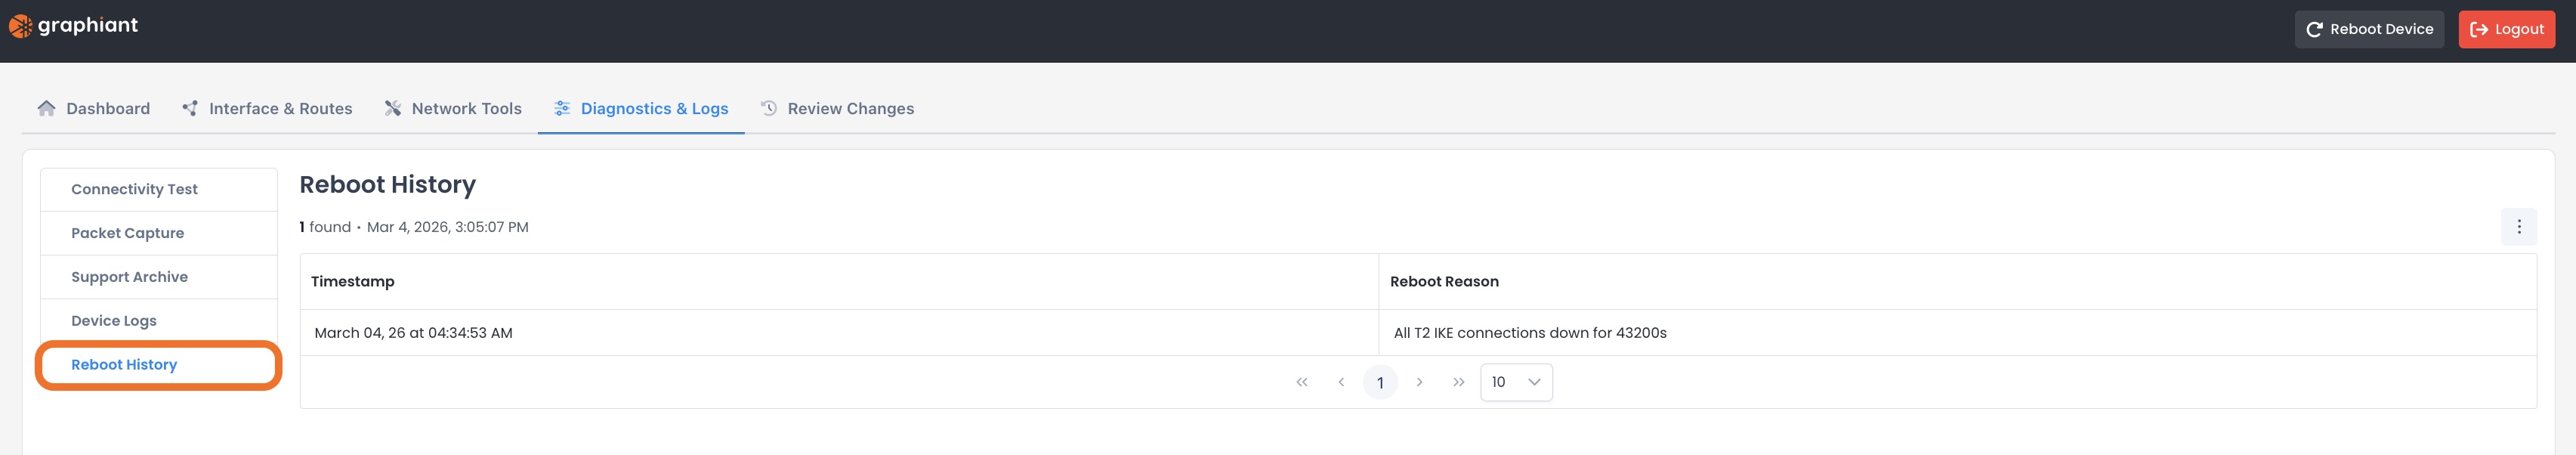
Reboot History
Reboot History shows timestamps and reasons (when available) of past device reboots.
Reboot History only logs manual Reboots upon clicking ‘Reboot’ in the header;
Power-down / power-up, etc are not included here.