What is Traceroute?
Traceroute is a command-line network tool used to determine the route in which packets take from one IP address to another. It provides the hostname, IP address, and the response time to a Ping.
Traceroute can be crucial in identifying problems such as bottlenecks; i.e. why and where the connection to a given server might be lagging, as well as identifying false reports.
.png)
Traceroute in the Graphiant Portal
From within the Graphiant Portal, you will be able to deploy and monitor a Traceroute command.
Step 1: Locating Traceroute in the Graphiant Portal
Reaching the Monitoring Page
The Traceroute function is run via the Monitoring page.
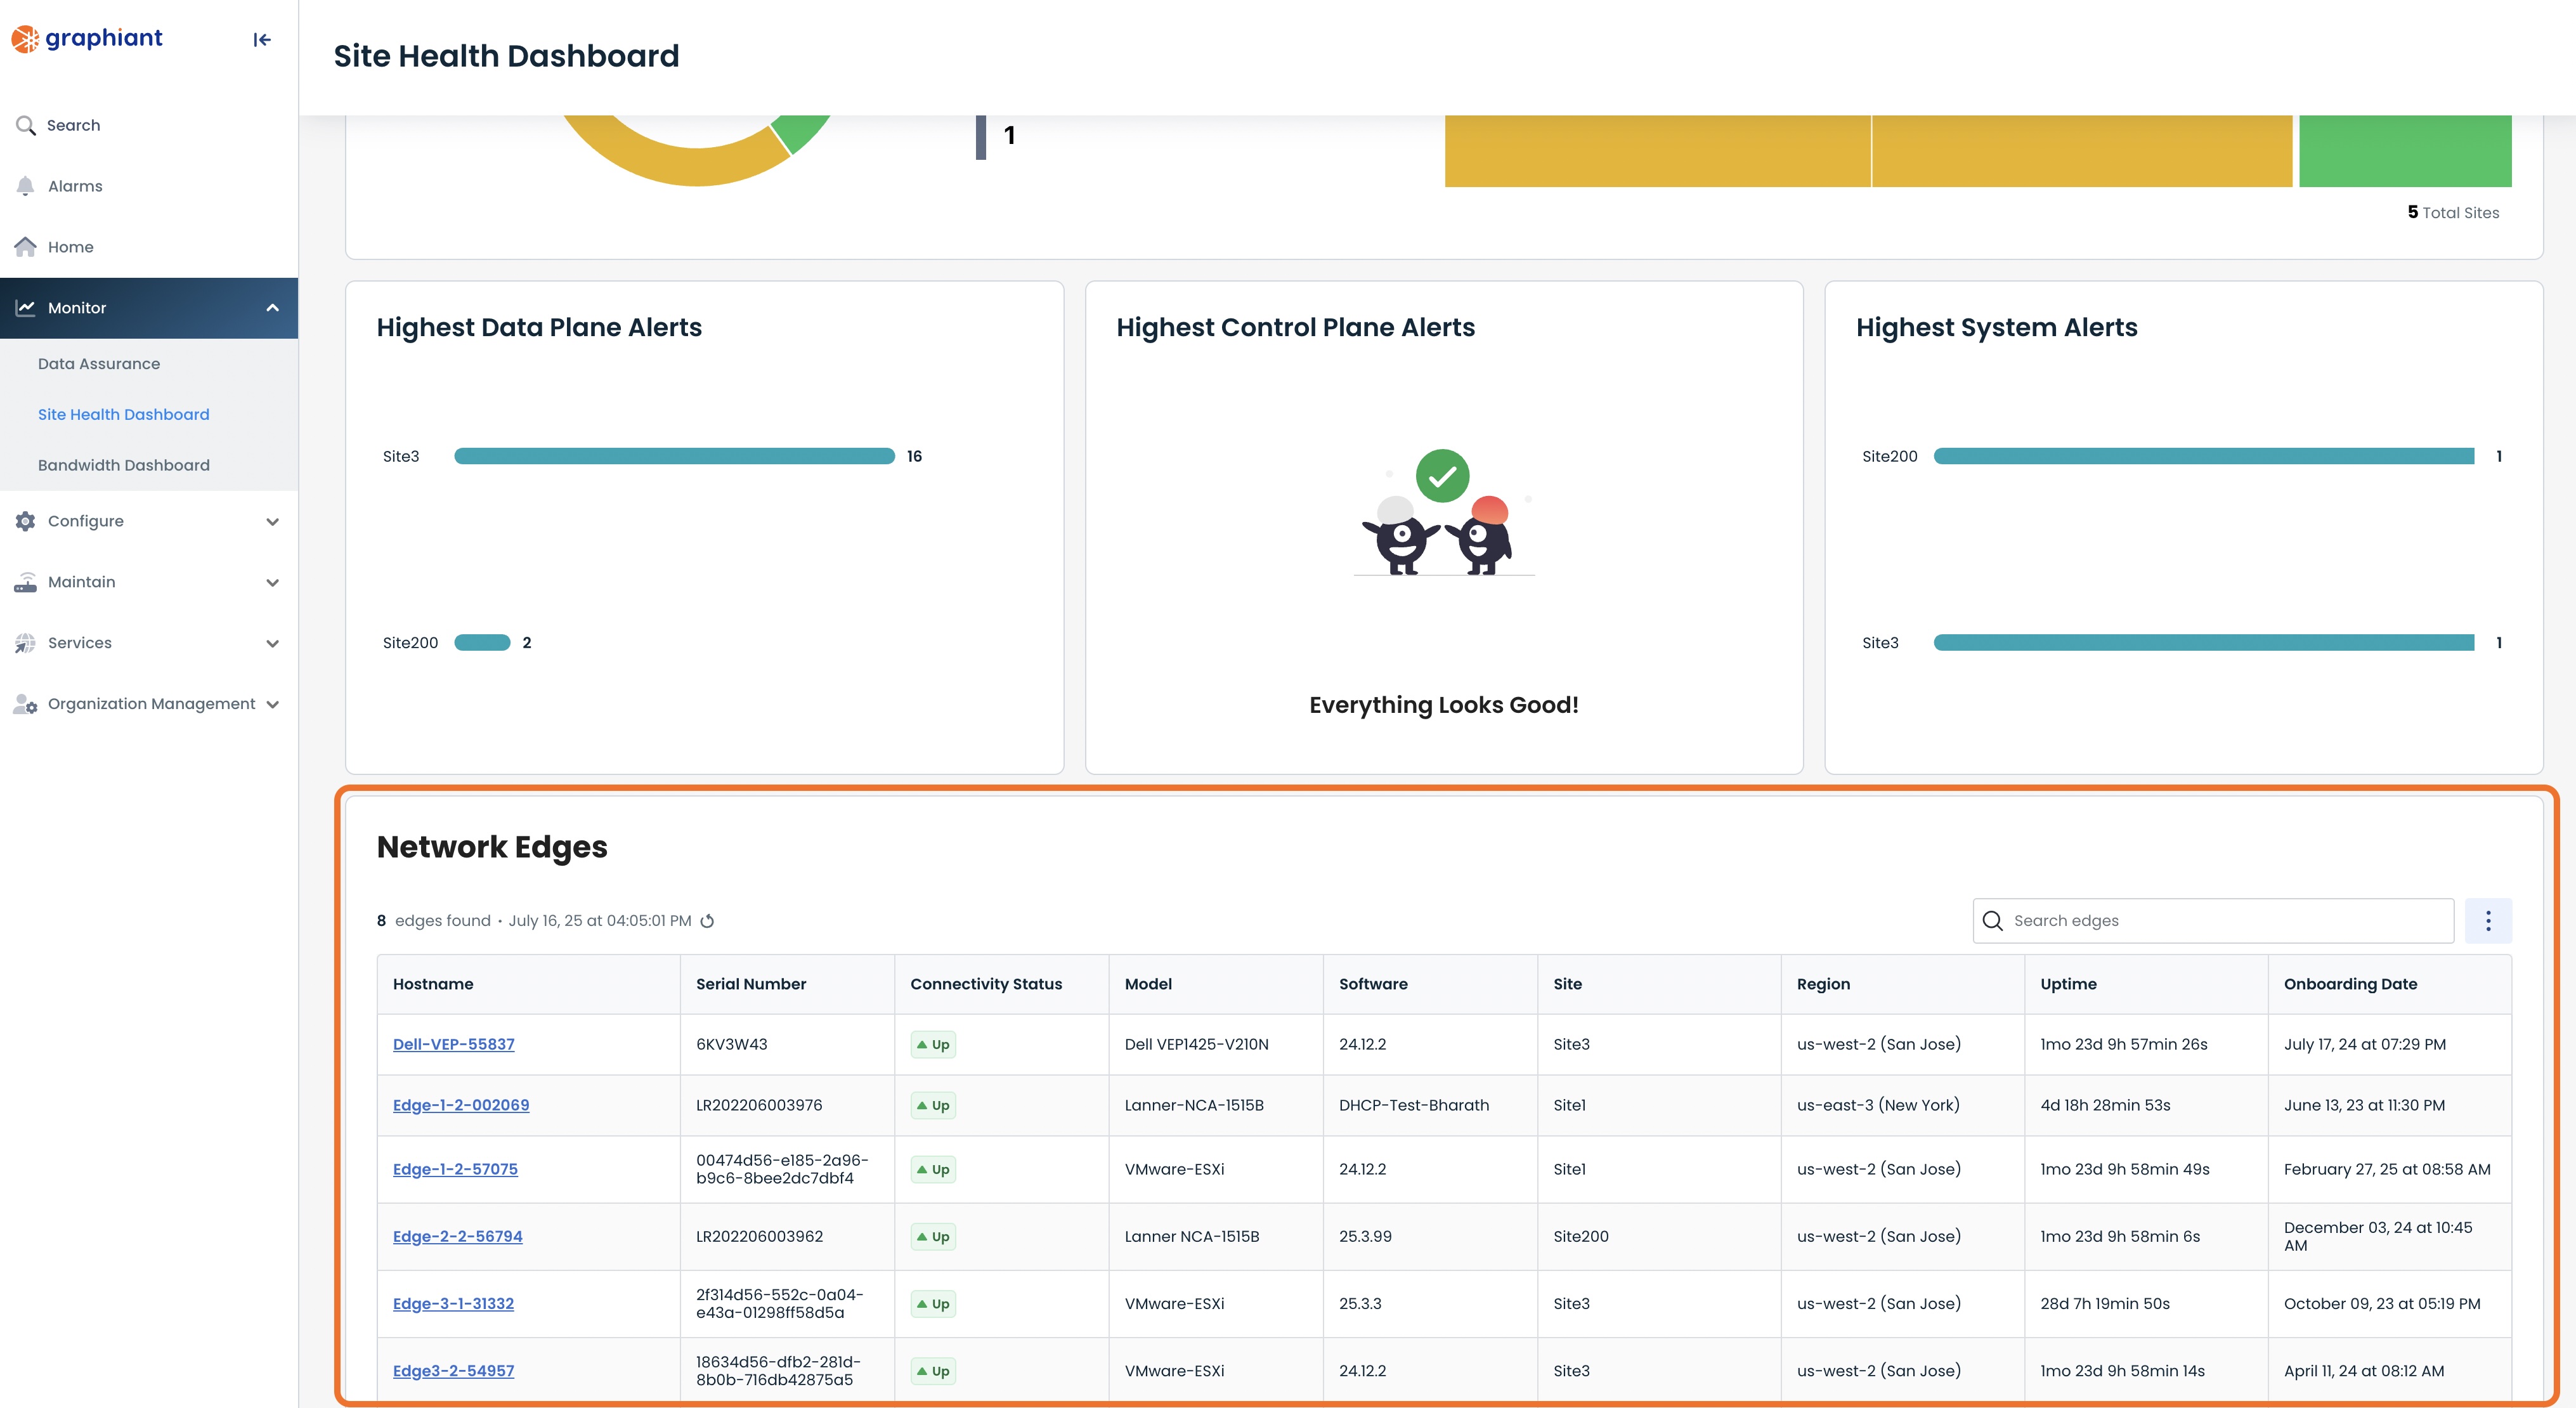
From the Graphiant Portal Home screen click 'Monitor' in the left sidebar; select ‘Site Health Dashboard’.
.jpg)
Scroll down to the bottom of the page.
Here you will see the list of your network edges.
Selecting Device(s) for Traceroute
Select the desired edge by clicking on its Hostname.
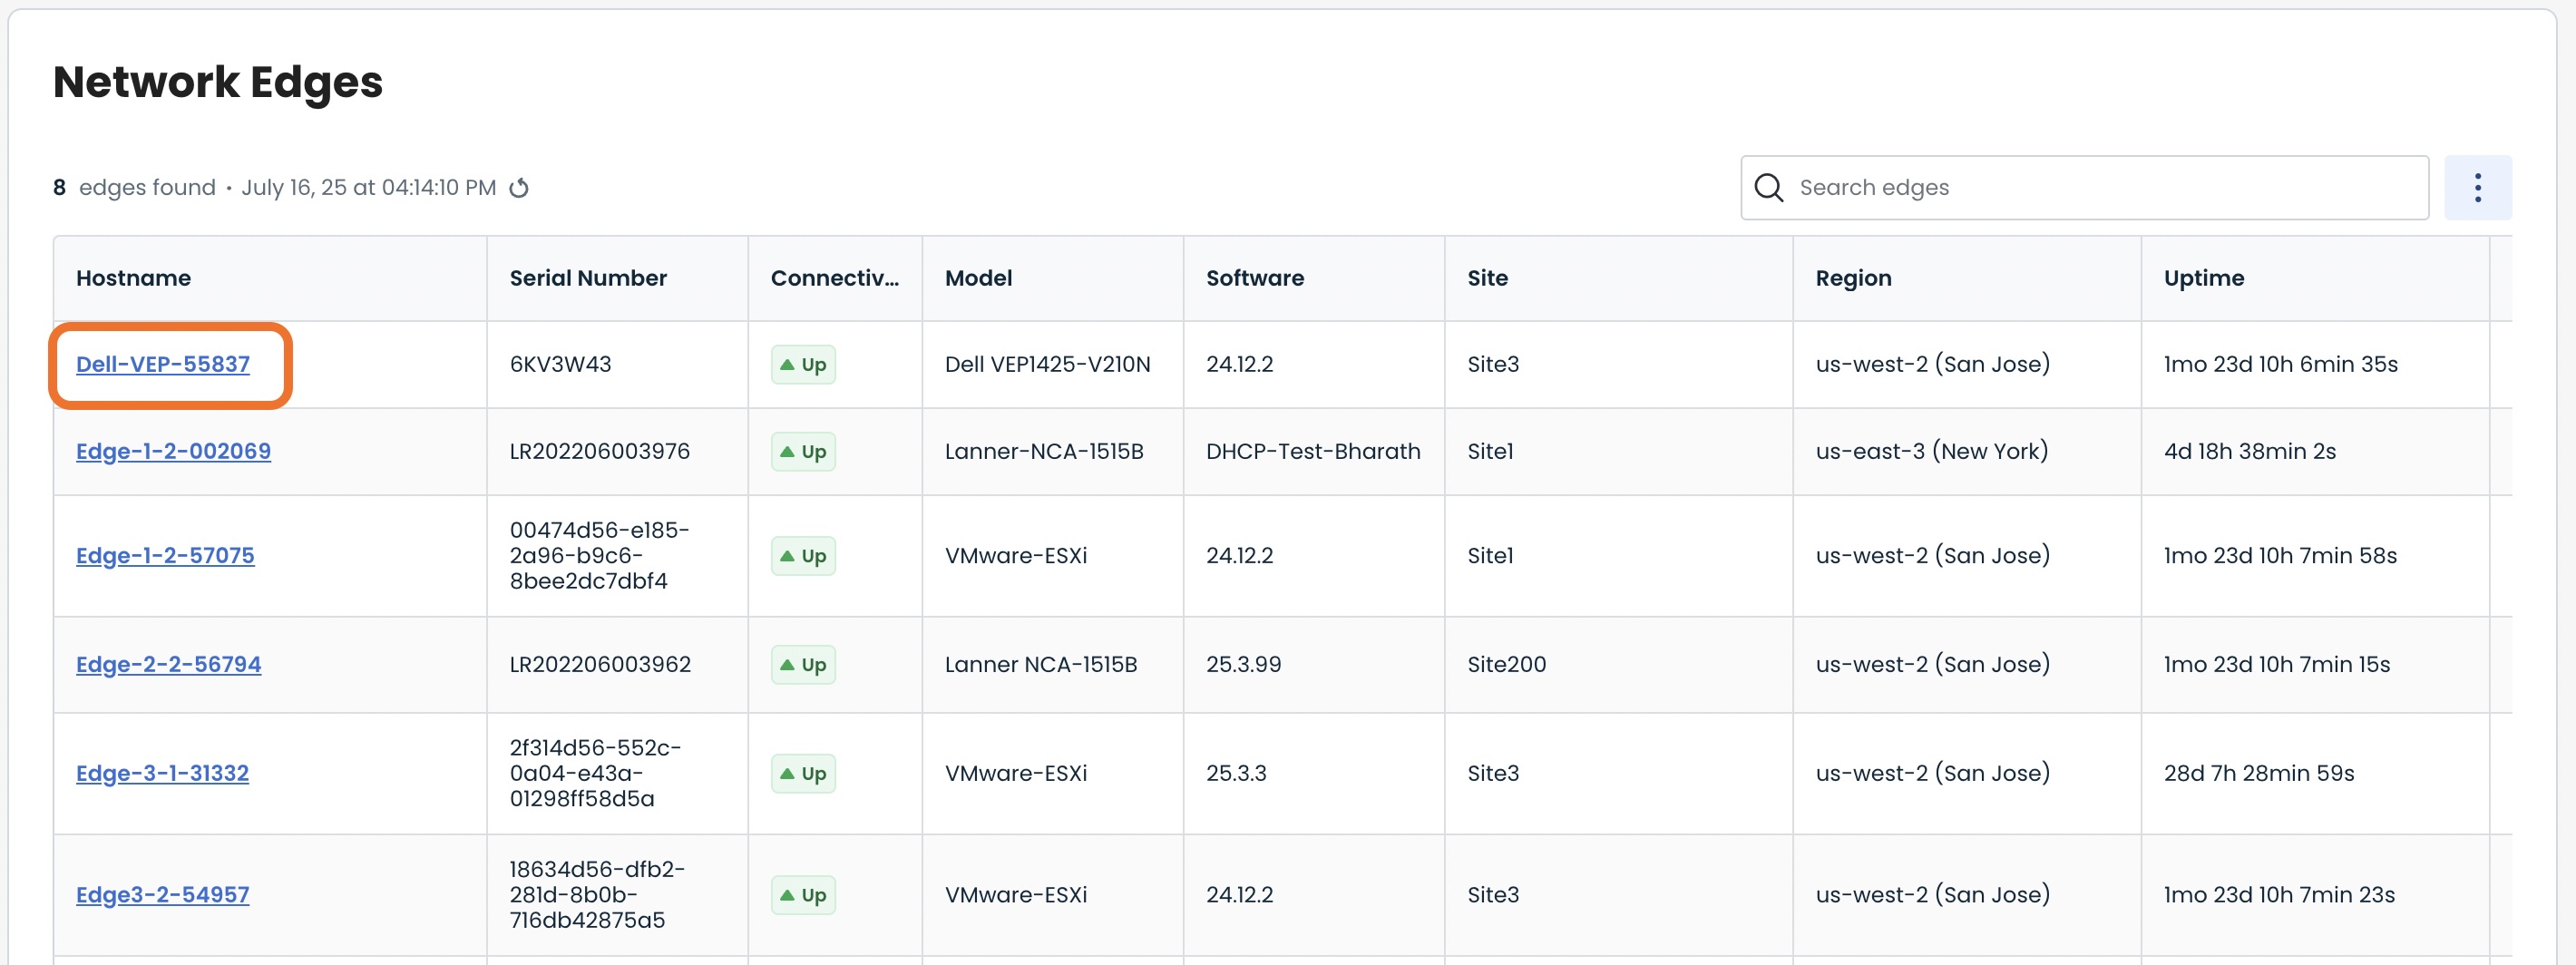
This will take you onto a Monitoring page with a focus on the Edge you have just chosen.
.jpg)
Step 2: Running Traceroute in the Graphiant Portal
After arriving on the ‘Monitoring’ page in tandem with the Edge you wish to manage, select the ‘Troubleshoot’ tab.
.jpg)
Here you will be able to run a Traceroute command from a desired LAN segment and interface.
Below are descriptors for each of the fields required in order to run a Traceroute command from the selected edge.
(Note: An * indicates a required field.)
Utilities
LAN Segment*: Choose a desired LAN segment from the dropdown menu
Interface*: Choose a desired interface from the dropdown menu
Source*: Choose a desired source IP from the dropdown menu
Destination Host/IP*: Enter the desired destination’s IP address
Protocol*: Select either ICMP or TCP; When selecting TCP, you will be required to enter the destination port
Additional Options
Count: Choose a desired packet count from the dropdown menu
Payload Size: Choose a desired payload size from the dropdown menu
Type of Service: Choose a desired service level from the dropdown menu
Once the above fields are filled in, select ‘Run Traceroute’.
.png)
Under ‘Test Results’ you will see whether or not the Traceroute was performed successfully; also displayed are the amount of time to reach destination, the maximum latency time, and the maximum latency. In addition, should the Traceroute perform successfully, you will be able to view details on each of the stops between you and the destination router.