What is Ping?
Ping is one of the most widely used command-line utilities and is largely deployed when testing network connectivity, as well as testing potential issues related to Domain Name System (DNS) and Network Interface Card (NIC).
Ping is often used to identify packet loss, which can be due to network congestion or faulty hardware. Unlike Traceroute, the Ping command only provides connectivity confirmation. Ping does not provide details on how the connection is or isn’t made with the destination server, or the path in which the packet took.
.png)
Ping in the Graphiant Portal
From within the Graphiant Portal, you will be able to deploy and monitor a Ping command.
Step 1: Locating Ping in the Graphiant Portal
Reaching the Monitoring Page
The ping function is run via the Monitoring page for your device.
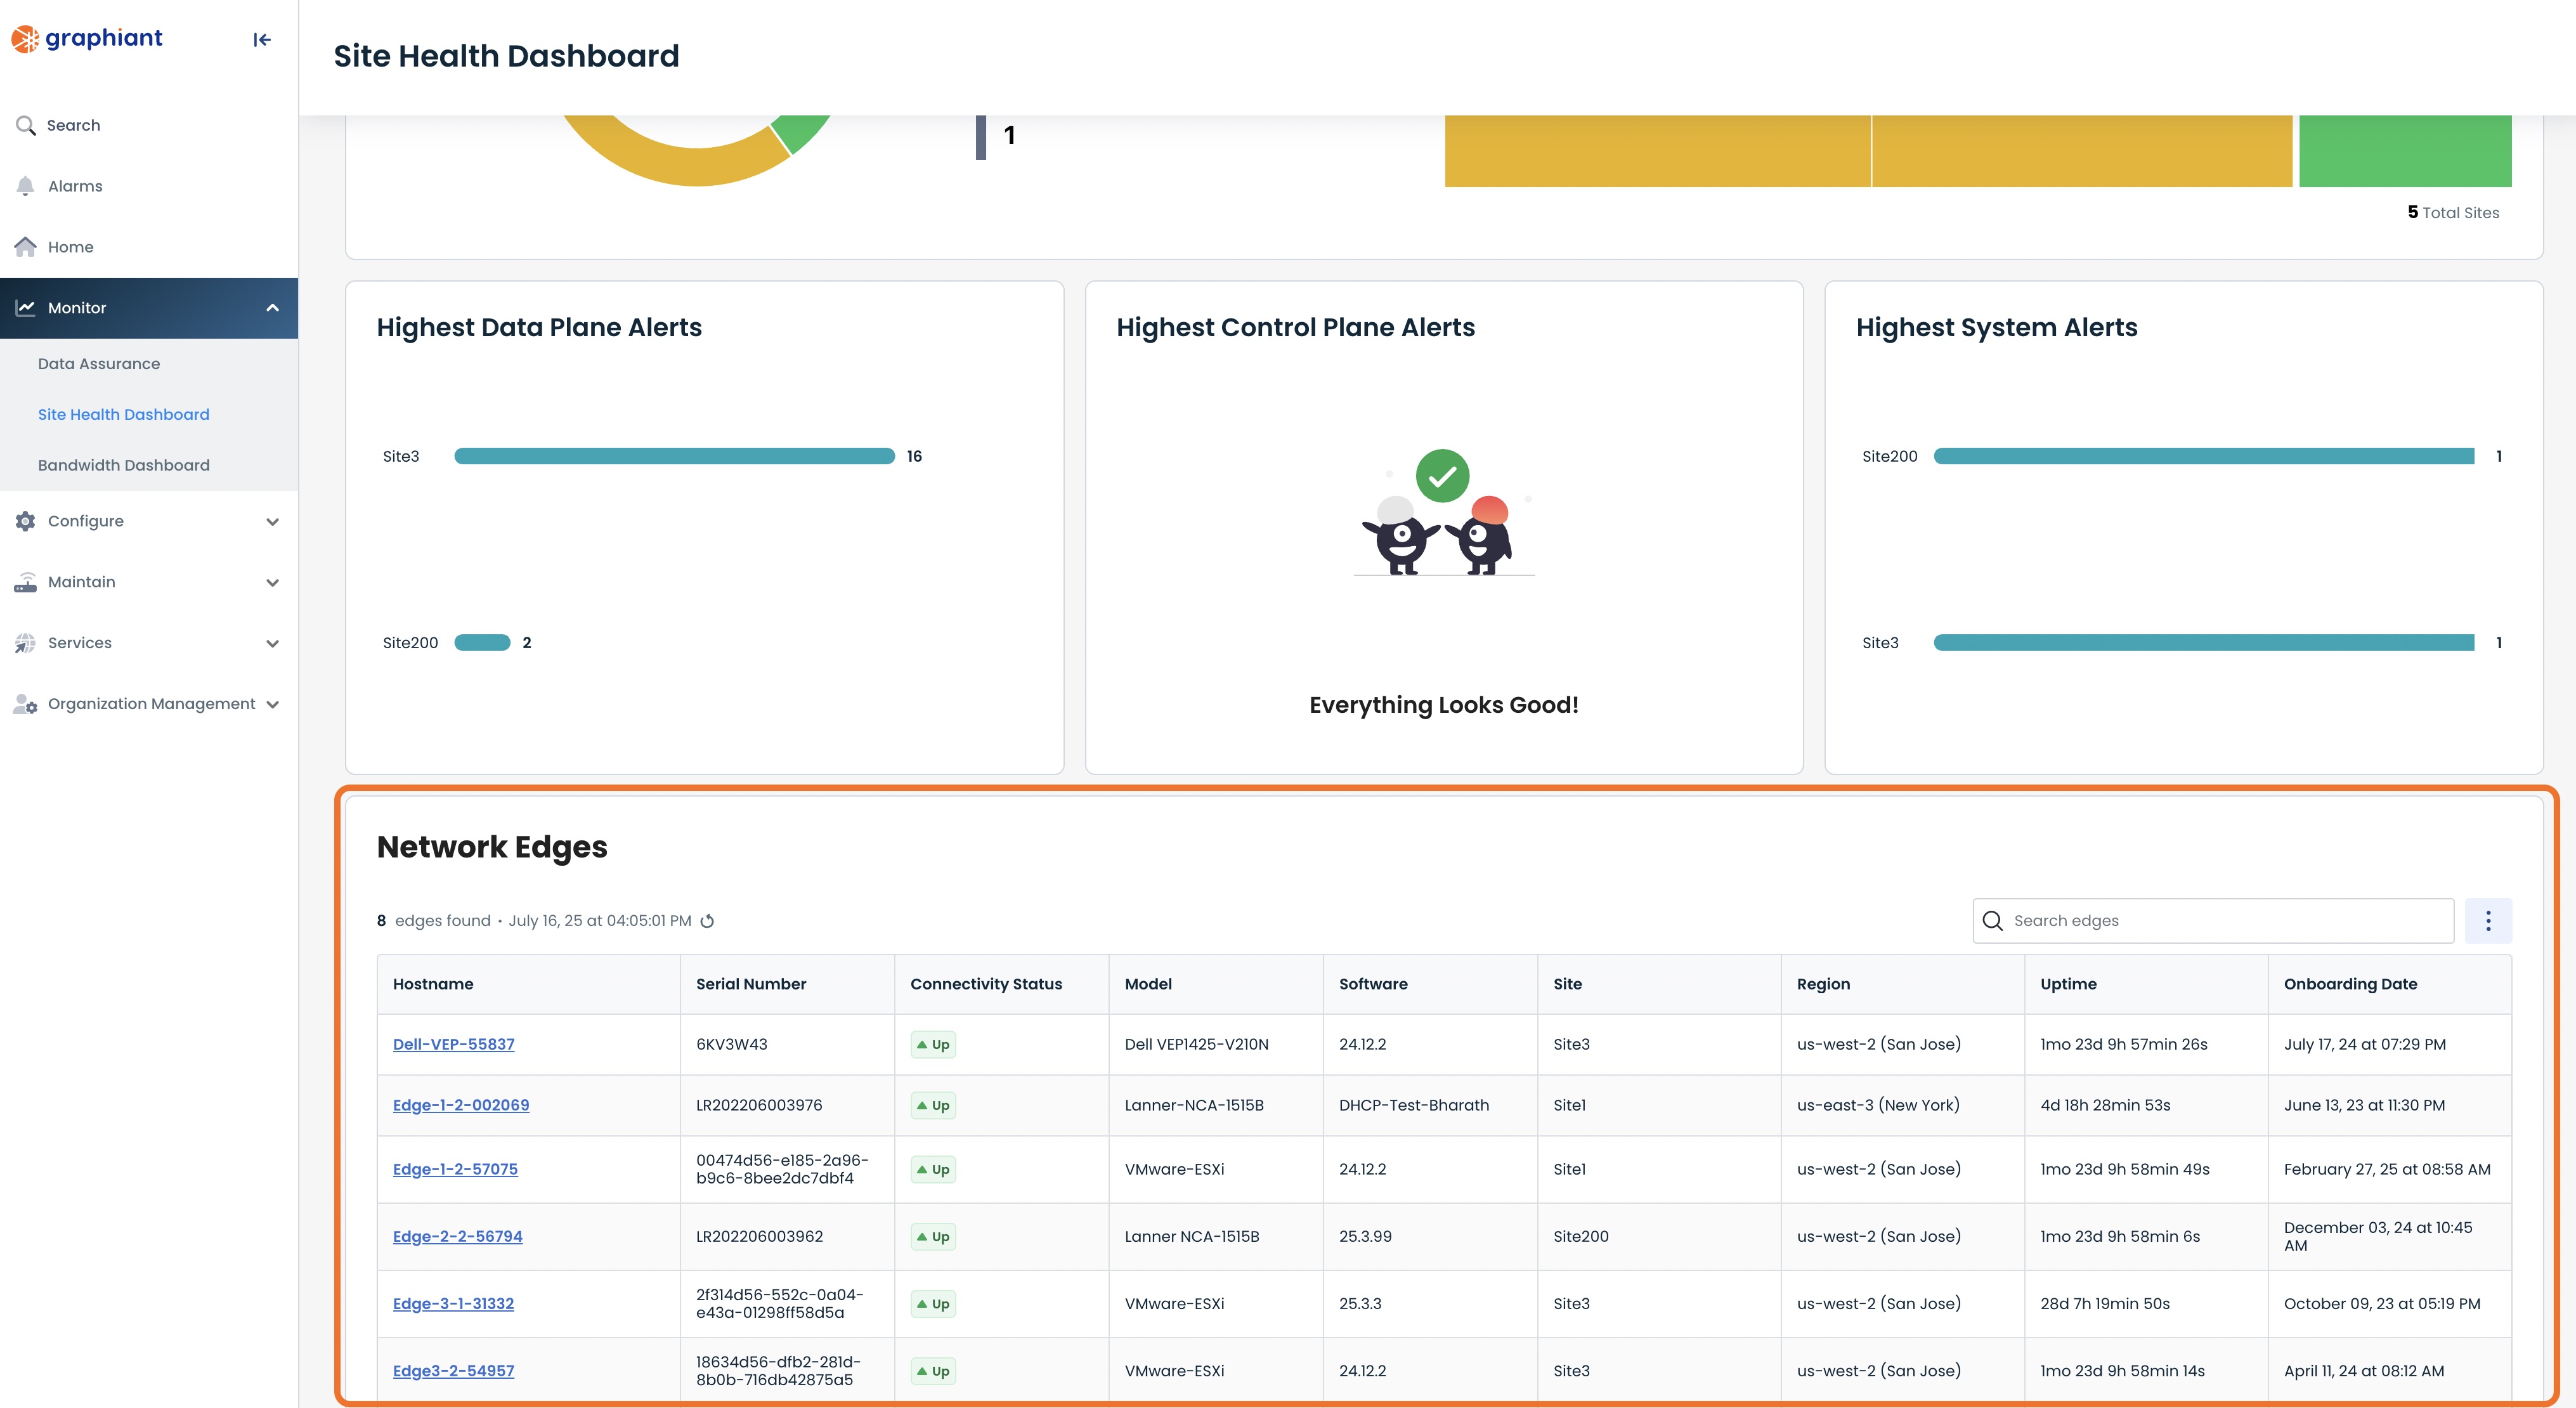
From the Graphiant Portal Home screen click 'Monitor' in the left sidebar; select ‘Site Health Dashboard’.
.jpg)
Scroll down to the bottom of the page.
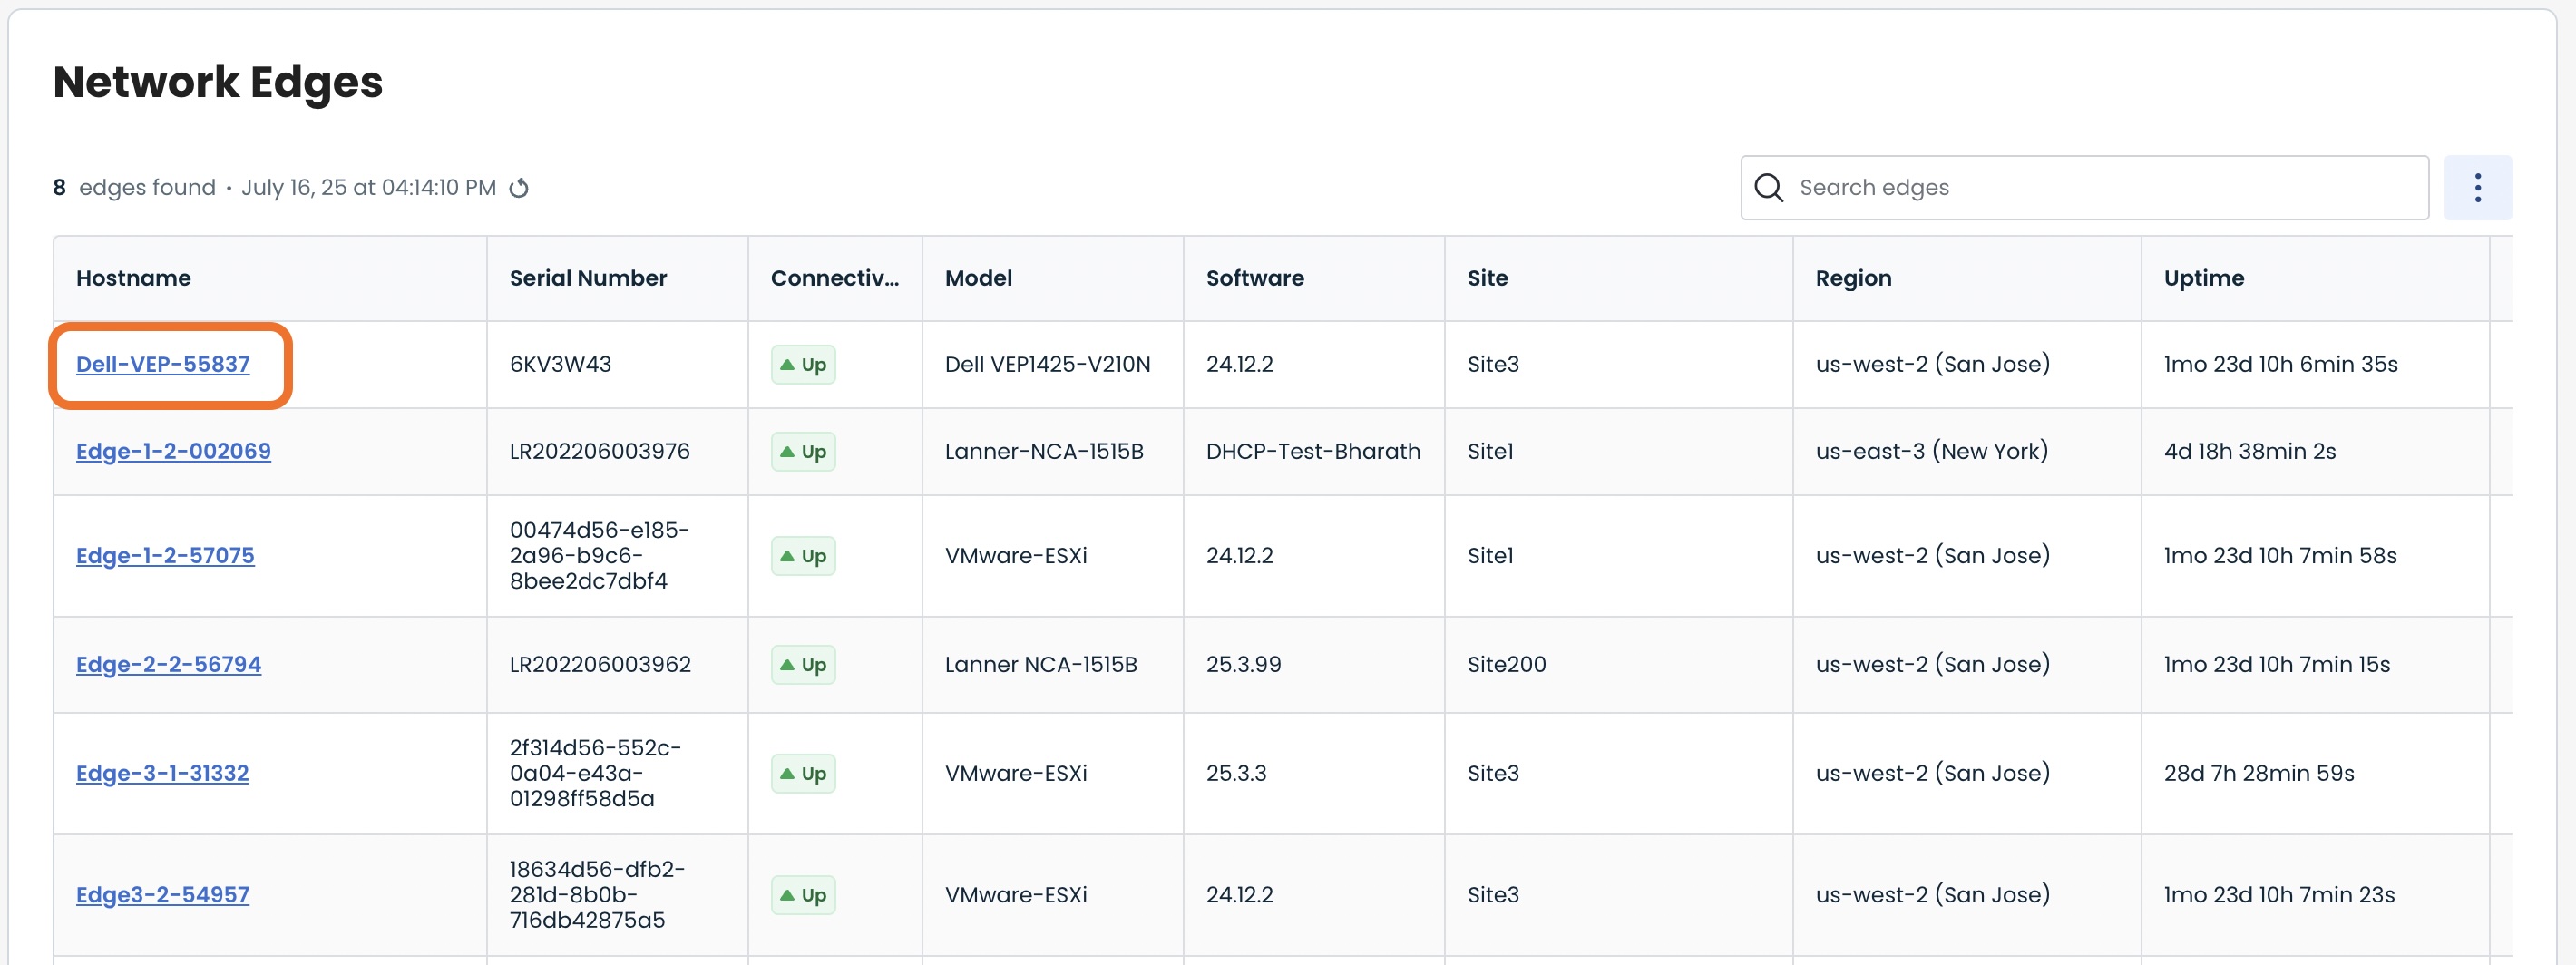
Here you will see the list of your network edges.
Selecting the Device(s) to Ping
Select the desired edge by clicking on its Hostname.
This will take you onto a Monitoring page with a focus on the Edge you have just chosen.
.jpg)
Step 2: Running Ping in the Graphiant Portal
After arriving on the ‘Monitoring’ page in tandem with the Edge you wish to manage, select and click ‘Troubleshoot’.
.jpg)
Here you will be able to run a Ping command from a desired LAN segment and interface.
.png)
Below are descriptors for each of the fields required in order to run a Ping command from the selected Edge.
Note: An * indicates a required field
Utilities
LAN Segment*: Choose a desired LAN segment from the dropdown menu
Interface*: Choose a desired interface from the dropdown menu
Source*: Choose a desired source IP from the dropdown menu
Destination Host/IP*: Enter the desired destination’s IP address
Protocol*: Select either ICMP or TCP; When selecting TCP, you will be required to enter the destination port
Additional Options
Count: Choose a desired packet count from the dropdown menu
Payload Size: Choose a desired payload size from the dropdown menu
Type of Service: Choose a desired service level from the dropdown menu
Once the above fields are filled in, select ‘Run Ping’.
.png)
Under ‘Test Results’ you will see the maximum, minimum, and average Ping times displayed.