What is the Site Health Dashboard?
The Site Health Dashboard delivers a singular bird's eye view into the real-time, up to the minute health of all of the sites in your network.
From at-a-glance information of the current health of each site, to the stats of each Edge attached to every site, the Site Health Dashboard provides a meaningful overview of the overall health of your network.
Locating the Site Health Dashboard in the Graphiant Portal
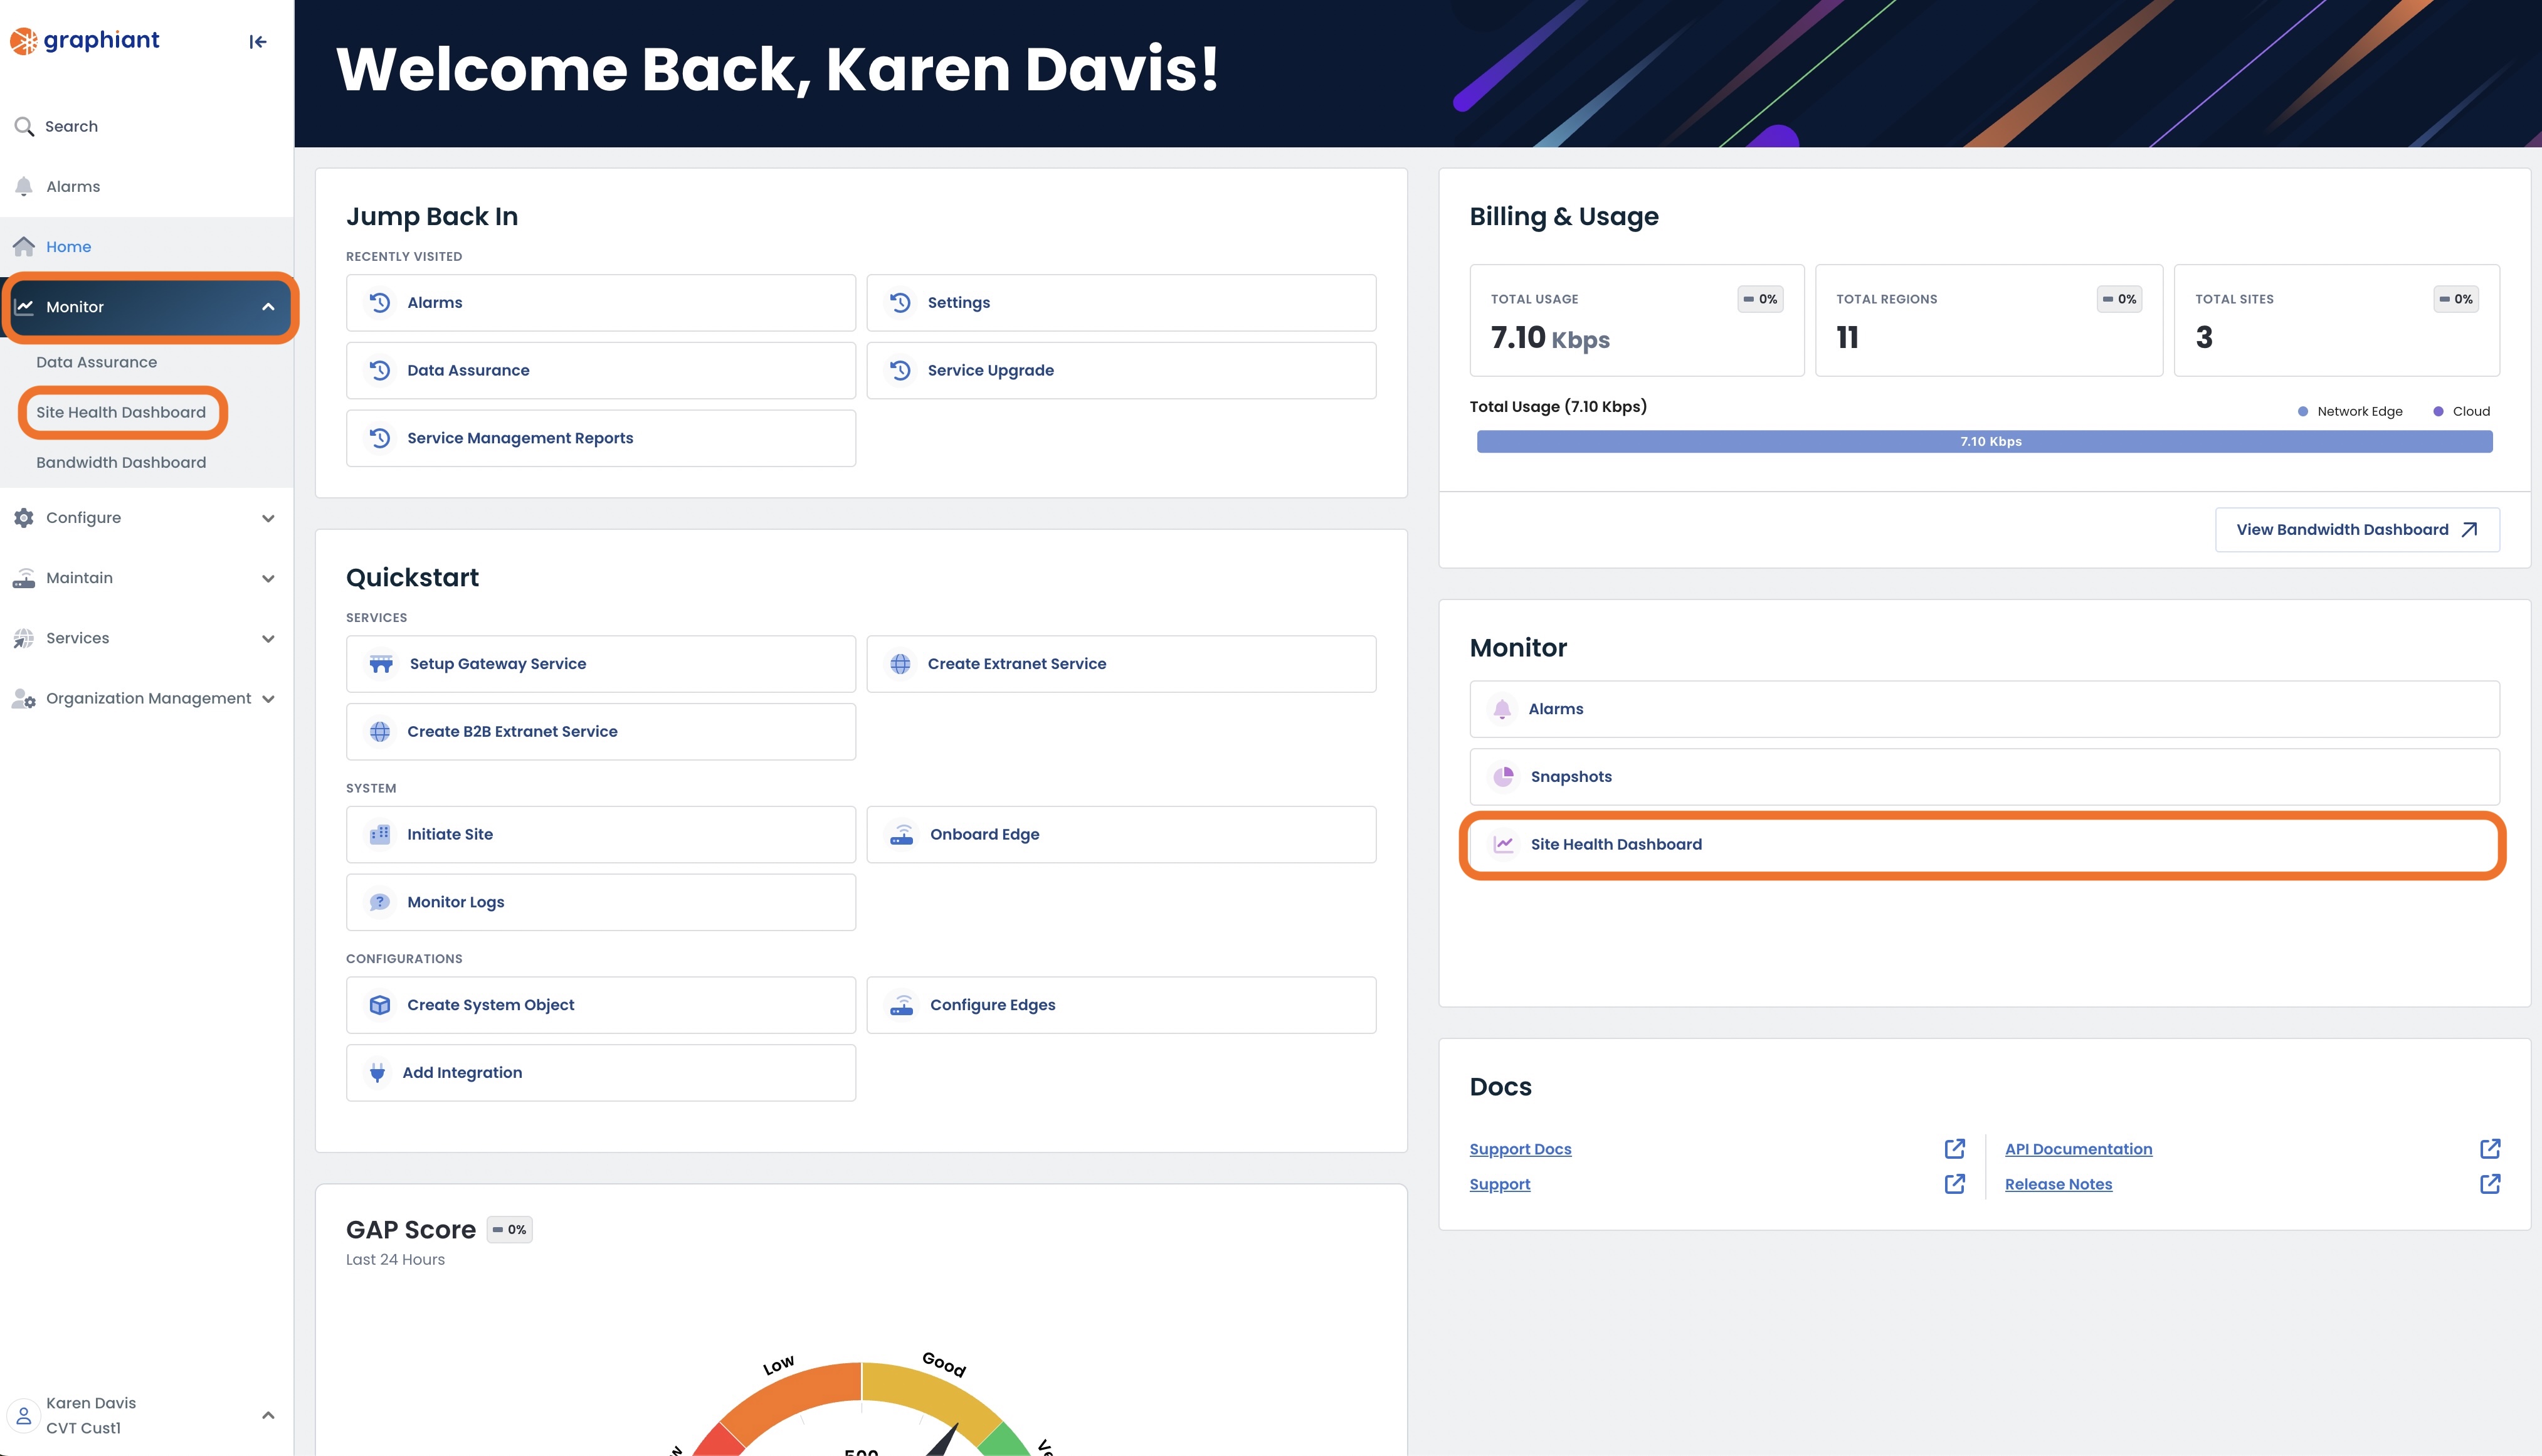
From the Graphiant Portal home screen, the Site Health Dashboard can be reached by either:
Locating the "Monitor" section to the right; select 'Site Health Dashboard'
OR
Clicking 'Monitor' in the sidebar; select 'Site Health Dashboard' from the drop-down.
This opens the Site Health Dashboard.
This page houses all of the information regarding sites for the entire network.
Navigating the Site Health Dashboard
Overview Page
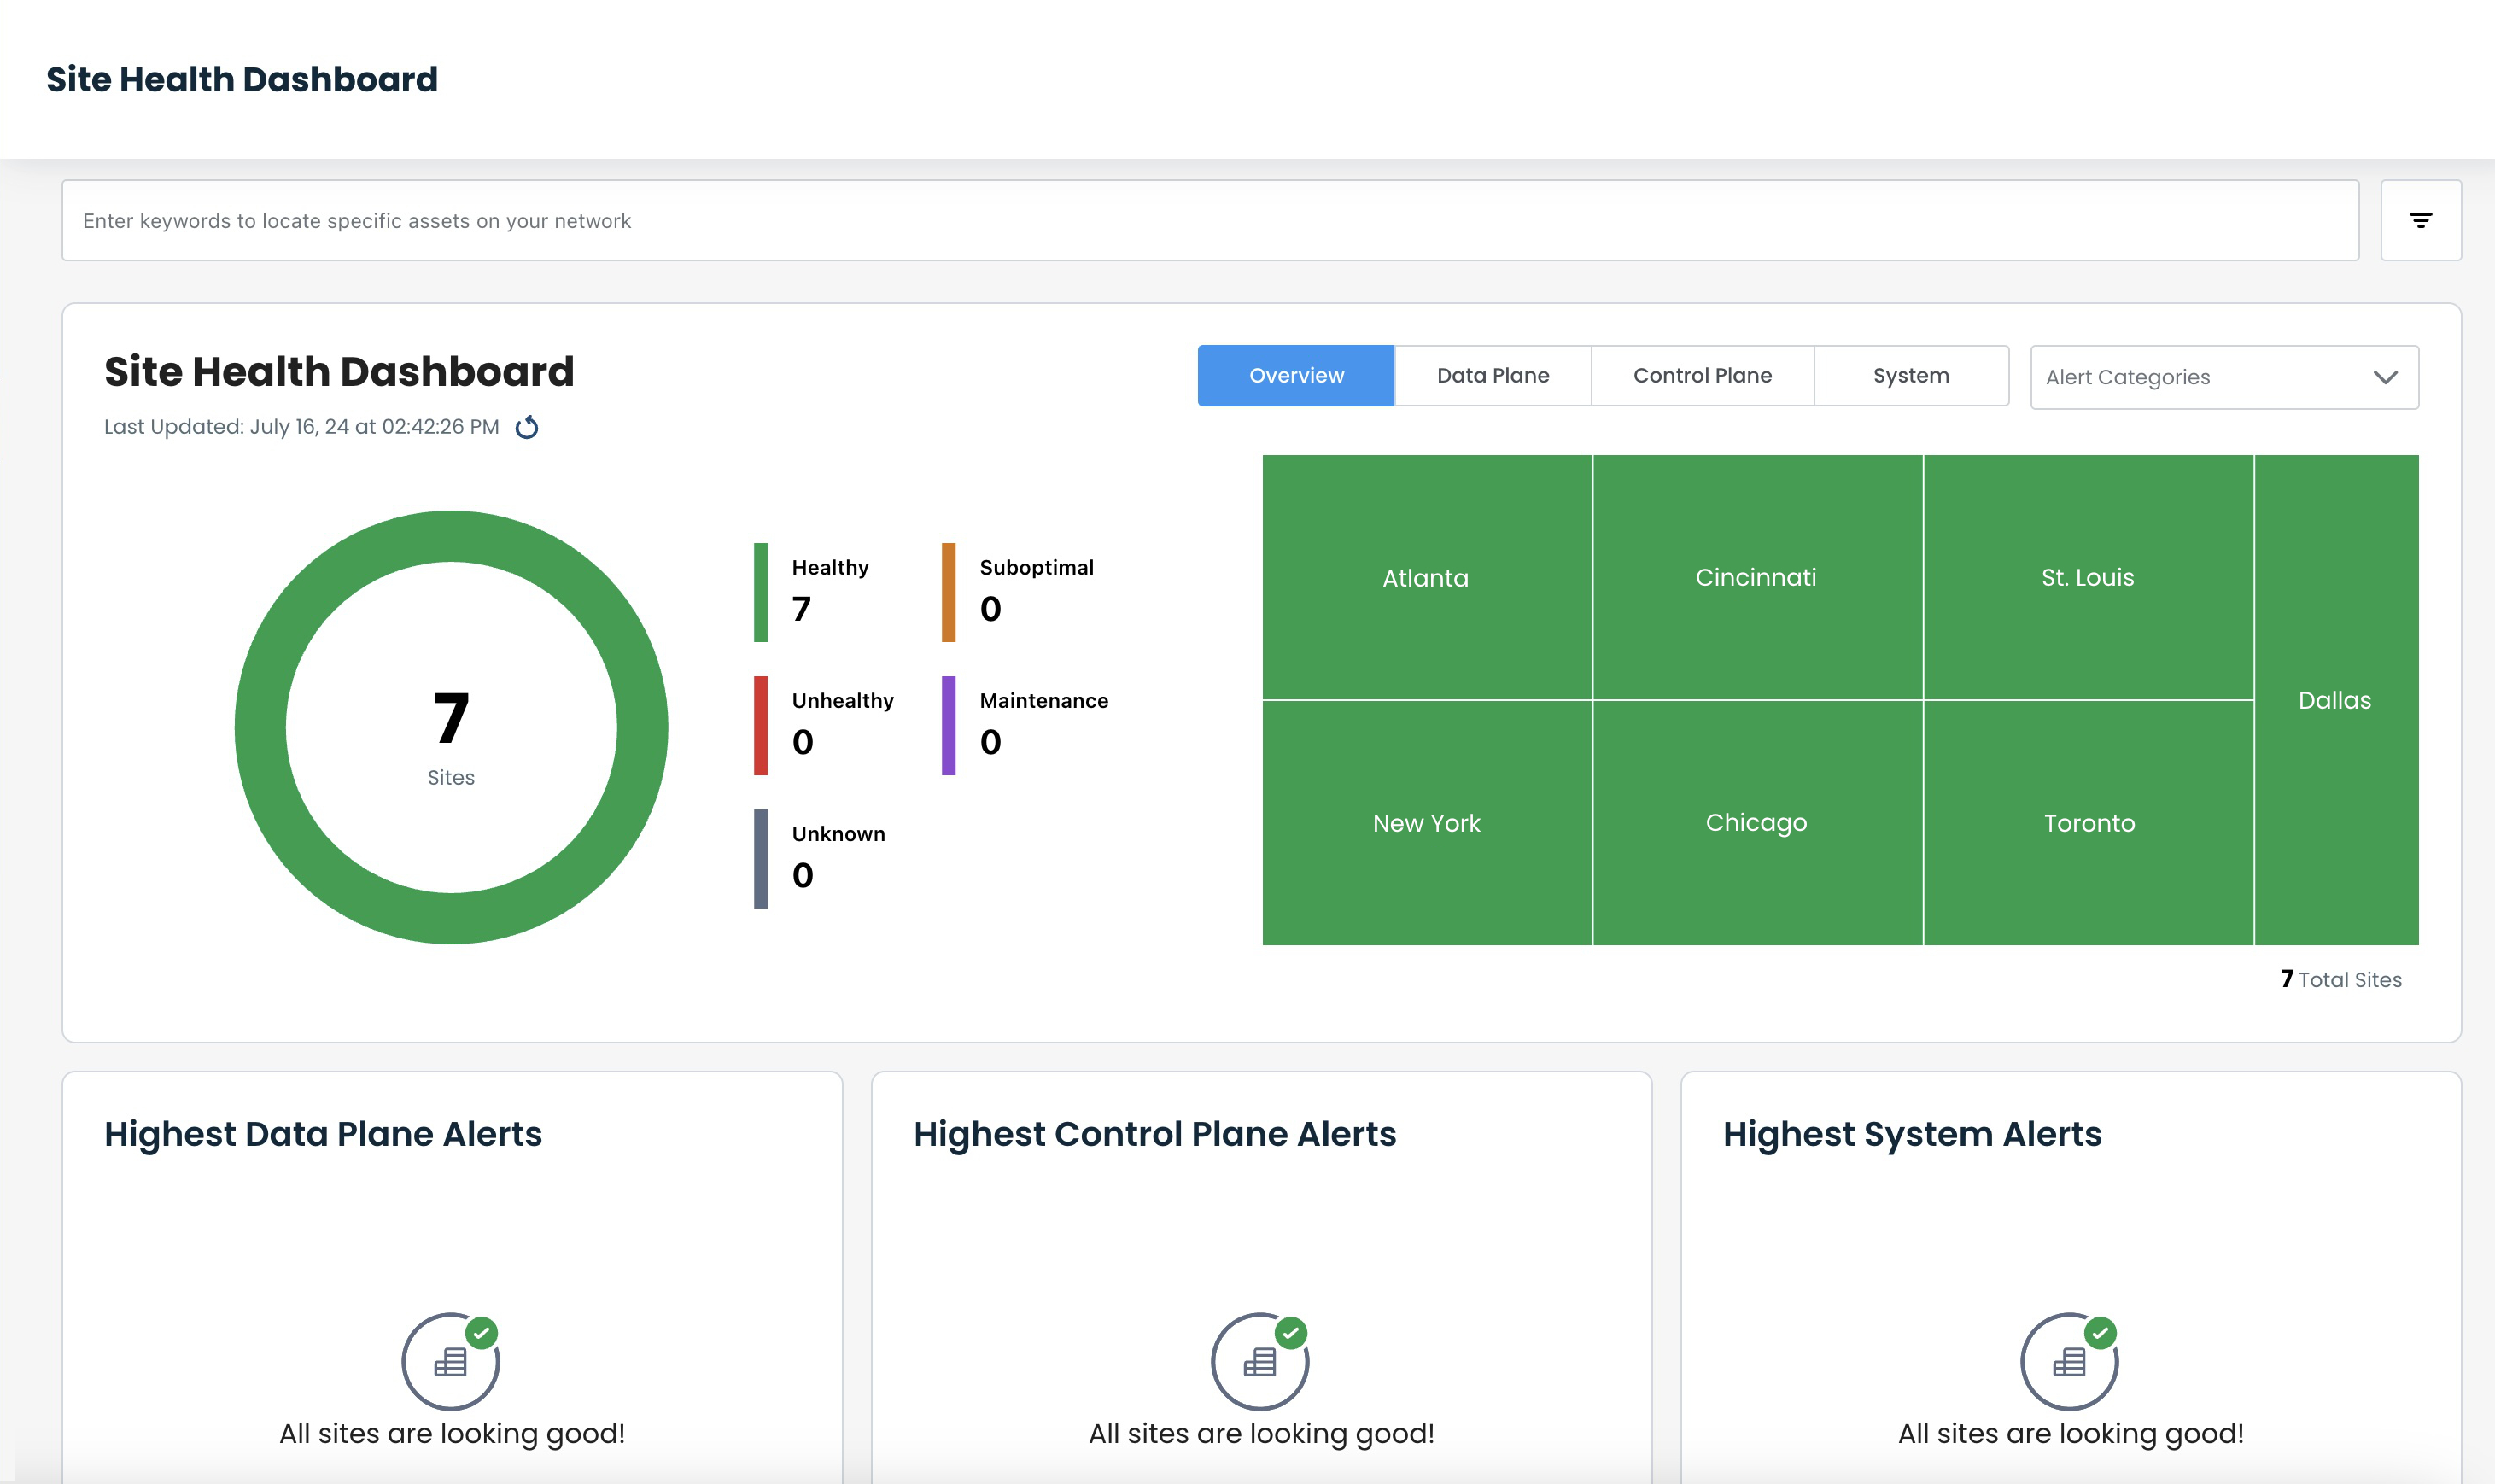
The Site Health Dashboard automatically lands on the overview page.
From here, you can see the health of every site in the network at a glance, customize your view to instantly get the data that you need, as well as have the ability to visualize the health overview of all of the Edges in a particular site with just one click.
.png)
The color-coded health status indicators across the dashboard are as follows:
Healthy: Green
Suboptimal: Orange
Unhealthy: Red
Maintenance: Purple (a site will have this indicator if one or more of its Edges are in Maintenance Mode)
Unreachable: Gray (a site will have this indicator if metrics are not being received)
Note:
The health status indicators are hierarchical: should multiple colors be indicated for different items in the same site, the site will read as the most severe of it's current categories, as follows from most severe down:
Unreachable
Unhealthy
Suboptimal
Healthy
Maintenance
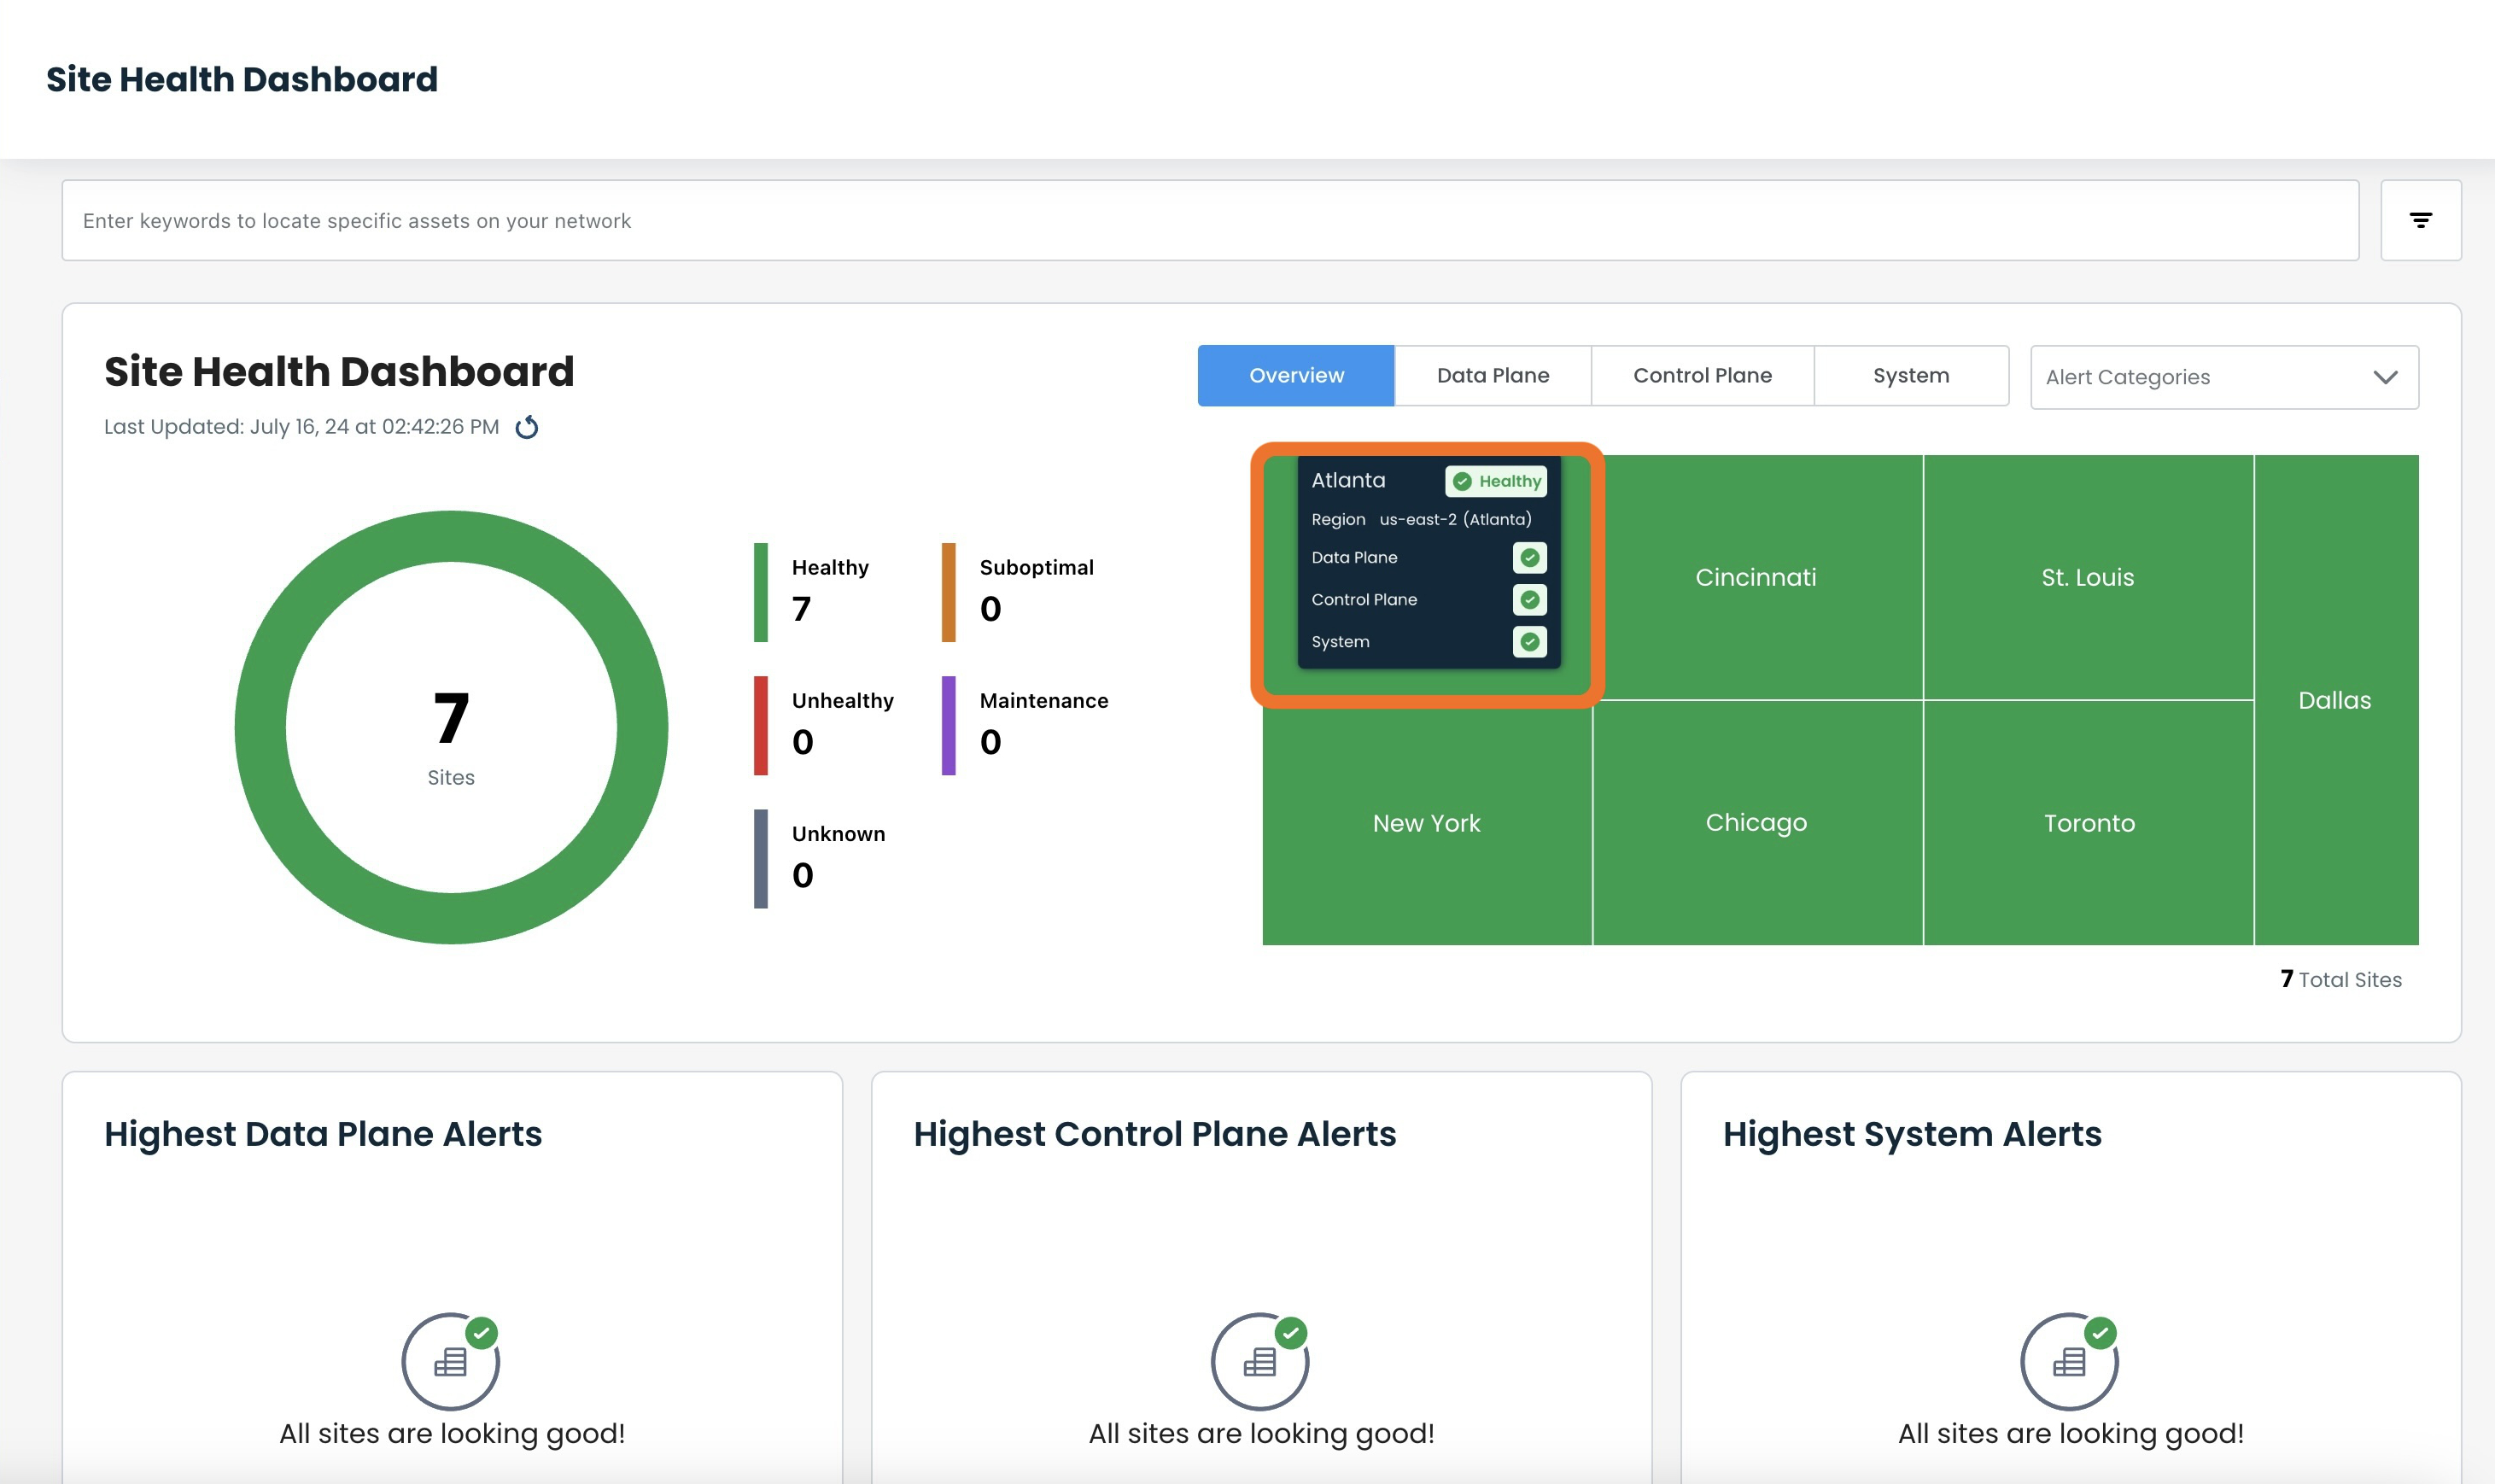
The Overview page is laid out in five sections:
Filter Bar (top of page): Information entered / selected here will determine the information shown on the entirety of the page.
Plane Selection and Alert Categories (uppermost right): The selections made here will narrow down the information shown to drill down to exactly what you are most interested in.
Donut Chart (upper left): Represents the health of all of the sites, including the number of sites in each level of health.
Heat Map (upper right): These tiles are both visual indicators of the health of the sites, and direct links to the health of the individual site and the Edges within that site.
Network Plane Alerts (bottom): Any alerts of issues within each plane of the network will be represented here.
Note:
The total number of sites are shown at the bottom right of the heat map; that number is updated to reflect any filtering.
Filter Bar
The filter bar allows for searching on either keywords or from a drop-down menu to instantly narrow down the results shown within the overview page.
Note:
Any subsequent filtering elsewhere on the page is in addition to these criteria. This sets the entire page, against which other data can be searched.
Filtering Using Keywords
Enter the desired keyword(s) to narrow your search for the most useful information at the moment.
Select the desired item from the drop-down of choices that match your entry.
.png)
The Site Health Dashboard will now reflect Sites that contain only the aspect of the keyword searched.
.png)
Multiple keywords can be searched on at a time. Simply type in the desired keyword following the earlier keyword(s) to receive the next drop-down of choices that match your subsequent entry.
Note:
There are no limits to the number of keywords upon which to filter; the Site Health Dashboard will continue to narrow down, including only the sites' information that match on all items.
Select the desired item by which to filter.
.png)
The Site Health Dashboard will now reflect only the sites that contain all of the aspects of the keyword searched.
While the filter criteria are engaged, a number icon will be present at the upper right corner of the filter icon.
.png)
Filtering Using Drop-down Selections
Click the filter icon.
Click any filter to reveal the drop-down that will contain all of the selections that are currently within the network.
Note:
There are no limits to the number of keywords upon which to filter; the Site Health Dashboard will continue to narrow down, including only the sites' information that match on all items.
.png)
Click on any category to expand the drop-down to open all choices within that section.
.png)
Select the desired item by which to filter, either by scrolling through the selections, or entering a keyword.
In this example, "Altafiber" was found and selected by scrolling and clicking the desired circuit.
.png)
Text in the search field can additionally yield results.
.png)
The Site Health Dashboard will now reflect only the sites that contain all of the aspects of the drop-down menu searched.
While the filter criteria are engaged, a number icon will be present at the upper right corner of the filter icon.
.png)
Note:
No matter which method is used (keyword or drop-down), the other field will also show the filter criteria; they display in tandem.
While the filter criteria are engaged, a number icon will be present at the upper right corner of the filter icon representing how many filters are selected.
Plane Selectors and Alert Categories
Plane Selectors
The buttons next to Overview filter the Site Health Dashboard to show the individual data for the selected network plane.
.png)
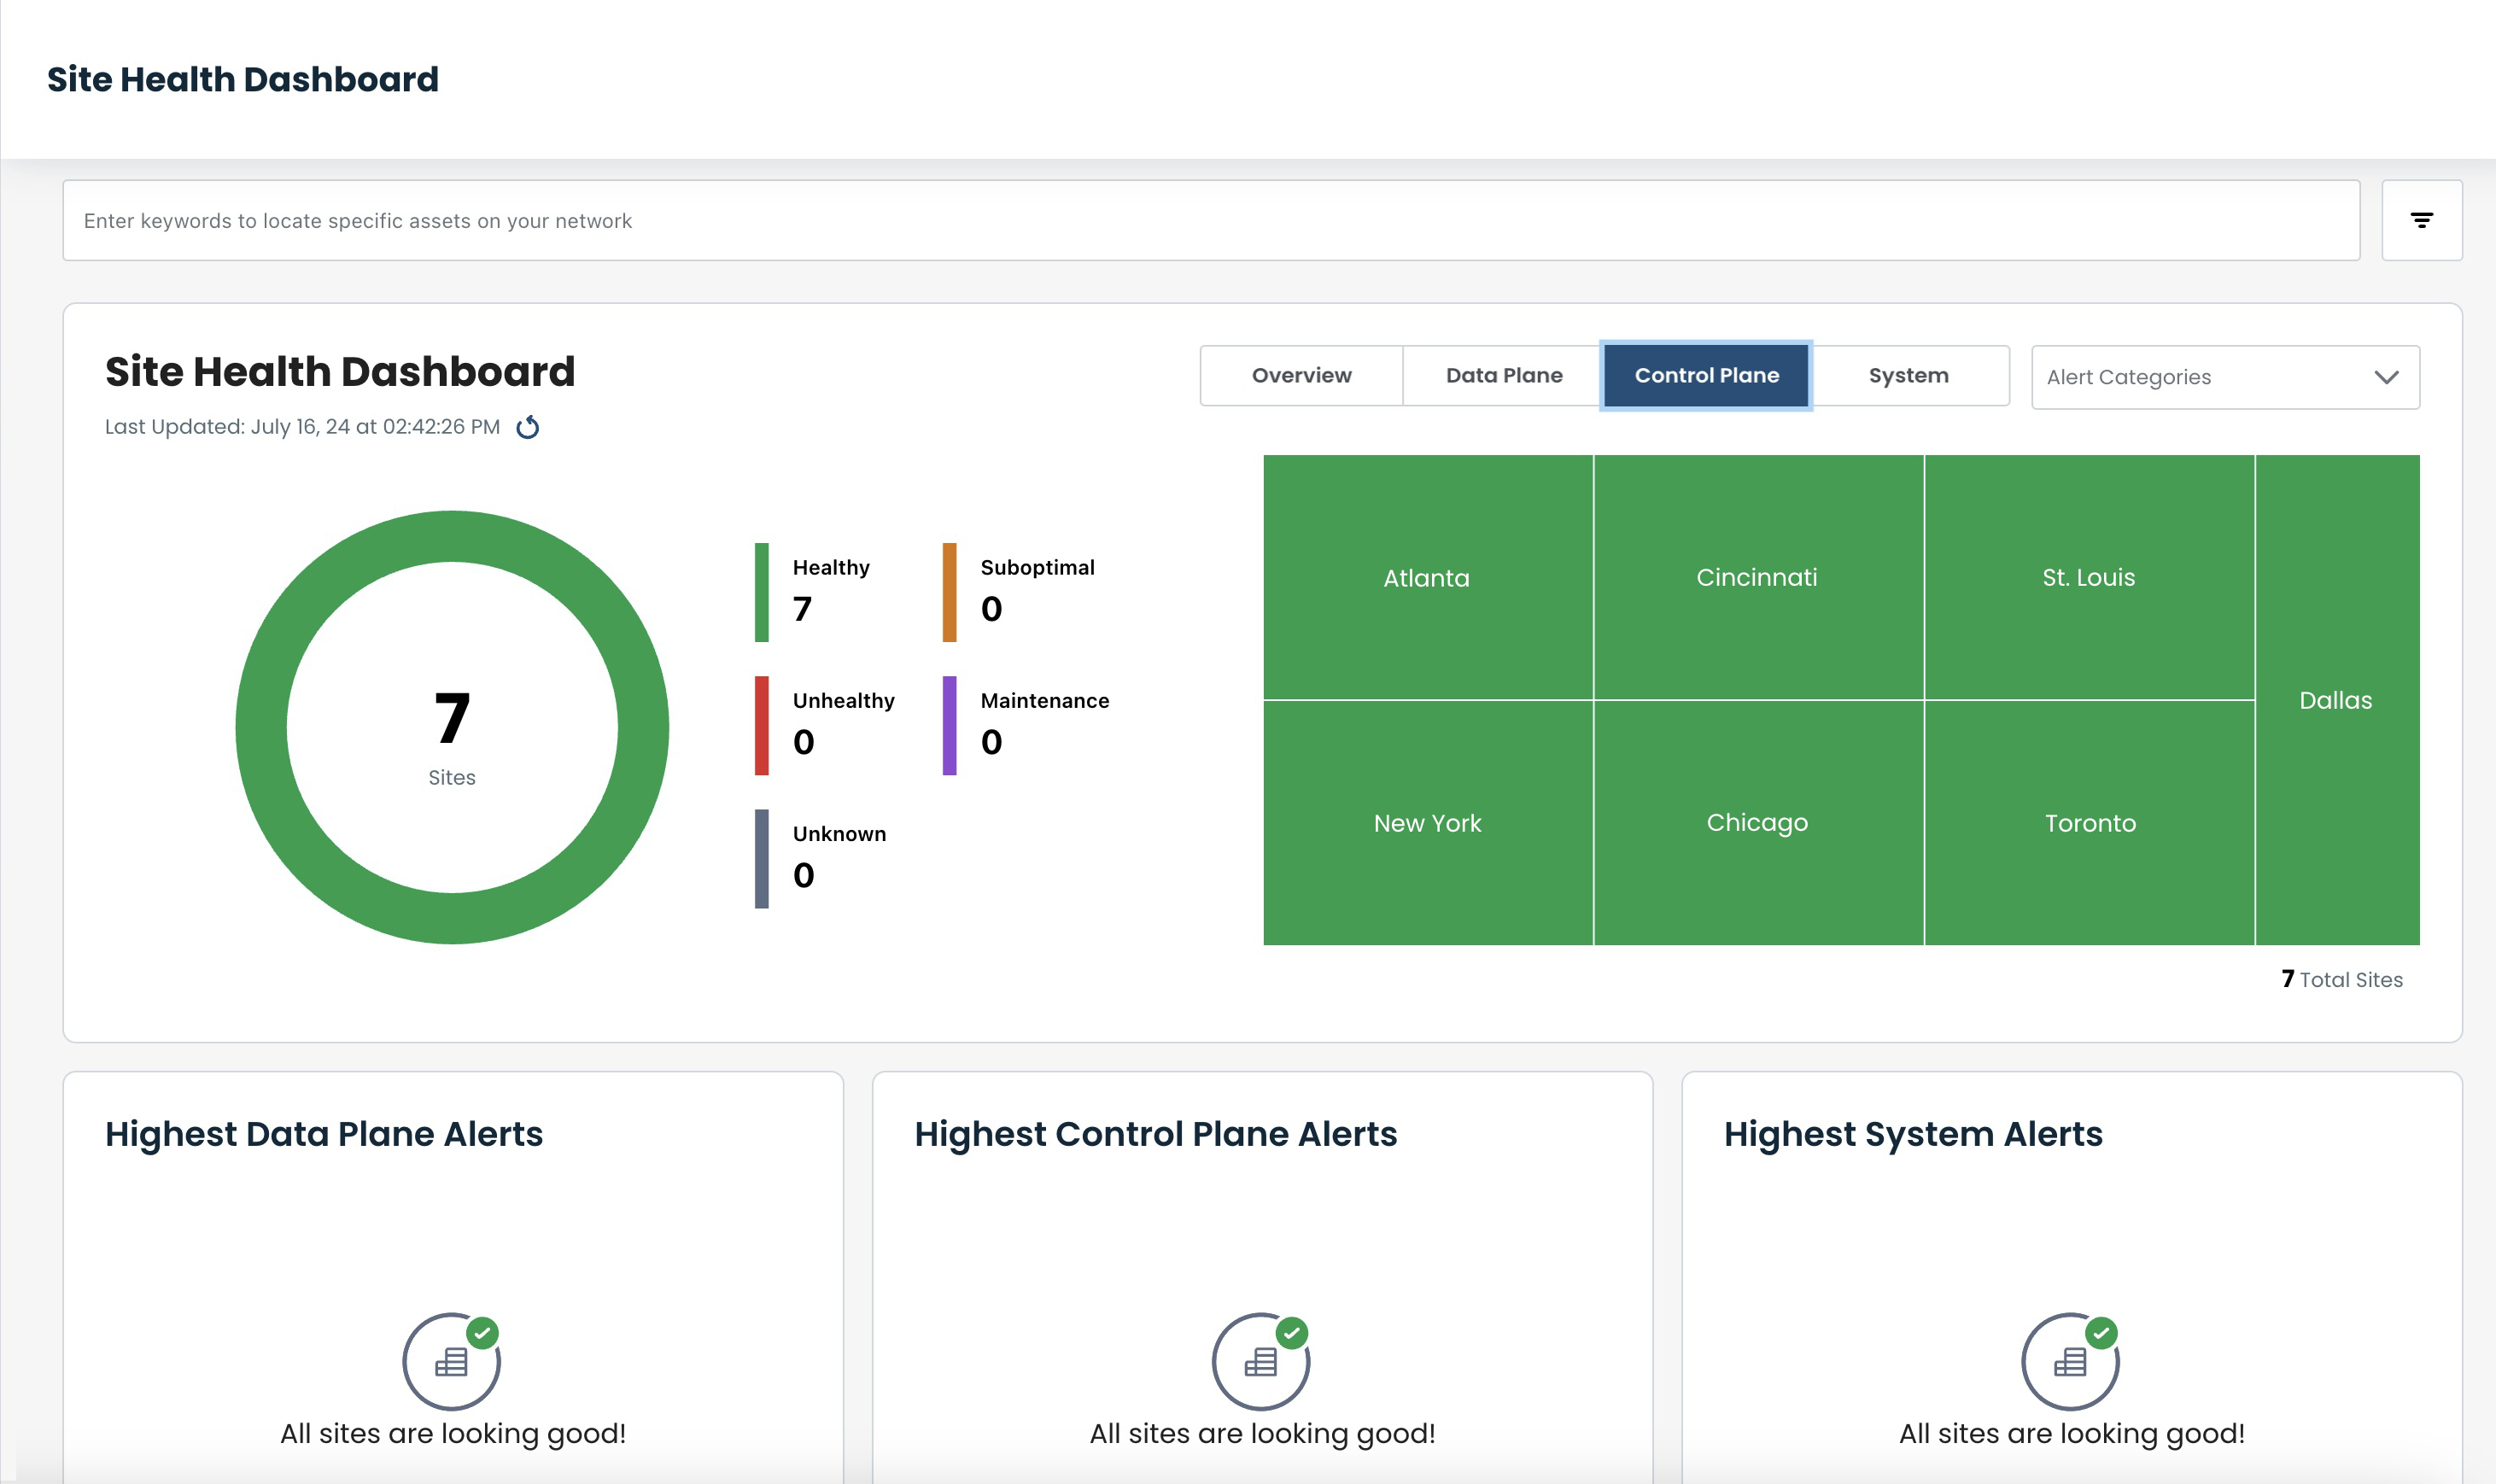
Select the desired plane.
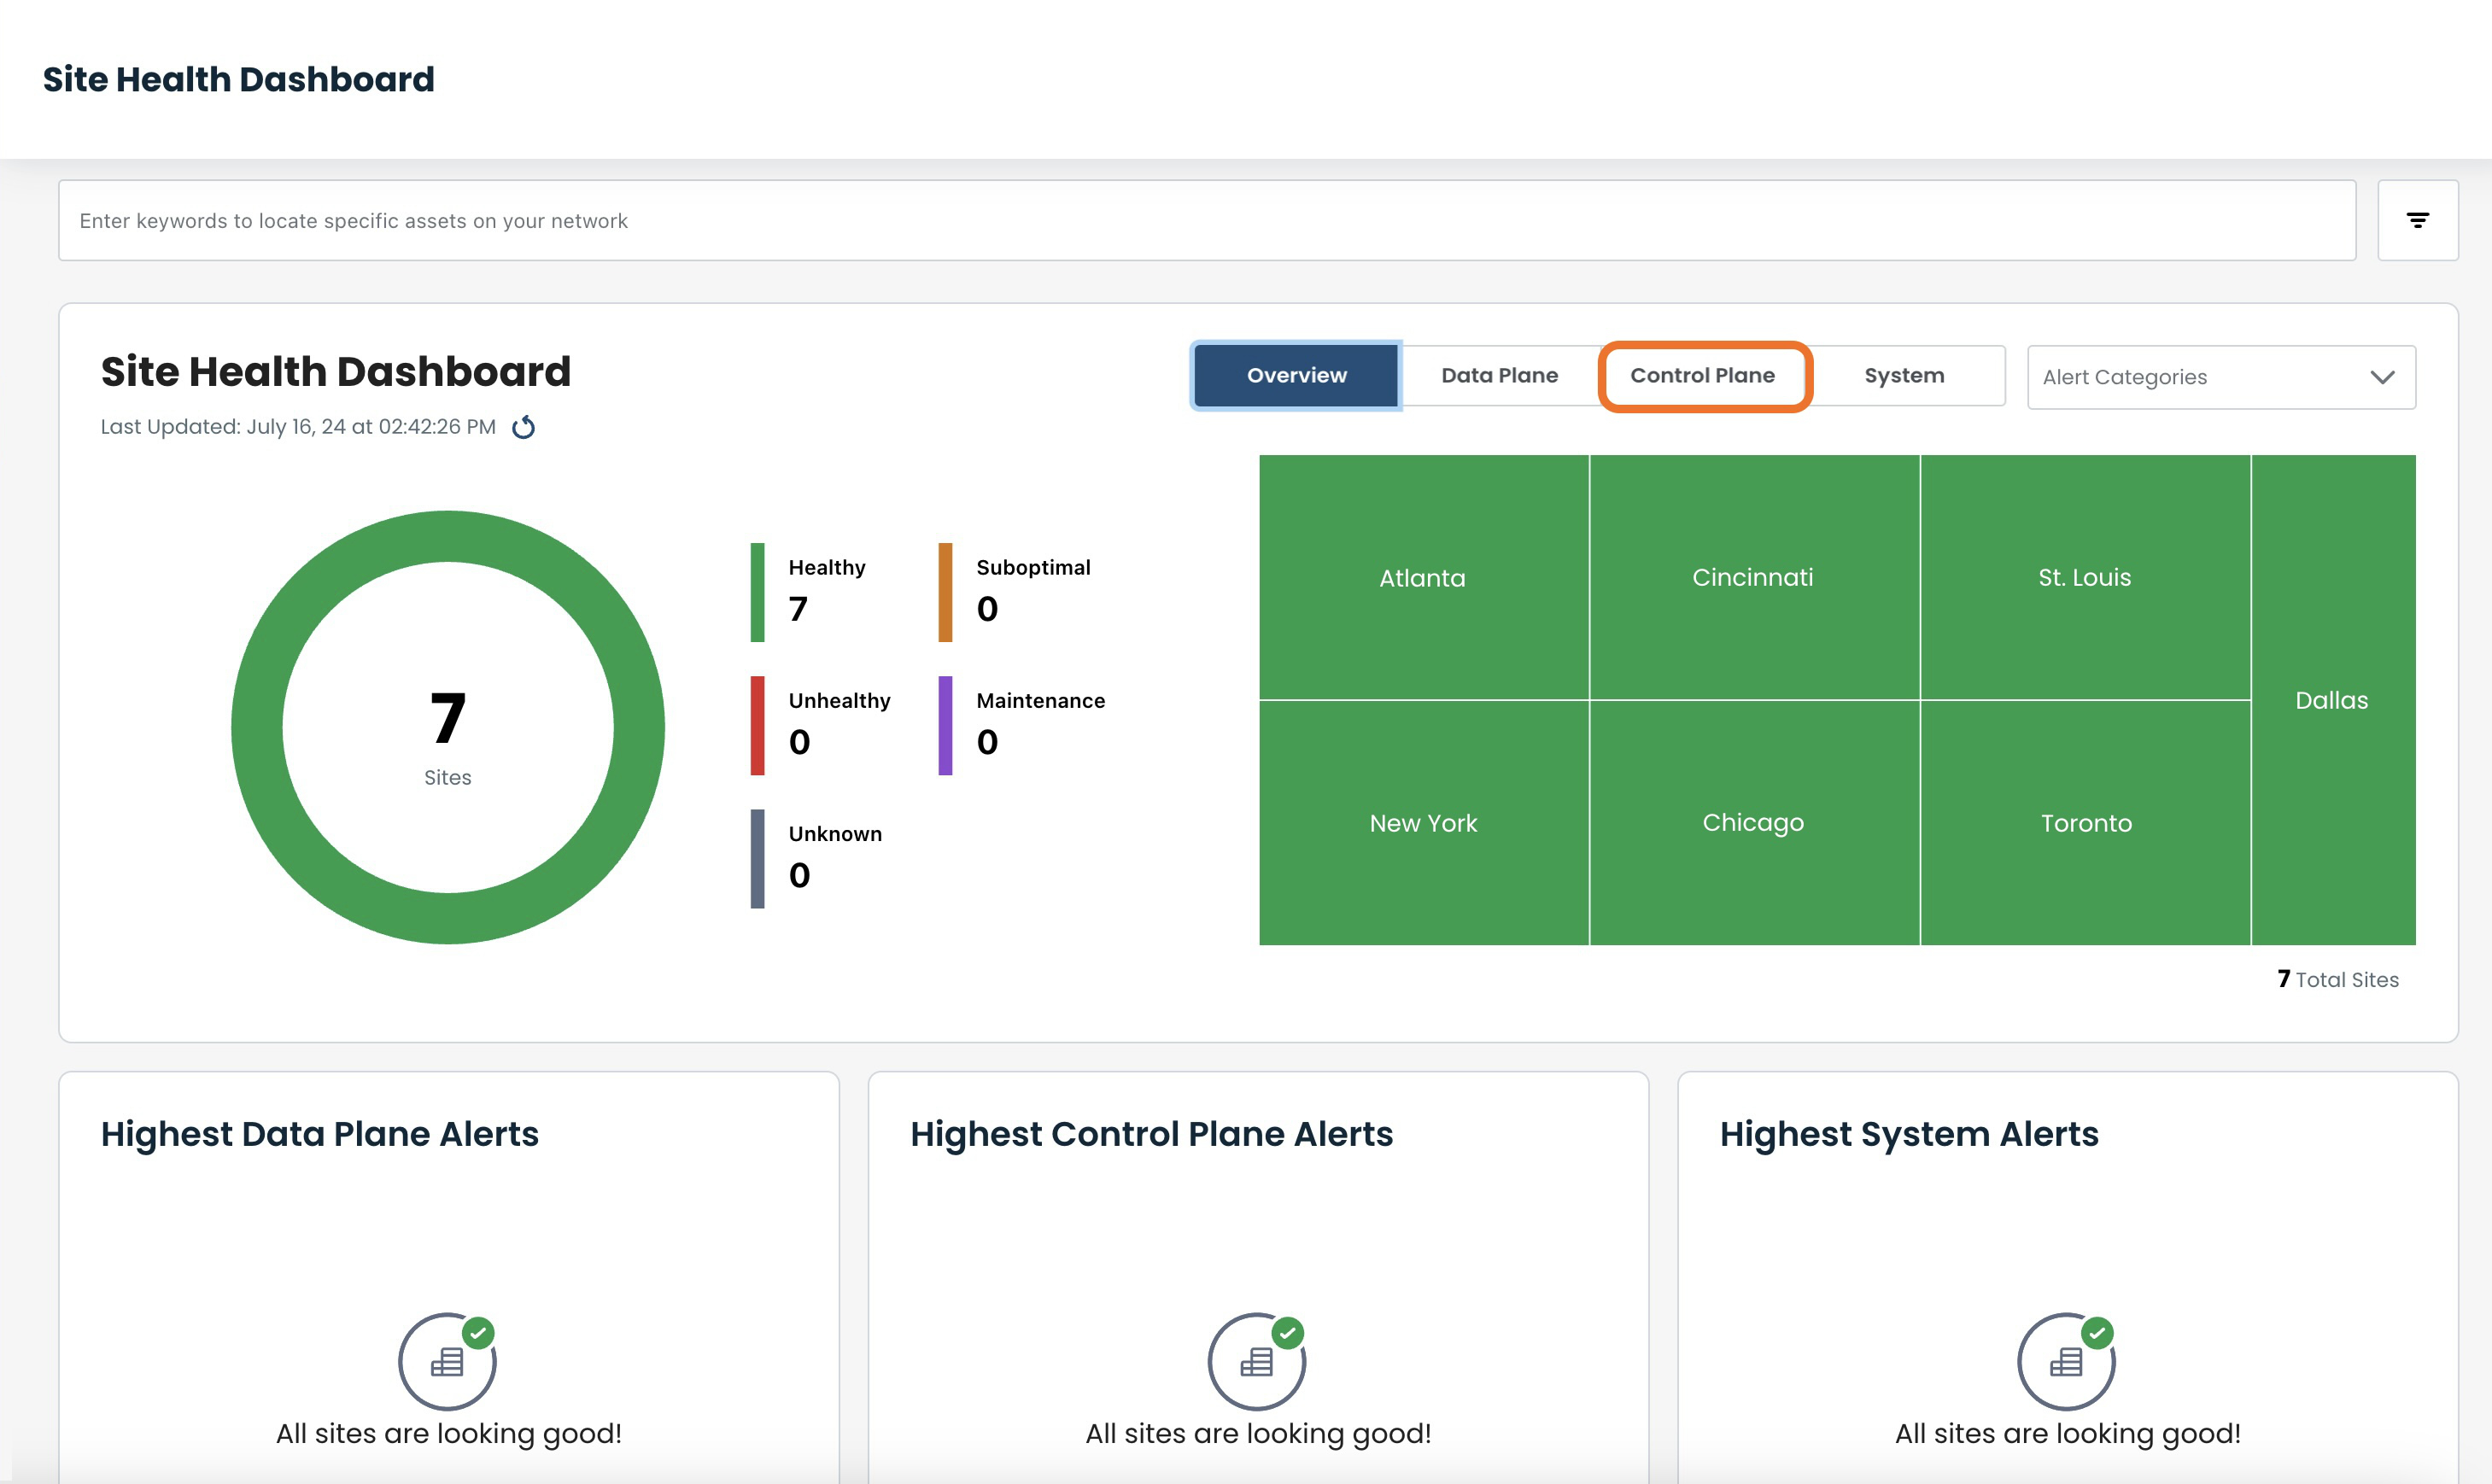
The Site Health Dashboard will now show the health of the sites with respect to that plane; in this example it is set to the Control Plane.
Alert Categories
The Site Health Dashboard can also be filtered by alert categories.
The data will provide an instant Overview look at the health of each site with regards to the selected alert category/categories.
Click the caret to open the Alert Categories drop-down.
.png)
Select the desired alert(s).
.png)
The Site Health Dashboard immediately shows the health of each site with regard to every category selected.
.png)
Note:
Sites are grouped into regions, denoted by the wider divisions in the heat map.
Site Health Donut Chart
This represents the health of all sites included in the network.
Site health and corresponding colors are as follows:
Healthy: Green
Suboptimal: Orange
Unhealthy: Red
Maintenance: Purple (a site will have this indicator if one or more of its Edges are in Maintenance Mode)
Unreachable: Gray (a site will have this indicator if metrics are not being received)
Hovering over any section of the donut chart will provide a quick look at the number of sites that are included in that health level.
The number of sites present in each health level is tallied to the right, within the legend.
Your title goes here
The health status indicators are hierarchical: should multiple colors be indicated for different items in the same site, the site will read as the most severe of it's current categories, as follows from most severe down:
Unreachable
Unhealthy
Suboptimal
Healthy
Maintenance
.png)
The donut chart and legend can also be utilized as filters.
Filtering by the Donut Chart
Consider a Heat Map that presents as such:
.png)
Clicking on a health level in the donut chart will filter the heat map to only show sites with that health state. Multiple levels can be selected at the same time.
Let's say we want to only show the sites presenting as healthy.
Click the desired color in the donut chart (in this case, green).
.png)
This will update the heat map to show only the healthy sites for quick visualization of the sites you are most interested in.
The color chosen will show separated in the donut chart.
.png)
Click as many health levels as desired; the heat map will continue to filter down.
To reset the heat map, simply click again on the prior selected donut chart colors.
Filtering by the Legend
Consider a Heat Map that presents as such:
.png)
Clicking on a health level within the legend will remove all sites with that health state from the heat map. Multiple levels can be removed at the same time.
Let's say we want to remove the sites presenting as unreachable.
Click the desired color in the legend (in this case, gray).
.png)
This will update the heat map to show sites with health levels other than the removed one for quick visualization of the sites you are most interested in.
The color removed will show grayed-out in the legend.
.png)
Click as many health levels as desired; the heat map will continue to filter down.
To reset the heat map, simply click again on the prior selected legend colors.
Heat Map
Every site in the network is represented in this section of the Site Health Dashboard.
.png)
Hovering over each site provides a quick look at the site, specifically:
Site Name
Overall health
Region
Individual Health statuses of:
Data Plane
Control Plane
System
.jpeg)
Each of these tiles is also a clickable button, a direct link to the health of the individual site and the Edges within that site.
Network Alerts
If no alerts are present, this section of the Site Health Dashboard will show as such:
.png)
Should issues arise within a network, the highest alerts will be represented in their respective planes of the network and would appear similar to this:
.png)
The site names and number of alerts within those sites are shown here.
Each bar is a link that takes you directly to the current issues of the site that has the alert(s).
Note:
Within these alert areas, the sites are prioritized as follows (up to top 10 entries):
Sites with the highest number of alerts
Should there be sites with the same number of alerts, those with the most critical alerts
Site-Level Information
From the Site Health Dashboard, you can drill down to the details about each site, and the Edges within that site, from the tile for the desired site.
When the cursor is over the box for that site, the quick look information will pop up.
Click on the tile.
This opens the Issues page, which leads to detailed information for the site.
.png)
Common Information Included in All Site-Level Information Pages
Every tab selected from here will contain the following information, whether you are on the Issues tab, or move to Data, Control, or System planes:
Site Name and Health
Edge Selector and Time Picker
Plane Selector
Edge Health and software version
View Site Details link
Device Troubleshooting link
Note:
Unless otherwise specified, all information provided at the Site-Level is concerning the Active connection.
Site Name and Health (uppermost left of page)
The site name and its current health are displayed here, as well as the last updated date/time, and an option to reload the page.
Site health and corresponding colors are as follows:
Healthy: Green
Suboptimal: Orange
Unhealthy: Red
Maintenance: Purple
Unreachable: Gray
.png)
Edge Selector and Time Picker (uppermost right of page)
Edge selector: Determines the data shown; the information will pertain to the Edge chosen
Click the desired Edge to see its information displayed in any of the tabs from this page.
.png)
Time picker: Narrows down the data retrieval to the time frame selected
By default, "Past 15 minutes" is selected as the period of time during which the data will be collected.
Select the desired timeframe for data to be collected, between 5 minutes and the past month.
.png)
Should a custom timeframe be desired, click 'Custom Range'.
.png)
This will open a custom calendar allowing dates and times to be selected, down to the exact second desired.
Enter the desired information.
Click 'Apply'.
The pages will adjust instantly to reflect the data retrieved when each field is chosen.
.png)
'Clear' will revert the custom calendar to the current date, where you can customize again if desired.
.png)
'Reset Custom' will revert the Time Picker to the original default setting of "Past 15 minutes".
.png)
To edit the custom timeframe, click anywhere in the date / time field and the calendar will reappear.
.png)
Plane Selector (upper left)
The Plane selected will change the data shown in the main area of the page to reflect either known issues, or status information regarding the Data Plane, Control Plane, or System.
.png)
Edge Health and Software Version (upper left)
The current health of the Edge displayed is shown here, along with the current software version, and how long the Edge has been up.
Edge Health and corresponding colors are as follows:
Healthy: Green
Suboptimal: Orange
Unhealthy: Red
Maintenance: Purple
Unreachable: Gray
.png)
View Site Details Link (bottommost right)
Further information on site details can be found from this link.
Click the 'View Site Details' button.
.png)
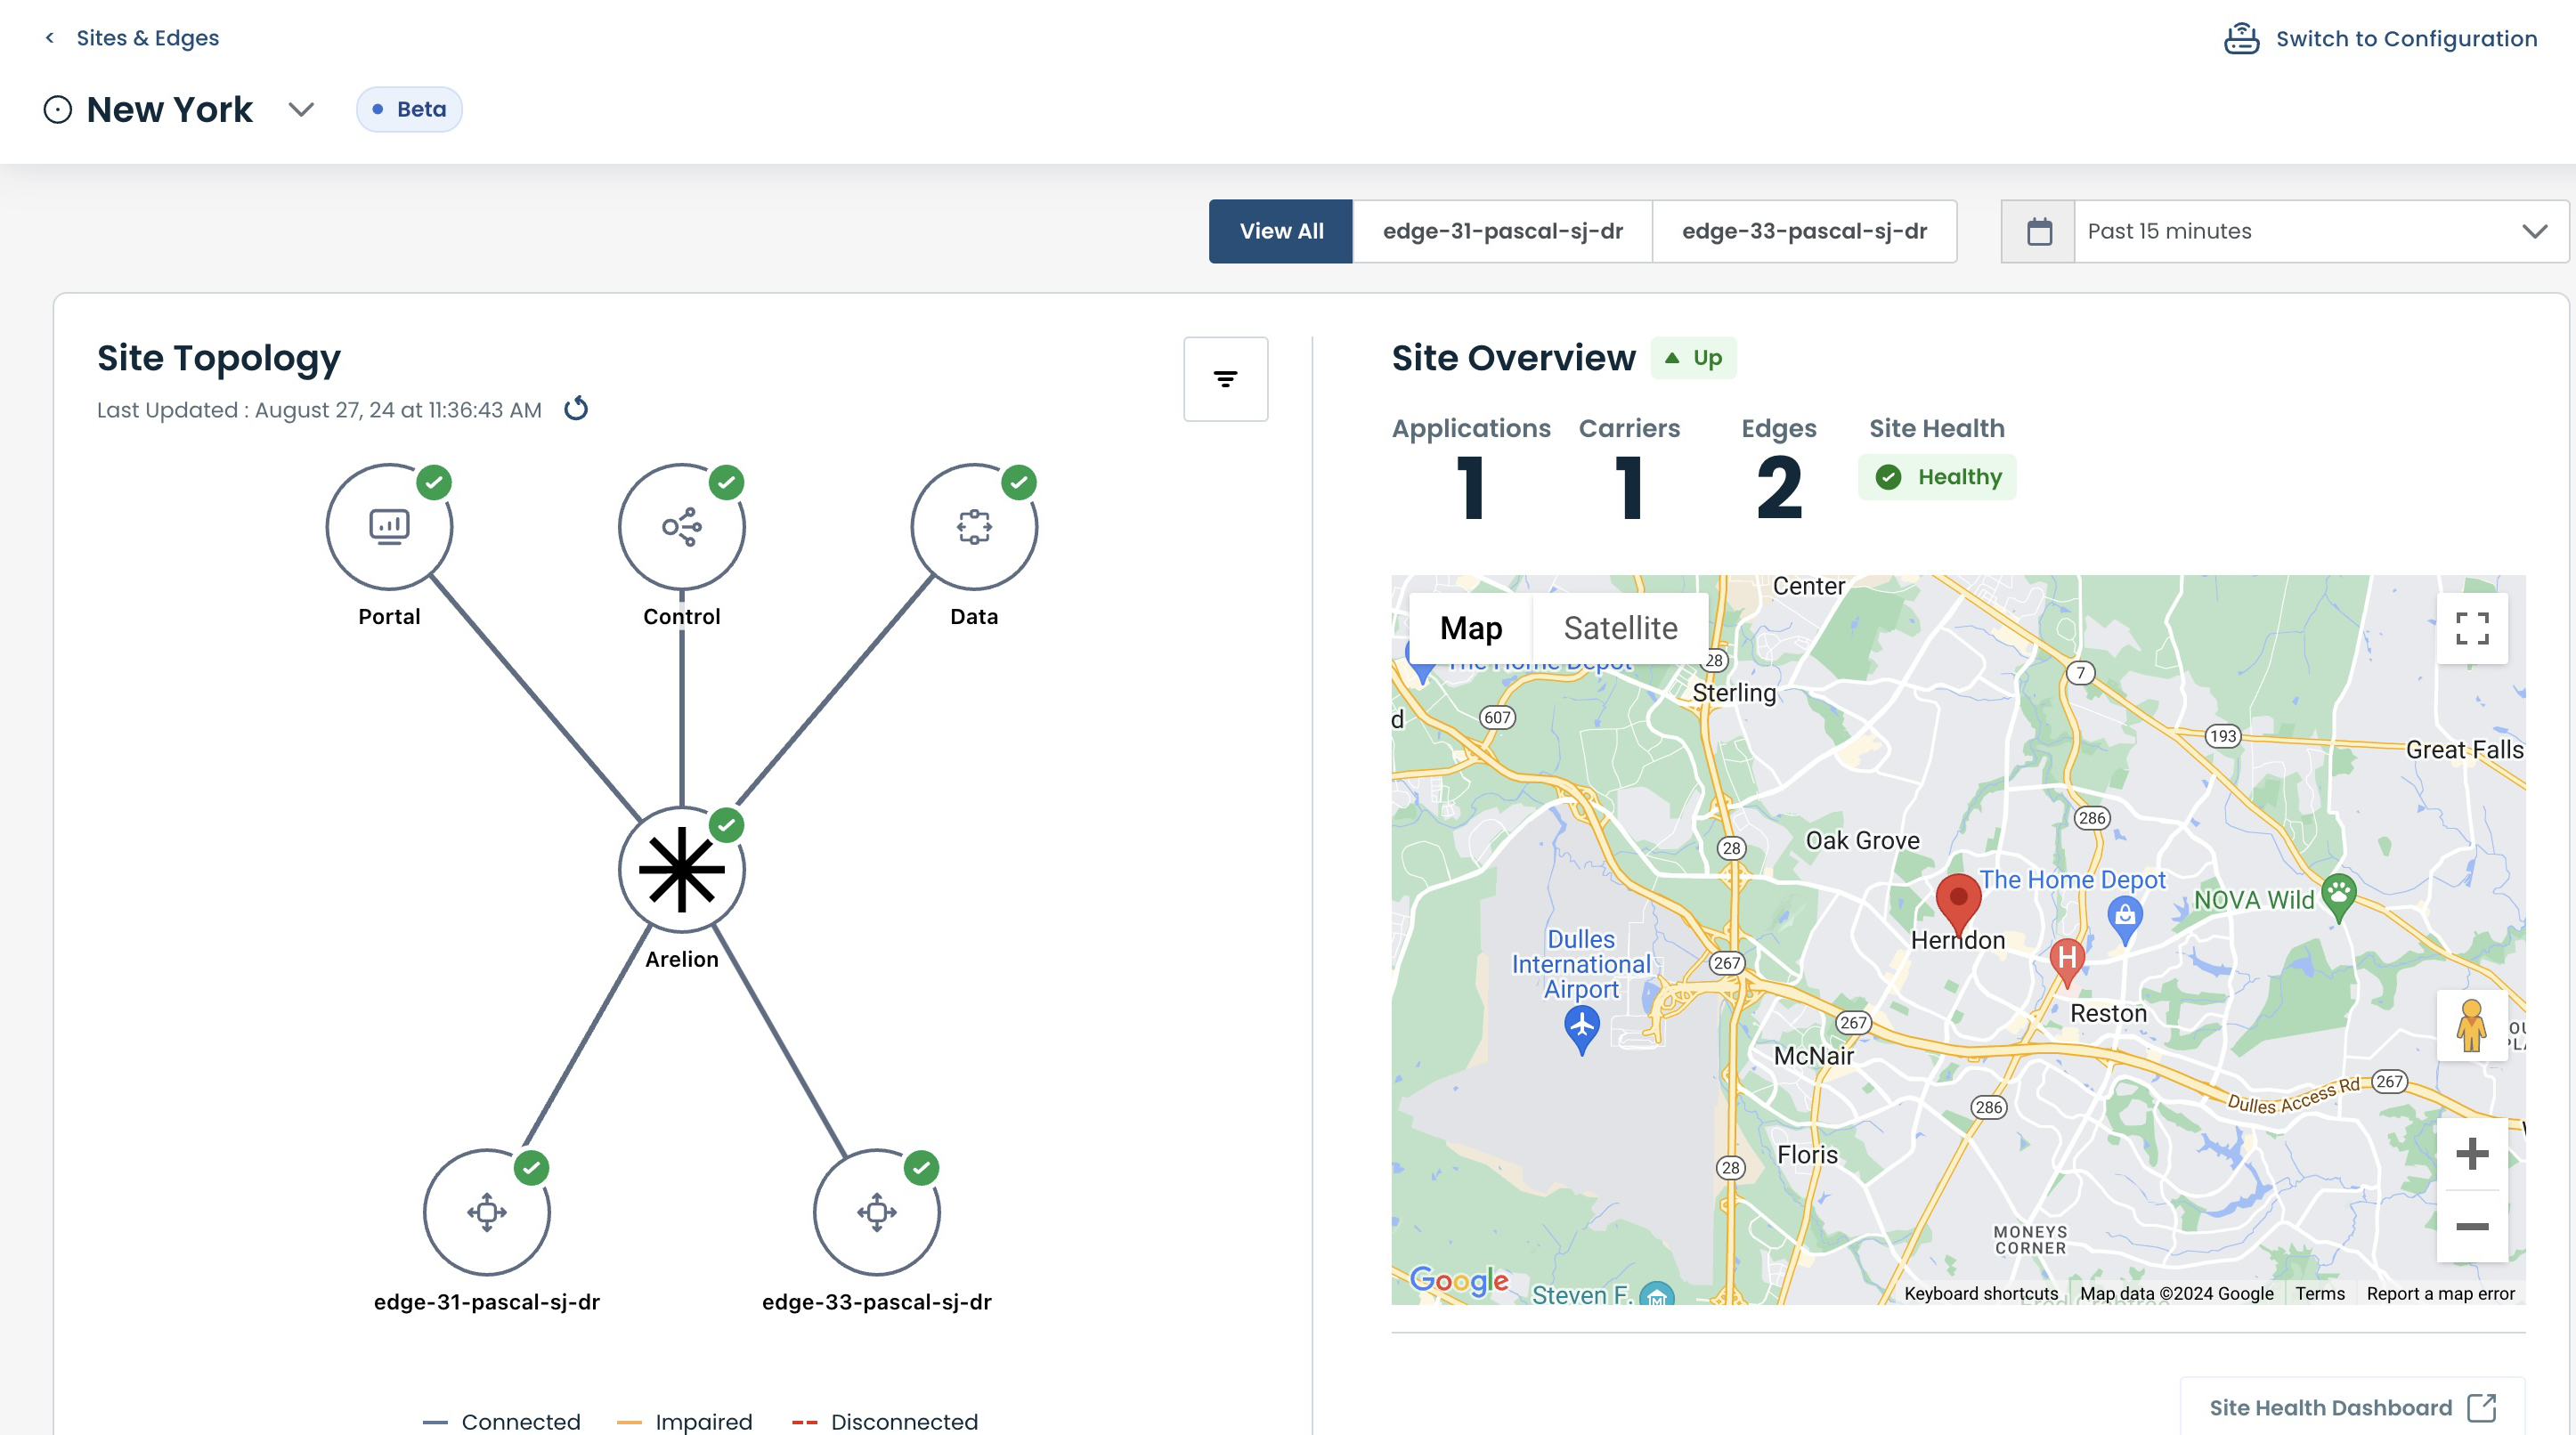
This will open the Site Dashboard with detailed information on utilization and connectivity for the site.
Device Troubleshooting Link (bottommost right)
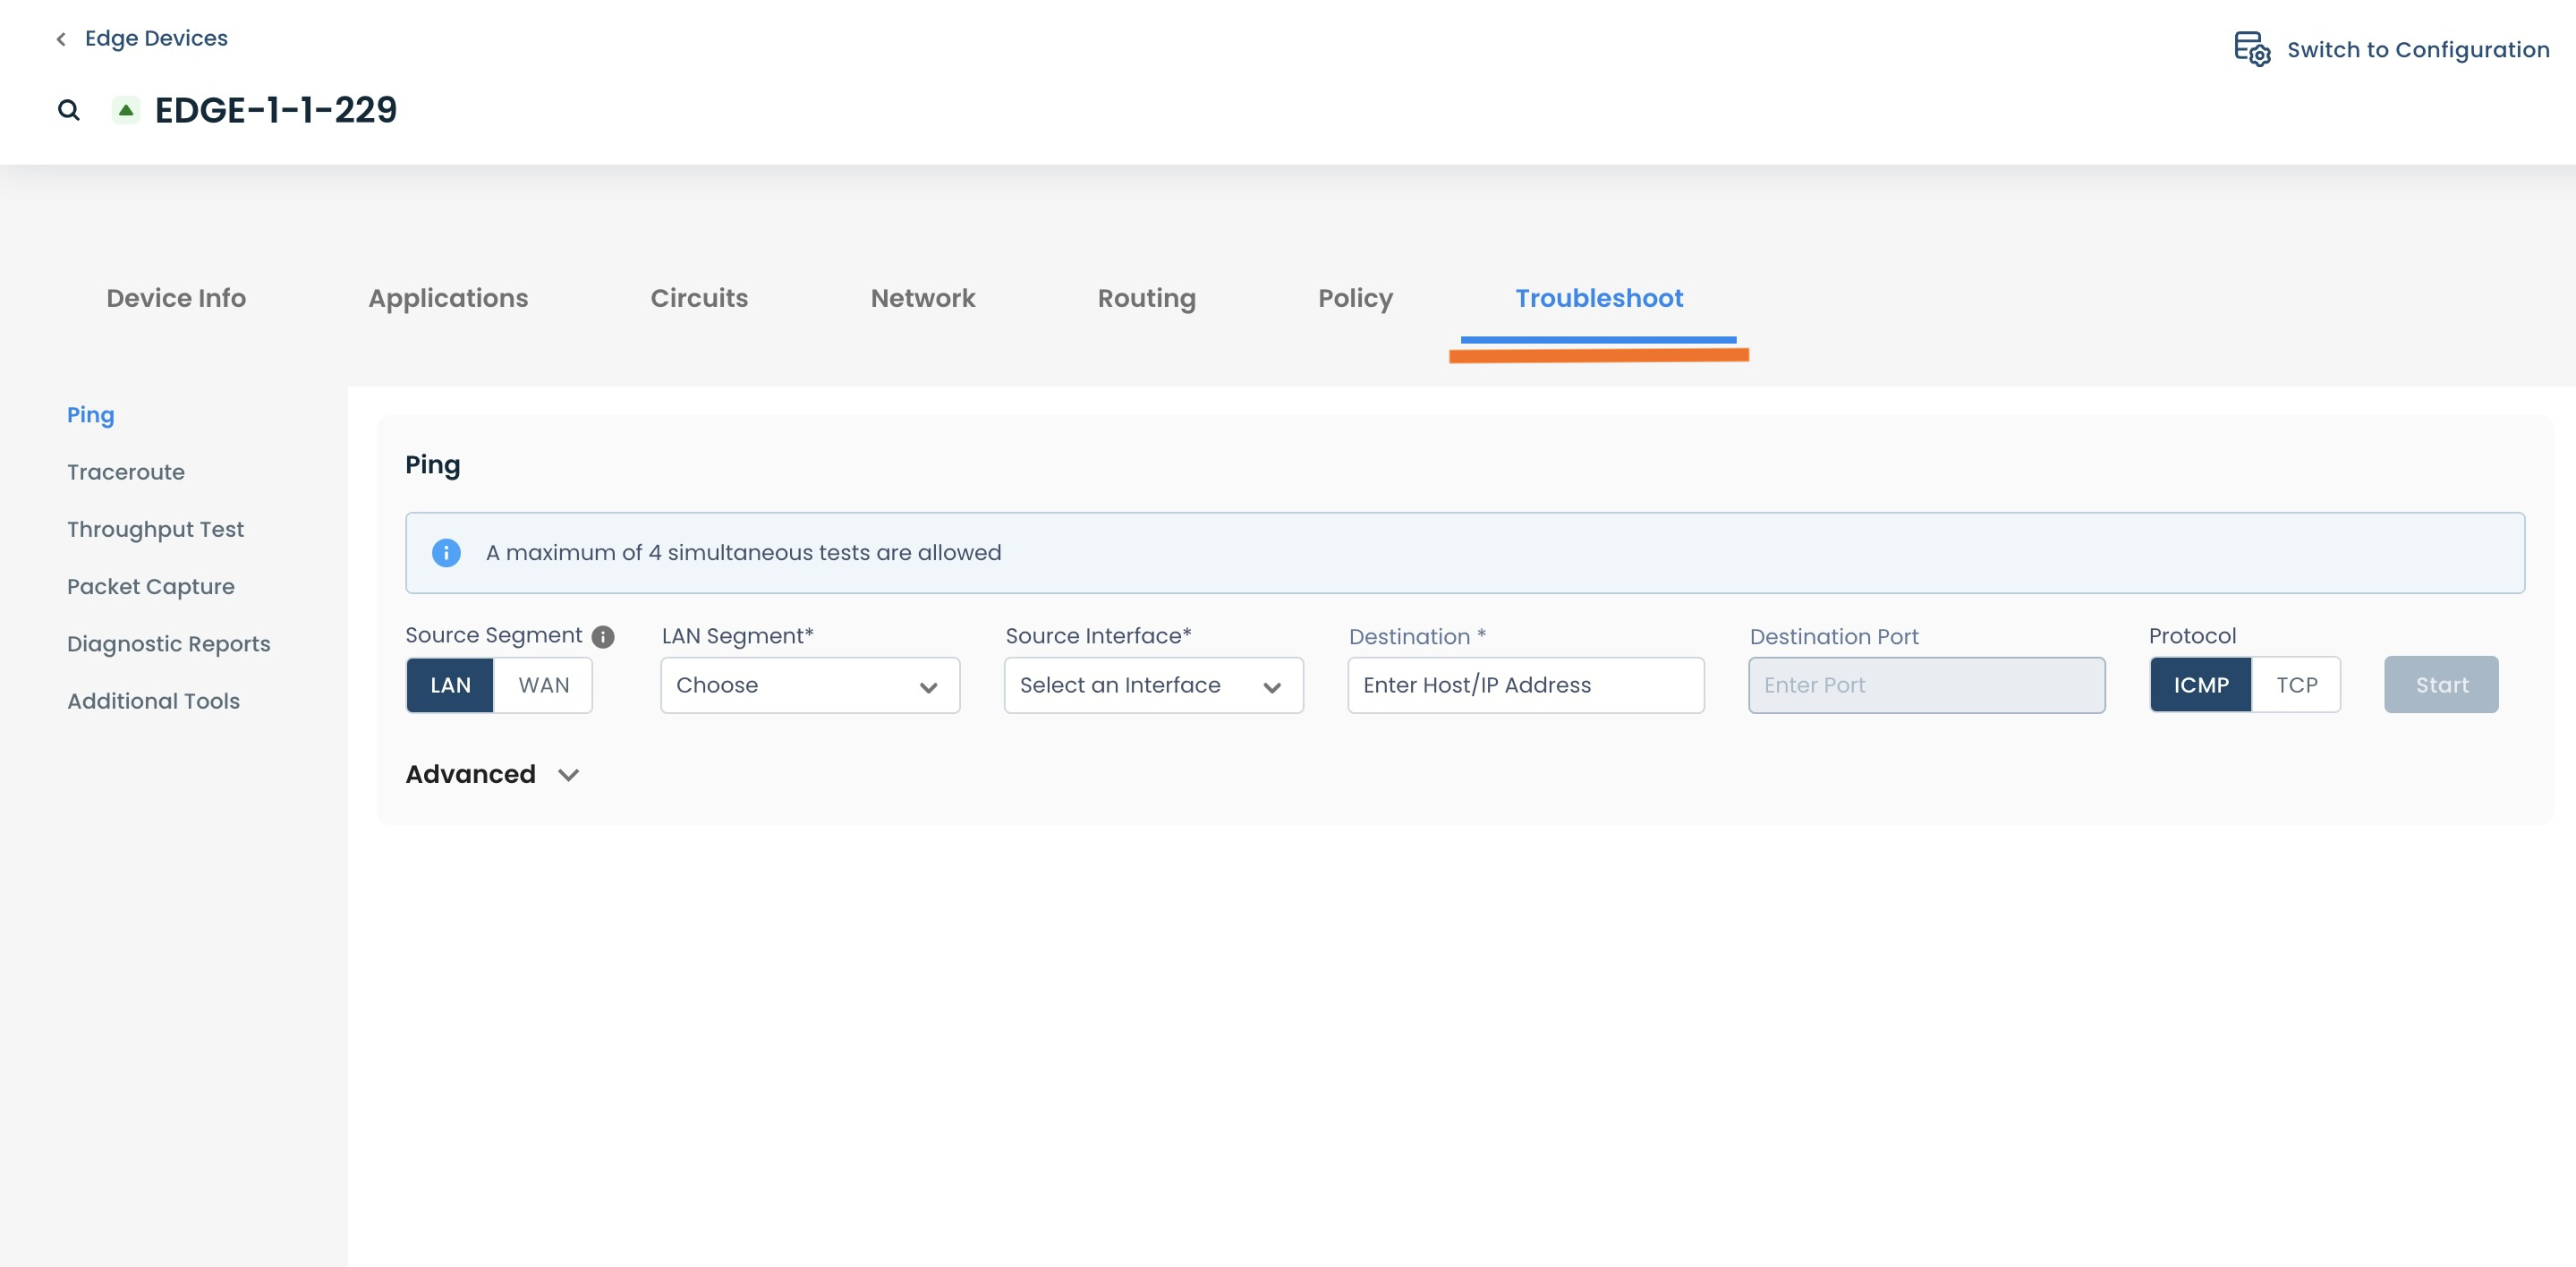
Should further testing and exploration of the issue be desired, click 'Device Troubleshooting'.
.png)
This will open the Troubleshoot tab for the Edge.
Issues
The Issues page lists all of the known issues for the Edge selected in this site.
If there are no known issues for this Edge, "No issues found" will appear and the table will be blank.
.png)
Should any known issues be present, there will be an an alert symbol next to "Issues", and the issues will appear in this table.
This table includes the following:
Severity: The assigned level of the issue; Critical, High, Medium, or Low.
Entity: The item for which the issue is occurring; i.e. site, device, interface etc.
Issue: Description of the problem
Reason: Cause of the issue
What: Parameter of which the issue is occurring
Start Time: When the issue was first noticed
Plane: The plane in which the issue is occurring
Status: Current status of the issue; Ongoing, or Ended. For ease of troubleshooting, "Ongoing" issues are prioritized at the top of the list.
End Time: When the issue was resolved (and status changed to "Ended")
.png)
Clicking anywhere in the row for an Issue will take you directly to the tab of the plane where the issue is occurring, whether it be Data, Control, or System.
Disabling Issues
If an Issue is known to the user to not be of concern (if an Edge is undergoing testing, for example), the issue can be disabled, so as not to be reflected on the Site Health Dashboard.
Click the [-] to the far-right of the Issue to be disabled.
.png)
A modal will appear to confirm the disable of the issue.
If desired, enter information regarding the disable in the 'Notes' field.
Click 'Confirm'.
.png)
The issue will now be disabled.
It will not be reflected in the Site Health Dashboard heat map, but will still remain in the Issues Table for ease of location should the issue need more attention.
Enabling Issues
Should it be desired for a disabled issue to be represented in the Site Health Dashboard again, it can be re-enabled.
Click the [+] in the far-right of the Issue to be enabled.
.png)
A modal will appear to confirm the enable of the issue.
Click 'Confirm'.
.png)
The issue will now be enabled.
It will again be reflected in the Site Health Dashboard heat map and will continue to remain in the Issues Table for ease of location should the issue need more attention.
Data Plane
The data plane tab shows the status of, and information about, the traffic between the Edge and the Graphiant Core.
From the Issues (or other) tab, click the 'Data Plane' tab.
.png)
The data plane information will populate.
.png)
Note:
The graphs on this page are autoscaling, to accommodate any data that may appear.
The page is broken down into four sections:
Data: Down Transitions
QoE
Data: Loss Value
Latency and Jitter
Data: Down Transitions
This graph shows if there have been any instances of a connection loss to the Graphiant Core.
The number of transitions is measured in integers, with the color representation of:
Blue: Active connection to the Graphiant Core flapped
Orange: Backup connection to the Graphiant Core flapped
.png)
Should there be any down transitions within the time selected for data retrieval, it will appear as in the below example.
Hover the mouse over the graph to see which core was affected.
.png)
QoE
The QoE (Quality of Experience) is reflected here. The QoE is based on a 10-point scale, reflecting the performance for any traffic on the link(s) between the Edge and Core.
Hover the mouse over the color bar to see the QoE health at any given moment, where:
Green = Healthy
Yellow = Impaired
Red = Critical
.png)
Data: Loss Value
The measure of data loss is viewed through this graph.
Hover the mouse over the desired time to see the amount of data loss at any given moment.
.png)
Latency and Jitter
The measure of both latency and jitter (both in ms) are viewed through this graph.
Hover the mouse over the desired time to see the amount of latency / jitter at any given moment.
.png)
Control Plane
The control plane tab shows information about the connections to the Edge with regards to both Portal and Control data.
From the Issues (or other) tab, click the 'Control Plane' tab.
.png)
The control plane information will populate.
.png)
Note:
The graphs on this page are autoscaling, to accommodate any data that may appear.
The page is broken down into two sections:
Portal: Down Transitions
Control: Down Transitions
Portal: Down Transitions
This graph shows if there have been any instances of a connection loss to the Graphiant Portal.
The number of transitions is measured in integers, with the color representation of:
Blue: Active connection to the Graphiant Portal flapped.
Orange: Backup connection to the Graphiant Portal flapped.
.png)
Should there be any down transitions within the time selected for data retrieval, it will appear as in the below example.
Hover the mouse over the graph to see which tunnel was affected.
.png)
Control: Down Transitions
This graph shows if there have been any instances of a connection loss to a Graphiant Routing Server.
The number of transitions is measured in integers, with the color representation of:
Blue: Active connection to a Graphiant Routing Server flapped
Orange: Backup connection to a Graphiant Routing Server flapped
.png)
Should there be any down transitions within the time selected for data retrieval, it will appear as in the below example.
Hover the mouse over the graph to see which Graphiant Routing Server was affected.
.png)
System
The system tab shows the status of, and information about, the system resources of the Edge.
From the Issues (or other) tab, click the 'System' tab.
.png)
The system information will populate.
.png)
The page is broken down into two sections:
Stats
System Details
Stats
This graph gives percentage utilized on the following three items:
CPU
Memory
Disk
Hover the mouse over the desired time to see the percentage utilized at any given moment.
.png)
Should a situation arise where the temperature is overheating, the graph would show a red bar denoting the overheating event, as in the example below:
.png)
Note:
The graph on this page is autoscaling, to accommodate any data that may appear.
System Details
This information contains the following:
Up Time: How long the Edge has been up
Last Reboot Reason: The reason for the most recent reboot
Crashes (last 24 hours): If any crashes occurred in the last 24 hours, they would be noted here.
.png)