How do Graphiant Alarms and Notifications work Together?
Graphiant Alarms give you the ability to set Notifications that matter the most for your network.
When an event occurs that triggers the alarm, an alert email promptly highlights the issue and brings it to your attention quickly.
Detailed information describes the event, and a URL links you to Graphiant's Alarms page, showing any active alarms.
From the Alarms page, you are able to select Troubleshoot, which takes you to the plane of the network where the alarm was generated; from there you can quickly see the event and implement the best remediation.
Locating Alarms in the Graphiant Portal
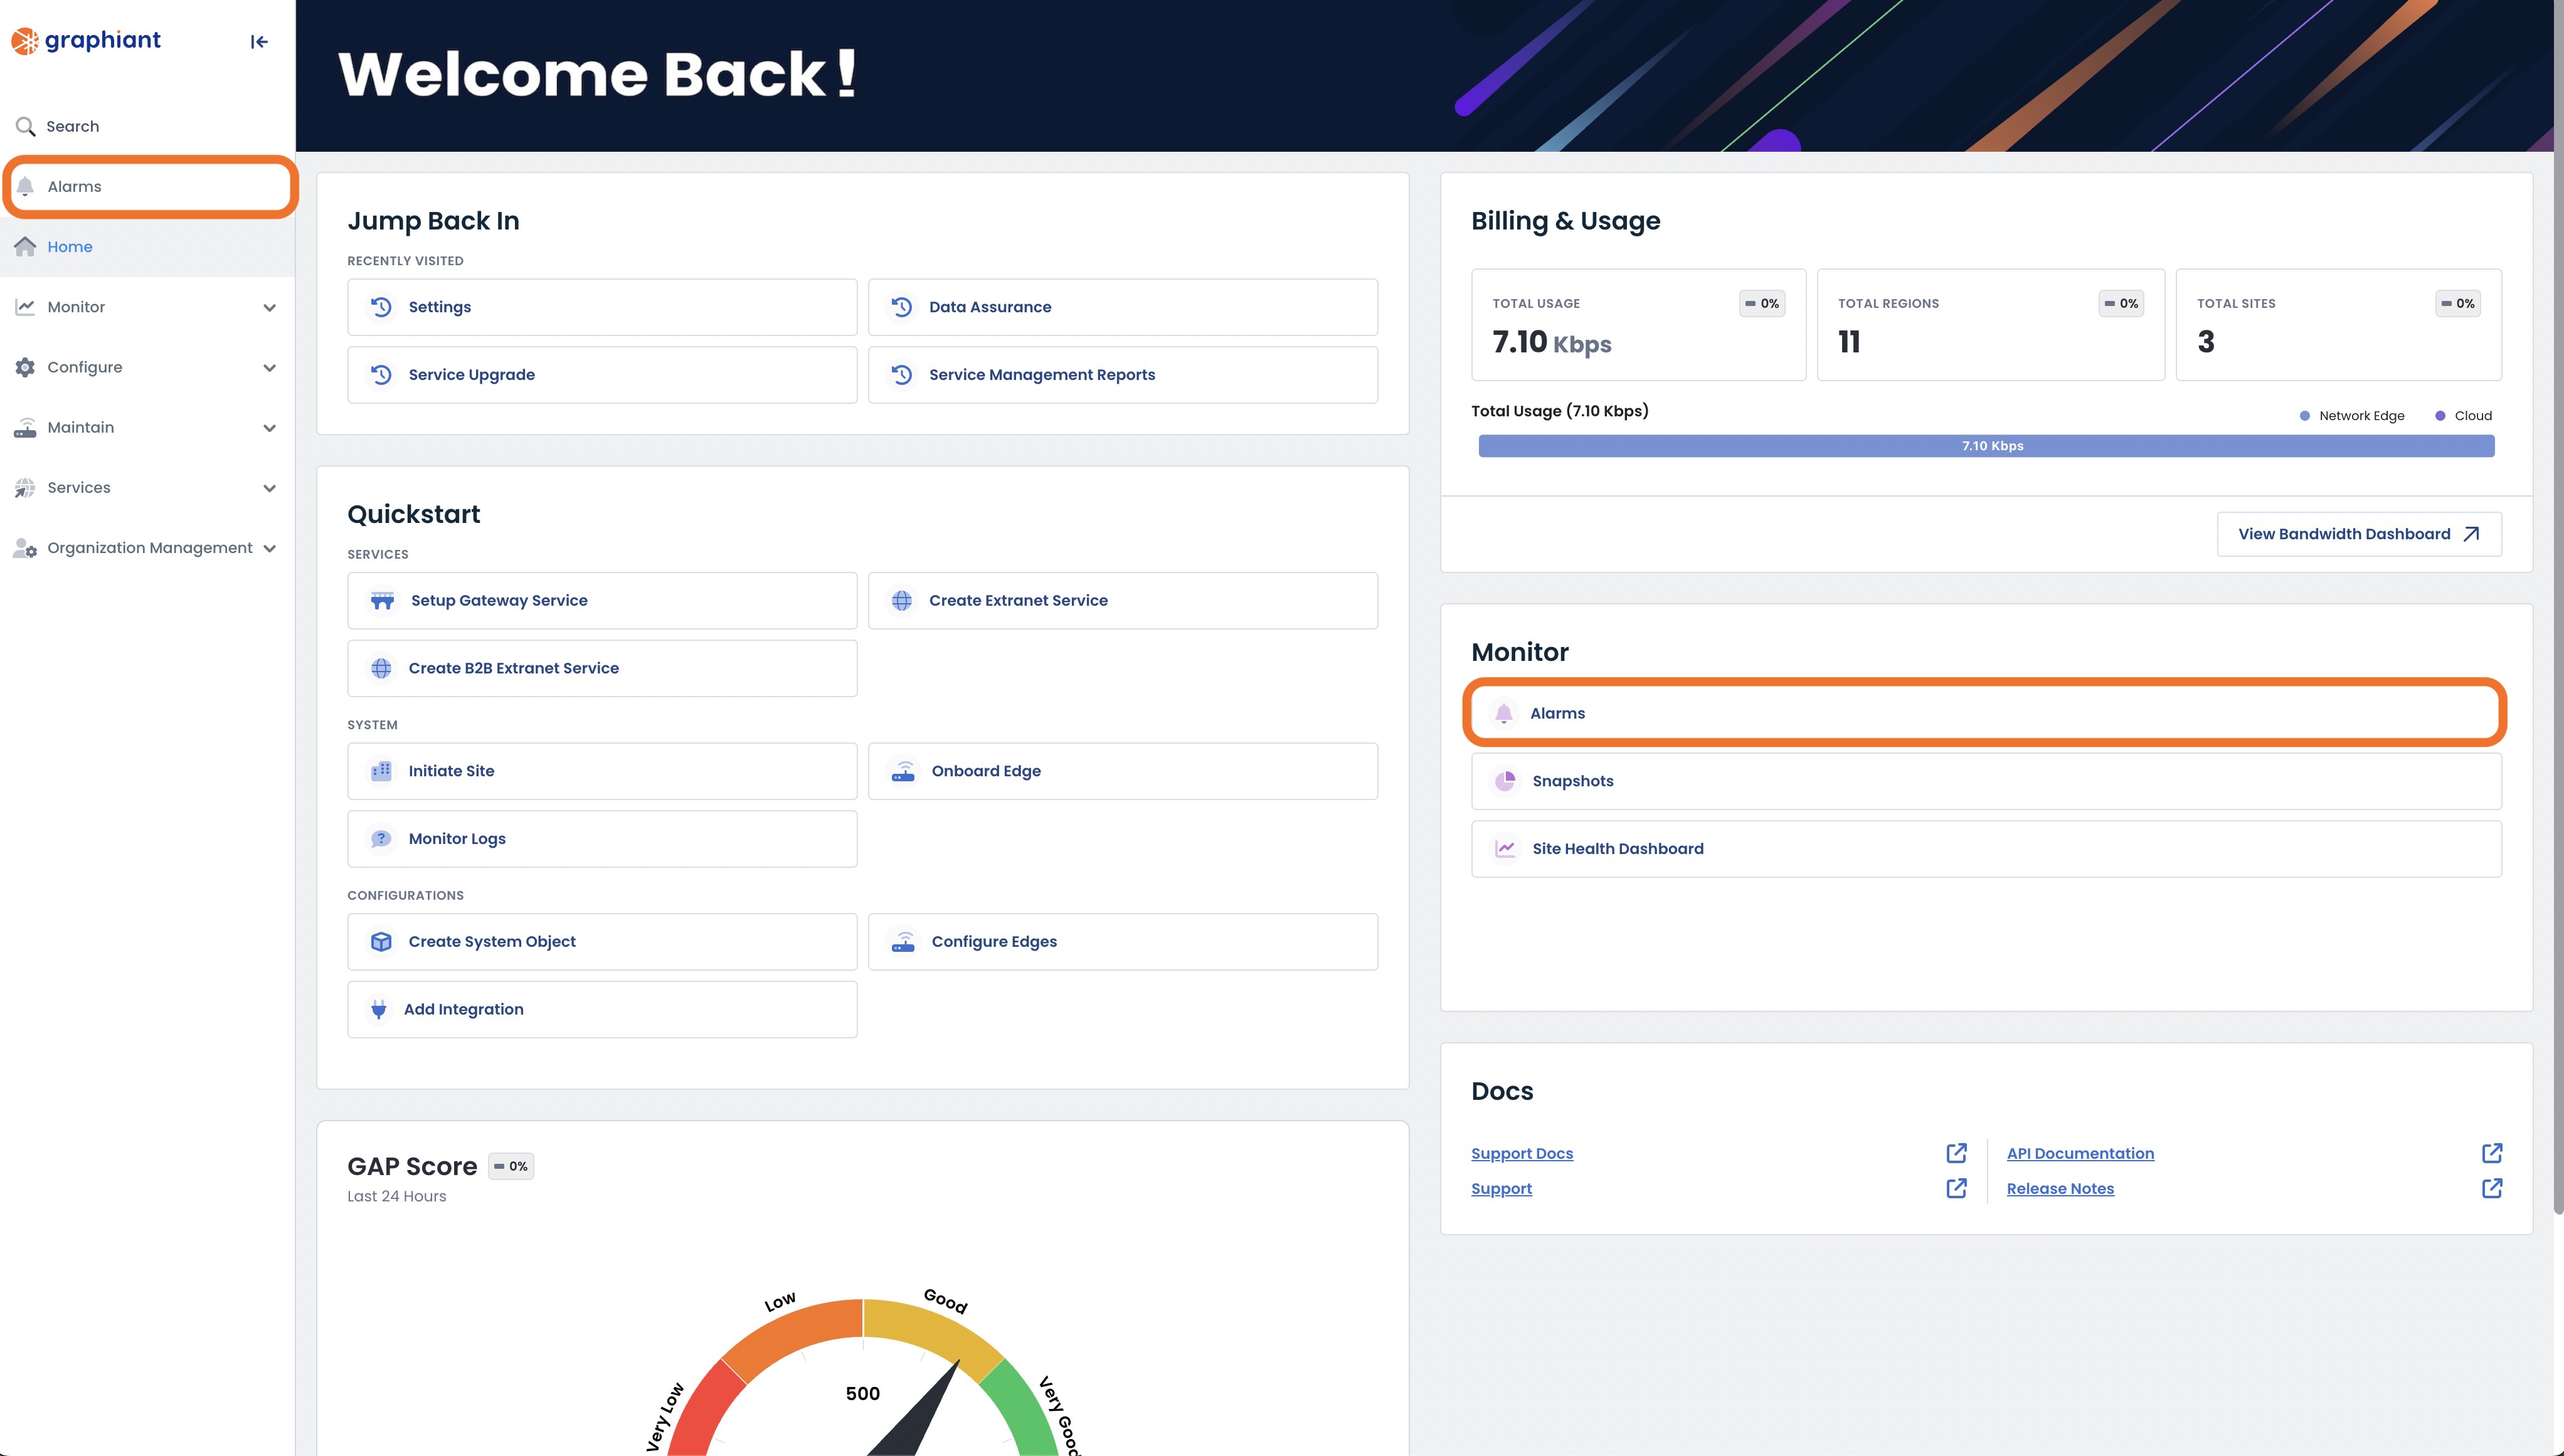
From the Home page in the Graphiant Portal, you can reach the Alarms page one of 2 ways:
Locate the "Monitor" section on the right; select 'Alarms'.
OR
Click 'Alarms' in the sidebar.
This brings up the Alarms landing page, which houses all of the information regarding the alarms for the entire network.
.png)
Navigating the Alarms Page
'Alarms' Tab
The page automatically lands on the information under the 'Alarms' tab.
.png)
The page is laid out in five sections:
Time Picker (top, to the right of menu tabs): Length of time taken into account when pulling alarm data.
Status Bar (uppermost right corner): Each Status tab here will determine the information shown on the entirety of the page.
Donut Chart (upper left): Represents total alarms for the selected Status, including the number of each severity.
Alerted Planes (upper right): Indicates in which planes the alarms are found for the selected Status.
All Alarms (bottom): All alarms contained in the selected Status.
Time Picker
By default, "Past day" is selected as the period of time during which the alarms will be pulled for the Alarms information.
Select the desired timeframe to include Alarm data, between 5 minutes and the past month.
.png)
Should a custom timeframe be desired, click 'Custom Range'.
.png)
This will open a custom calendar allowing dates and times to be selected, down to the exact second desired.
Enter the desired information.
Click 'Apply'.
The page will adjust instantly when each field is chosen.
.png)
'Clear' will revert the custom calendar to the current date, where you can customize again if desired.
.png)
'Reset Custom' will revert the Time Picker to the original default setting of "Past 15 minutes".
.png)
To edit the custom timeframe, click anywhere in the date / time field and the calendar will reappear.
.png)
Status Bar
The Status bar contains four selections to choose from for ease of seeing the desired information on the Alarms page:
.png)
Active: All current alarms that have not been mitigated and cleared.
Recovered: All alarms that have been mitigated and cleared.
Acknowledged: All alarms that have been assigned to an individual to recover; these are independent of the alarm's current state of Active, Recovered, or Inactive.
Inactive: Alarms can be considered Inactive for either of the following reasons:
No longer seeing the issue, but not yet cleared. Consider the following example: Alarm was triggered due to a CPU spike of 95; CPU is no longer at 95 but needs to be below 80 before it is cleared.
Alarm has been disabled.
Alarms Donut Chart
This represents all alarms included in the selected Status.
Alarm severity and corresponding colors are as follows:
Critical: Red
High: Orange
Medium: Yellow
Low: Green
Hovering over any section of the donut chart will provide a quick look at the number of alarms that are included in that severity.
The number of alarms present in each severity is tallied to the right.
.png)
Alerted Planes
The alarms for the selected Status will be distributed here by the plane in which they are occurring.
Hovering over a section of the bar graph will provide a quick look at the number of alarms that are included in that severity.
The planes are itemized out as follows:
System: Related to platform / hardware-related parameters
Control: Related to connectivity from the Edge to the Graphiant infrastructure that provides configuration and routing information.
Data: Related to connectivity to the Graphiant backbone.
Analytical: Inferred from the data gathered from the other three planes.
.png)
All Alarms
The bottom of the page includes a table of every alarm that fits the selected Status in the Status bar.
The table provides the following information:
Severity: The assigned level of the alarm; Critical, High, Medium or Low.
Entity: The item on which the alarm is occurring; i.e. site, device, interface etc.
Alarm Type: The rule or issue that is initiating the alarm.
Reason: The cause of the issue that is occurring.
Recommendation: The suggested fix to remediate the issue.
First Seen: Date and time of the initial occurrence of the issue.
Occurrence: Number of times the event has occurred that would trigger the alarm.
Plane: In which plane the issue occurred; Data, Control, or System.
Status: Current status of the alarm: Active, Recovered, or Inactive.
Last Seen: Date and time of the most recent occurrence of the issue.
Acknowledged By: Admin who has acknowledged the alarm and is working on the issue.
The Search bar will find a match within any of the fields of the table.
.png)
Note:
The entities for an alarm are hierarchical; if an alarm is created for the site, everything included in that site will also include that alarm - i.e. the Edge devices and interfaces, for example.
Should an alarm for the same issue appear in multiple sites, a caret will be present to the left of that alarm to indicate that more information is nested below.
This consolidates the information for all of the sites that are exhibiting this behavior, so as to not cause alarm fatigue.
To see the list of sites experiencing the issue, click the caret.
.png)
This will open the list of sites that are affected by this Alarm.
This table includes the same fields as the Alarm Table.
.png)
Each alarm can be manipulated with tools found by clicking the 3 dots to the right of the alarm.
.png)
Create Notification
Notifications about Active Alarms can be sent to a user for quick action to be taken.
From the 3 dots, click 'Create Notification'.
This will open the screen to configure a notification of the desired alarm.
For instructions on creating a notification, click here.
.png)
Note:
Should a notification already exist but be muted, there will instead be an option that will read 'Unmute Notification'. For instructions on muting/unmuting a notification, click here.
Acknowledge Alarm
From the 3 dots, click 'Acknowledge Alarm'.
This will open the screen to acknowledge the desired alarm.
.png)
Freeform enter the reason for the acknowledgement of the alarm.
Click 'Save'.
.png)
Note:
Once an alarm is acknowledged it, and all of its associated alarms, are marked as Inactive.
Troubleshoot
Troubleshooting allows the user to quickly see the network details to remediate an alarm.
From the 3 dots, click 'Troubleshoot'.
.png)
This opens the Site Health Dashboard, in the plane for which the alarm is occurring.
In this example, the CPU memory was nearing capacity so the Dashboard is open to the System Plane, where hovering the mouse at any given timestamp will show the corresponding memory utilization.
.png)
For more information on navigating the Site Health Dashboard, click here.
Disabling an Alarm
If an alarm is alerting, and for any reason is desired to not be alerting -- for example due to it being a non-issue for the particular network, or a known adjustment that has a future update set -- that alarm can be disabled.
Should an alarm need to be disabled, however temporary, click the 3 dots; click 'Disable Alarm'.
.png)
Note:
Should the alarm already be disabled, there will instead be an option that will read 'Enable Alarm'.
This will bring up a confirmation modal for disabling the alarm.
Notes (optional): Enter information as to why the alarm is being disabled, so that other users will have the detail.
Click 'Confirm'.
.png)
As it is not being triggered the alarm will no longer appear in the All-Alarms table; it will move to the Inactive Alarms table.
Disabled Alarm Details
The detail of the disabled alarm can now be found in the Rules tab of the Alarms page.
For more information about Rules, click here.
.png)
From here, you can view the details of any device that has disabled the alarm associated with that rule.
Click on the number value of Excluded Entities for the desired rule.
.png)
Excluded Entities are any item which is not receiving the alarm, i.e. site, device, interface etc.
Note:
The entities for an alarm are hierarchical; if an alarm is disabled for the site, everything included in that site will also have that alarm disabled - i.e. the Edge devices and interfaces, for example.
The Excluded Entities table includes the following:
Enterprise: Company name
Device: Name of the device which has had the alarm disabled
Device interface: Interface attached to the device (if there is one)
Peer: BGP peer of the device (if it has one)
Peer interface: Interface attached to the BPG peer (if it has one)
Notes: The text entered in the 'Notes' field upon disabling of the alarm
.png)
Re-enabling an Alarm
An alarm can be re-enabled from either the Excluded Entities table, or the Inactive Alarms table.
Re-enabling an Alarm from the Excluded Entities Table
Check the box of the desired device to which the alarm will be re-enabled.
.png)
Note:
Should there be multiple excluded entities, as many devices as desired can be selected to be re-enabled .
Once checked, a 'Re-enable' button will appear at the top of the table.
Click 'Re-enable'.
.png)
Once a device has had an alarm for a rule re-enabled, the device will no longer appear in Excluded Entities for that rule.
.png)
The alarm will now be able to be triggered.
Re-enabling an Alarm from the Inactive Alarms Table
From the Alarms Page, select the 'Inactive' tab.
.png)
Click the 3 dots to the right of the alarm to be re-enabled.
Select 'Enable Alarm'.
.png)
A Confirmation screen will appear.
Click 'Confirm' to re-enable the alarm.
.png)
Once an inactive alarm has been re-enabled, it will no longe appear in the Inactive Alarms.
.png)
The alarm will now be able to be triggered.
'Notification Management' Tab
Notifications of alarms can be a vital tool in the immediate remediation of an issue.
Alarms are always visible in the Portal on the Alarms screen. For proactive alerting of an issue, notifications can be set up for individual or groups of alarms if desired.
Instead of checking the network periodically, a notification brings instant attention to a behavior that could be problematic for a network.
Notifications can be set up for any alarm(s) and forwarded to an email of your choice.
To reach the alarm notifications, from the Alarm landing page, click 'Notification Management'.
.png)
This brings up the Notification Management page.
.png)
The page is laid out in two sections:
Visual Donut Chart (top): Represents number of times any notification has been triggered across the network.
All Notifications Chart (bottom): All notifications that have been created, listed by name.
Notifications Donut Chart
This represents all notifications that have been sent across the network.
Hovering over any section of the Donut chart will provide a quick look at the name of the notification that has been sent, along with the number of times the notification was triggered.
The number of times each notification was triggered is tallied to the right.
.png)
All Notifications
The bottom of the page includes a table of every notification that has been created.
.png)
The table provides the following information:
Notification Name: User-assigned name for the notification.
Alarm Type: Name of the alarm for which the notification will be sent.
Suppress After: The number of times for the notification to be sent regarding an Active alarm before notification will stop for that alarm.
Evaluation Window: The window of time monitored.
Times Triggered: The number times a notification was triggered and sent for the alarm, in accordance with the configuration of each notification.
Recipients: Email of the user(s) to receive the notifications
Enabled: Whether the notification is enabled/disabled.
Paths to Creating Notifications
There are two ways to open the screen to configure a notification:
#1: Alarms Page
From the Alarms page, click the three dots to the right of the alarm for which the notification will alert.
Select 'Create Notification'.
.png)
This will bring up the Notification configuration screen.
#2: Notification Management Page
From the Notification Management page, click 'Add Notification'.
.png)
This will bring up the Notification Configuration screen.
.png)
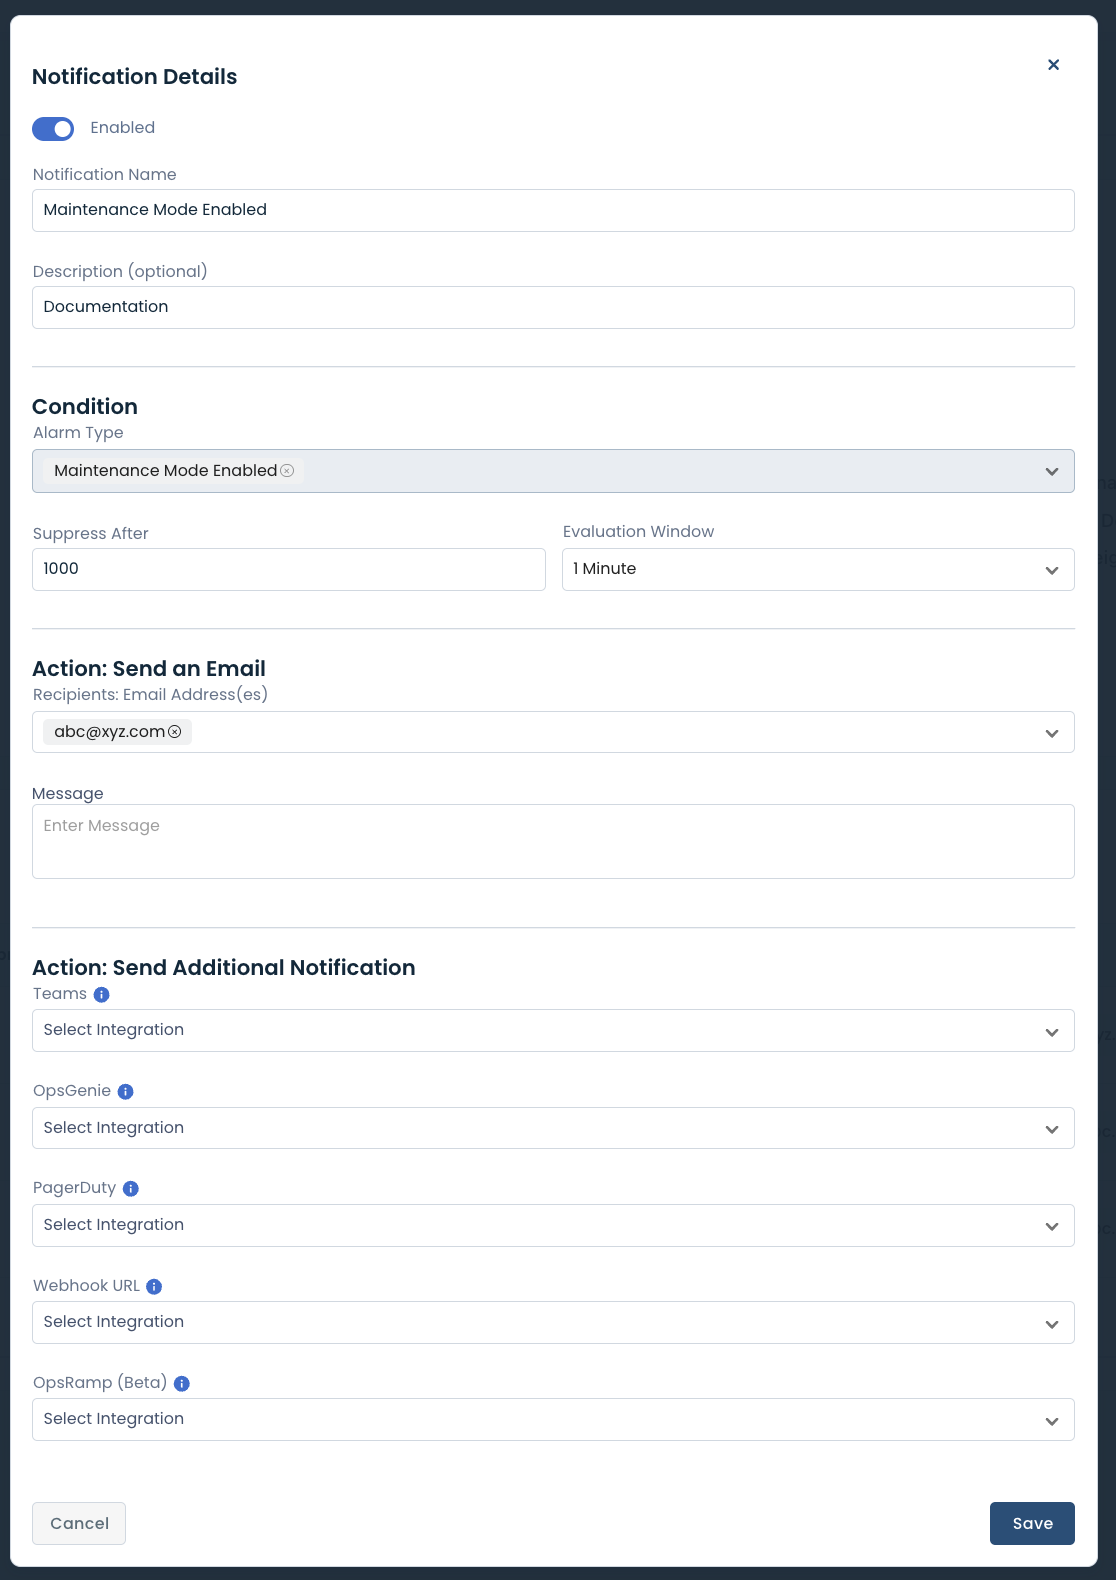
Configuring Notifications
Complete the following fields:
Notification Details
Enabled: When checked, the notification is enabled. Uncheck to disable.
Notification Name: Desired word/phrase that will show as the title of the notification.
Description (optional): Desired internal description of the notification.
Condition
Alarm Type: Select the desired alarm rule(s) for which to be alerted from the drop-down. As many alarms can be selected as desired.
Note:
If this modal was reached via an alarm directly, this field will be pre-populated with that alarm. As many other alarms can be added as desired.
Suppress After: Enter the desired number of times for the notification to be sent regarding an Active alarm, before notifications will stop for that alarm.
Evaluation Window: From the drop-down, select the window of time to be monitored before sending notifications; i.e. every 5 minutes, every 2 days. If the alarm was triggered during this timeframe, a notification will be sent.
Action: Send an Email
Recipients: Email Address(es): Enter the email of the person(s) to receive the alarm notifications.
Message: Free form field for any message to accompany the information in the alarm notification email.
Action: Send Additional Notification
Alarm Notifications can additionally be sent through Microsoft Teams, Atlassian OpsGenie, PagerDuty, and OpsRamp.
Should these notifications be helpful, fill out any of the following fields:
Teams: From the drop-down, select the desired integration.
If no Microsoft Teams integration has been set up with Graphiant, click 'Create New +' and the screen will take you directly to the page where that can be configured. For instructions on configuring Teams Integration, click here.
OpsGenie: From the drop-down, select the desired integration.
If no OpsGenie integration has been set up with Graphiant, click 'Create New +' and the screen will take you directly to the page where that can be configured. For instructions on configuring OpsGenie Integration, click here.
PagerDuty: From the drop-down, select the desired integration.
If no PagerDuty integration has been set up with Graphiant, click 'Create New +' and the screen will take you directly to the page where that can be configured. For instructions on configuring PagerDuty Integration, click here.
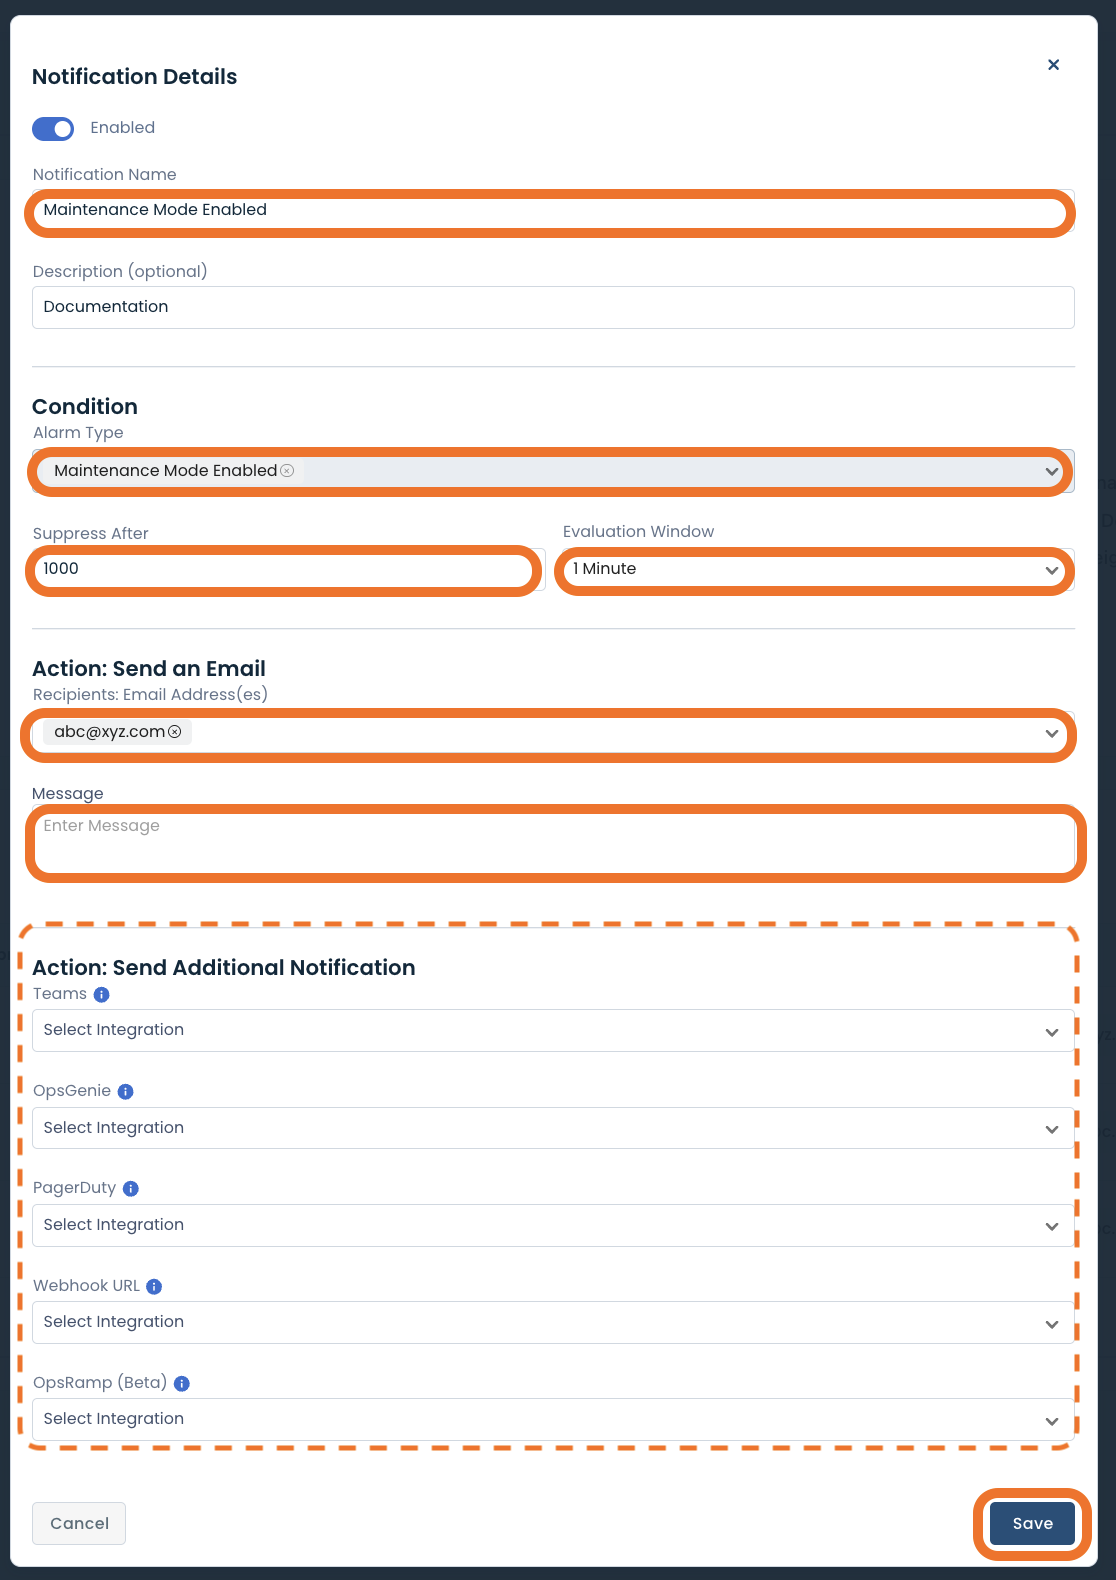
Click 'Save'.
The new notification is now in the Notifications Table.
.png)
Configuring Additional Notification Integrations
Graphiant integrates directly with Microsoft Teams , Atlassian OpsGenie, OpsRamp, and PagerDuty for additional alarm notifications, as well as offering a generic webhook for any other application you need.
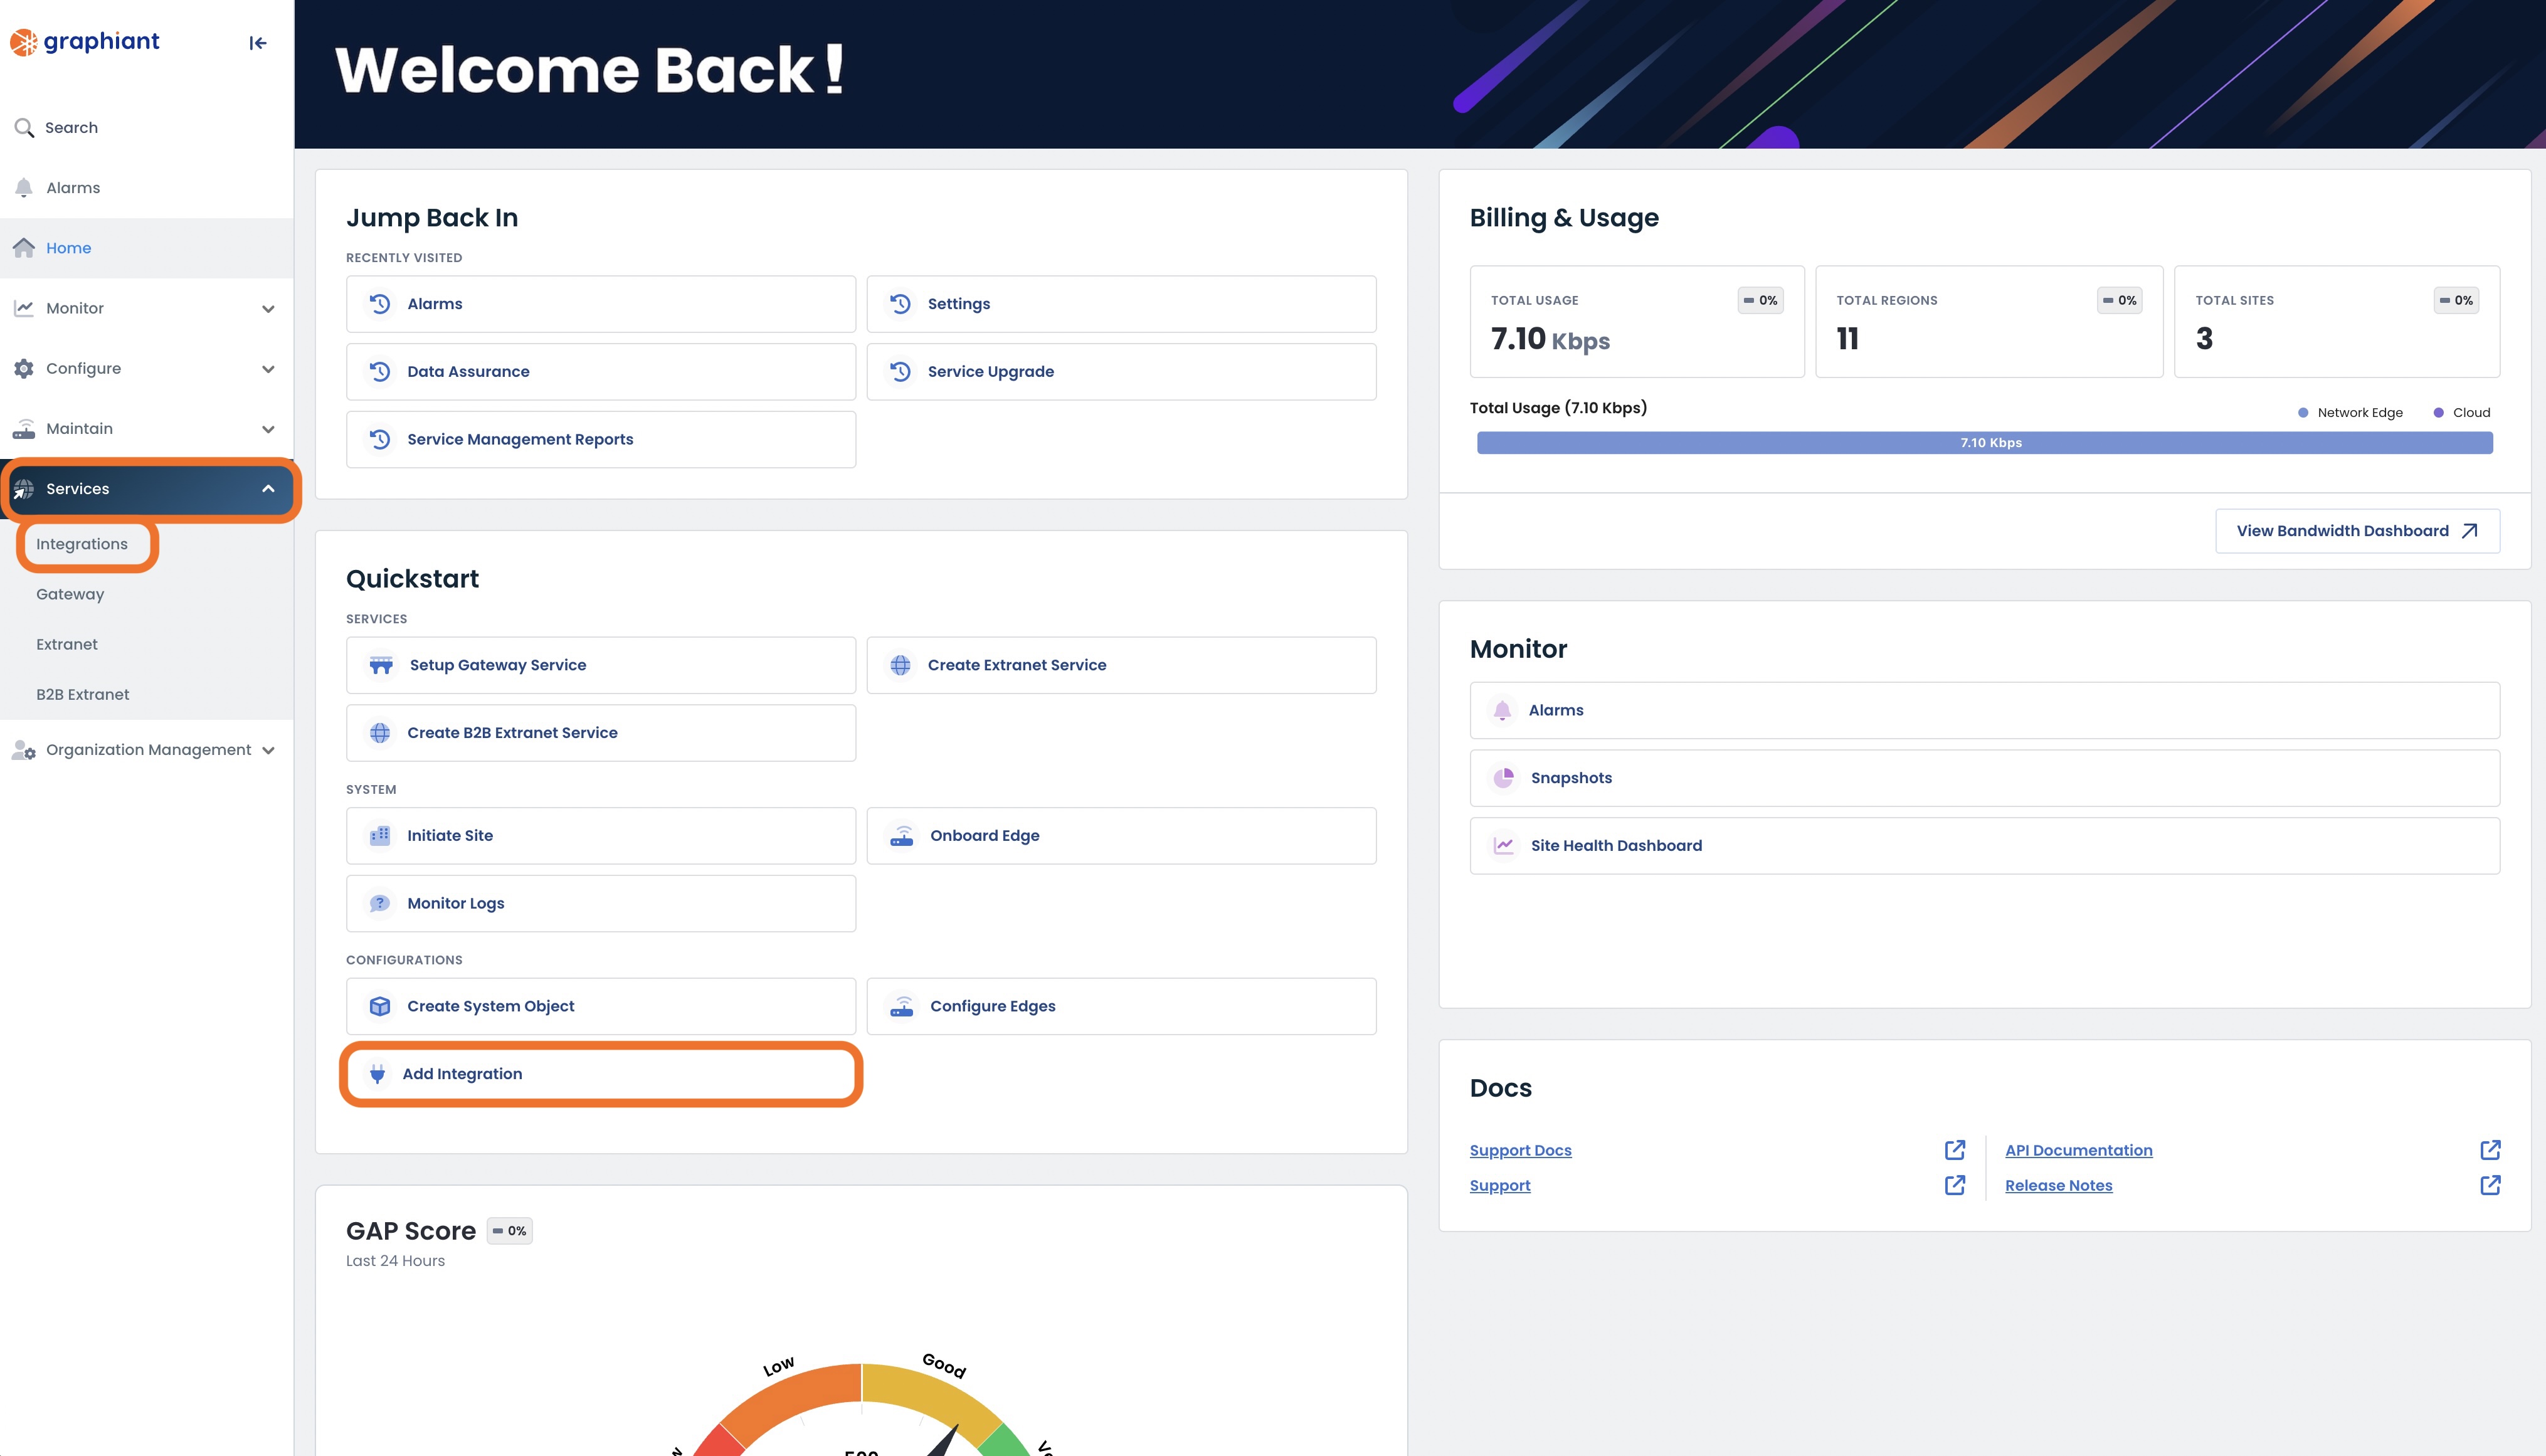
From the Home page in the Graphiant Portal, you can reach the Integrations page one of 2 ways:
Locate the "Quickstart" section on the left; select 'Add Integration'.
OR
Click 'Services' in the sidebar; select ‘Integrations’.
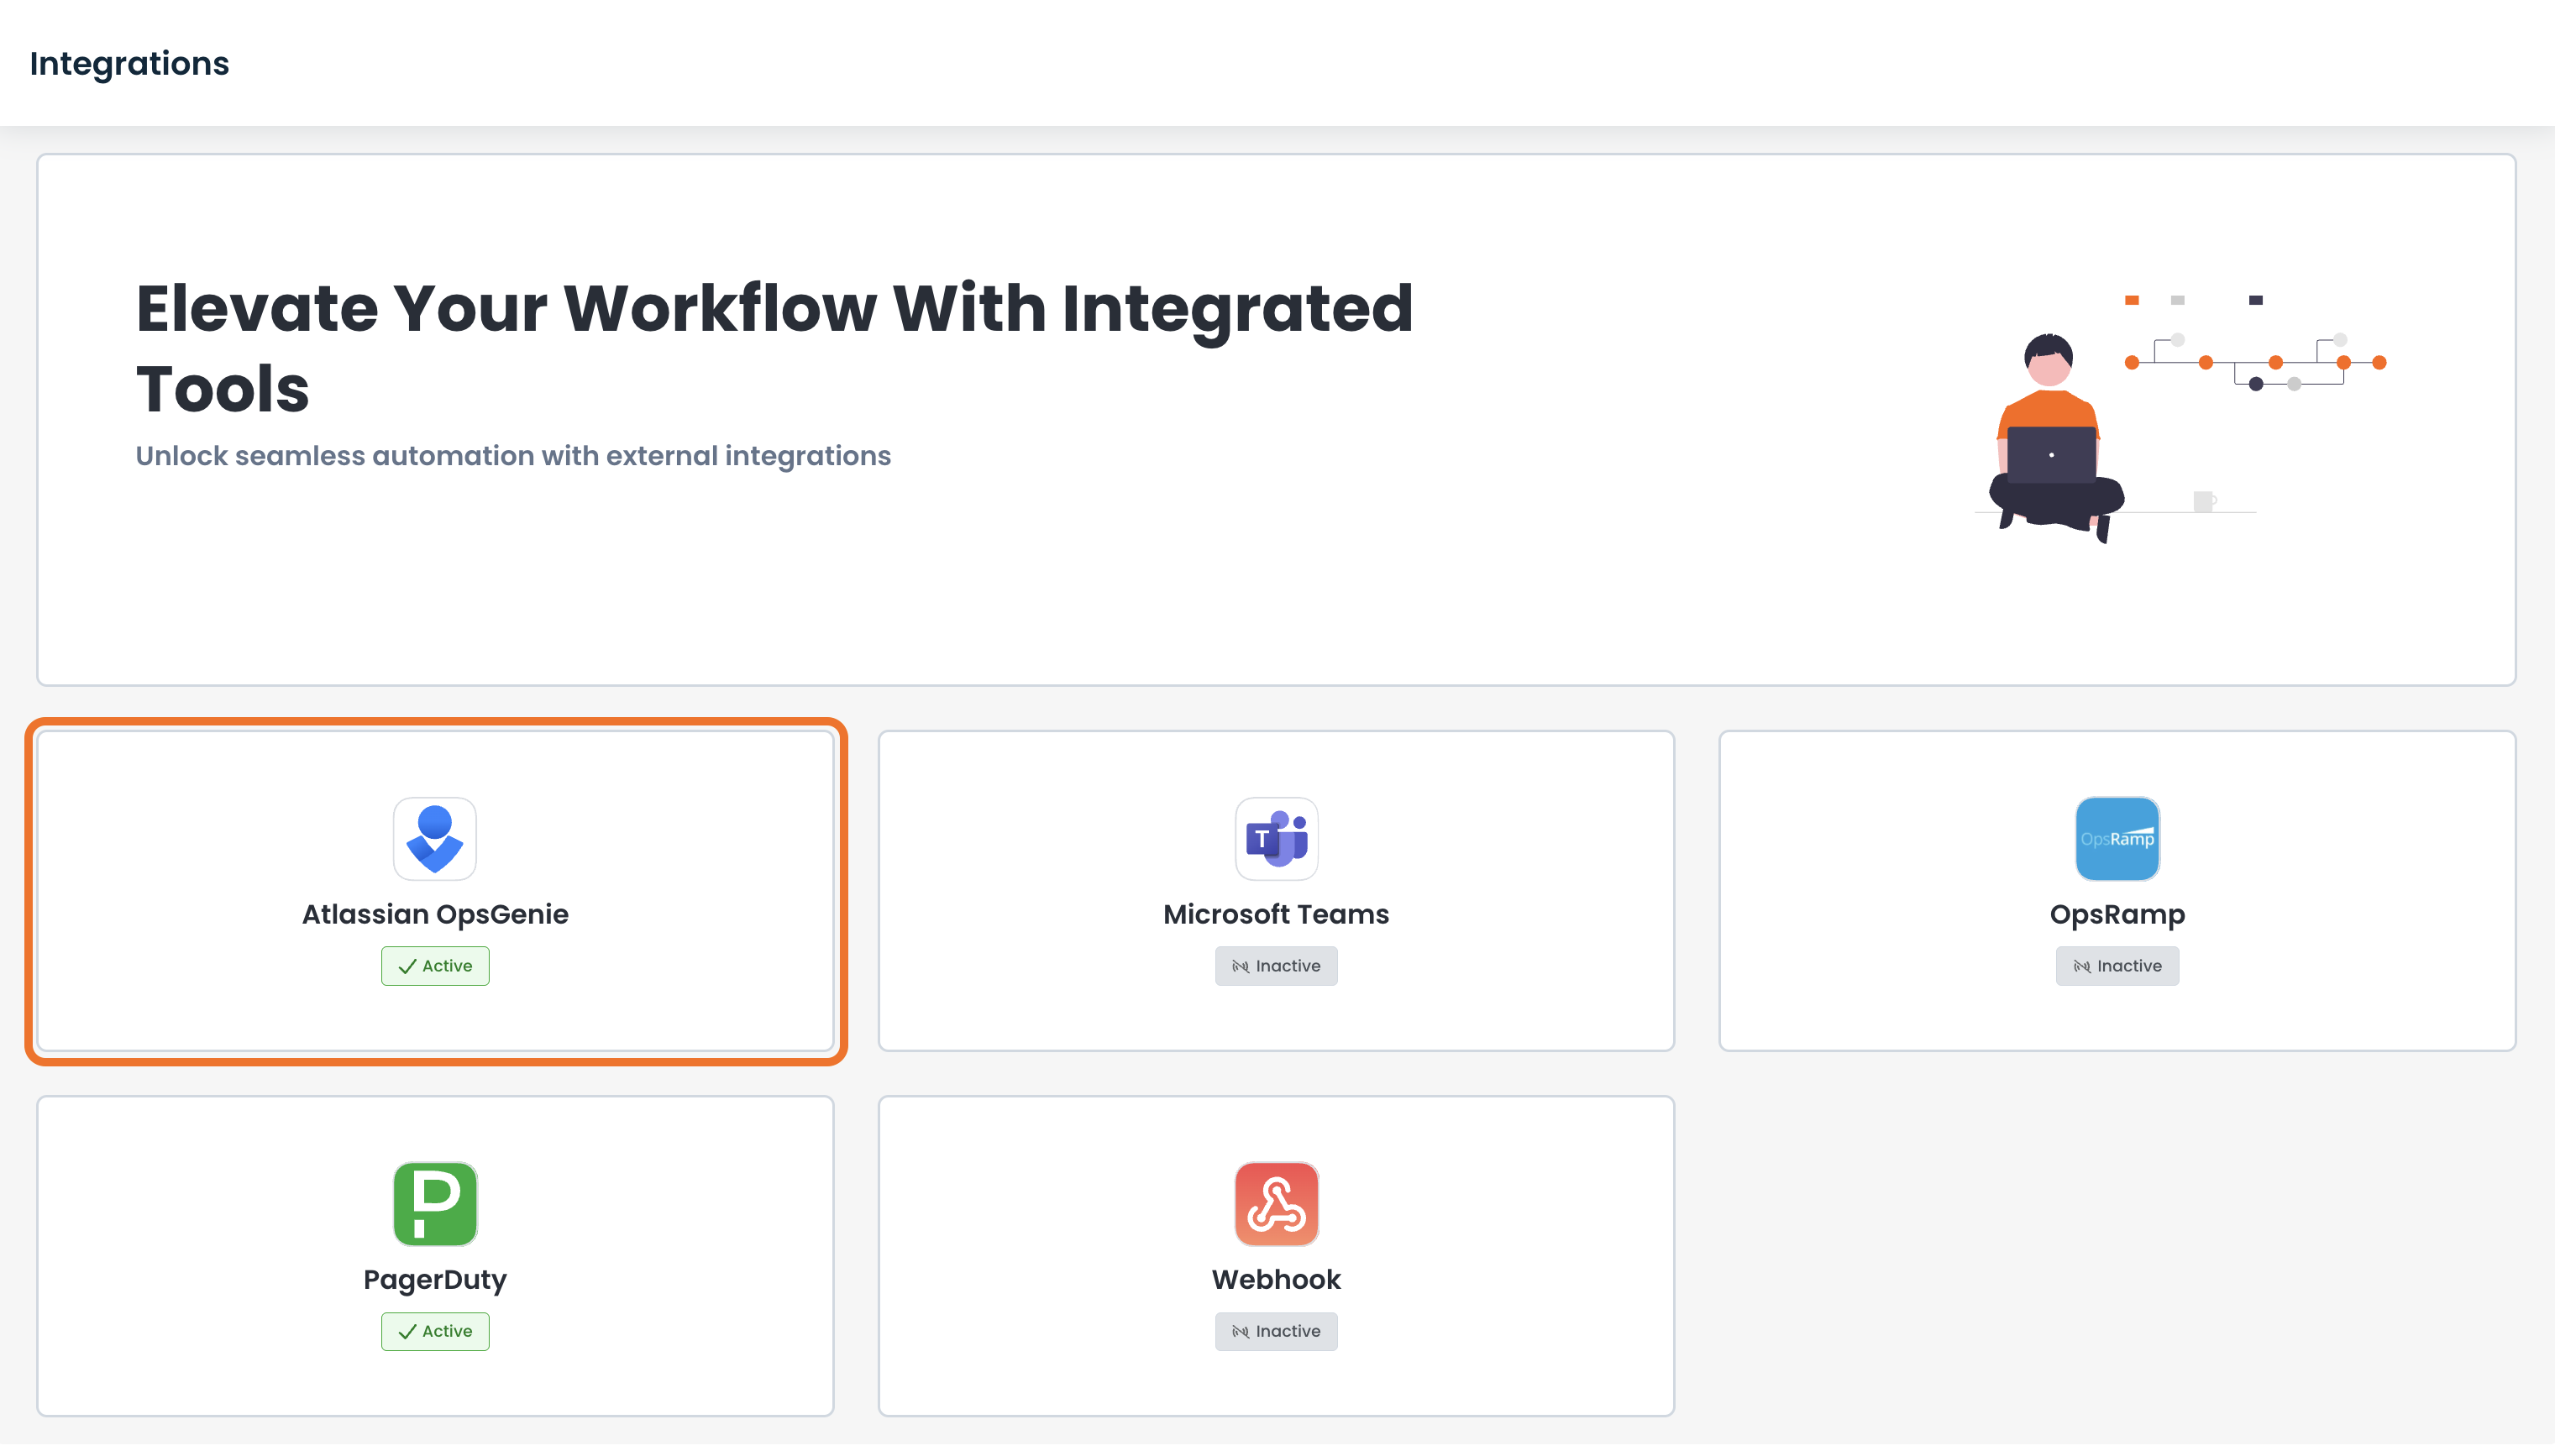
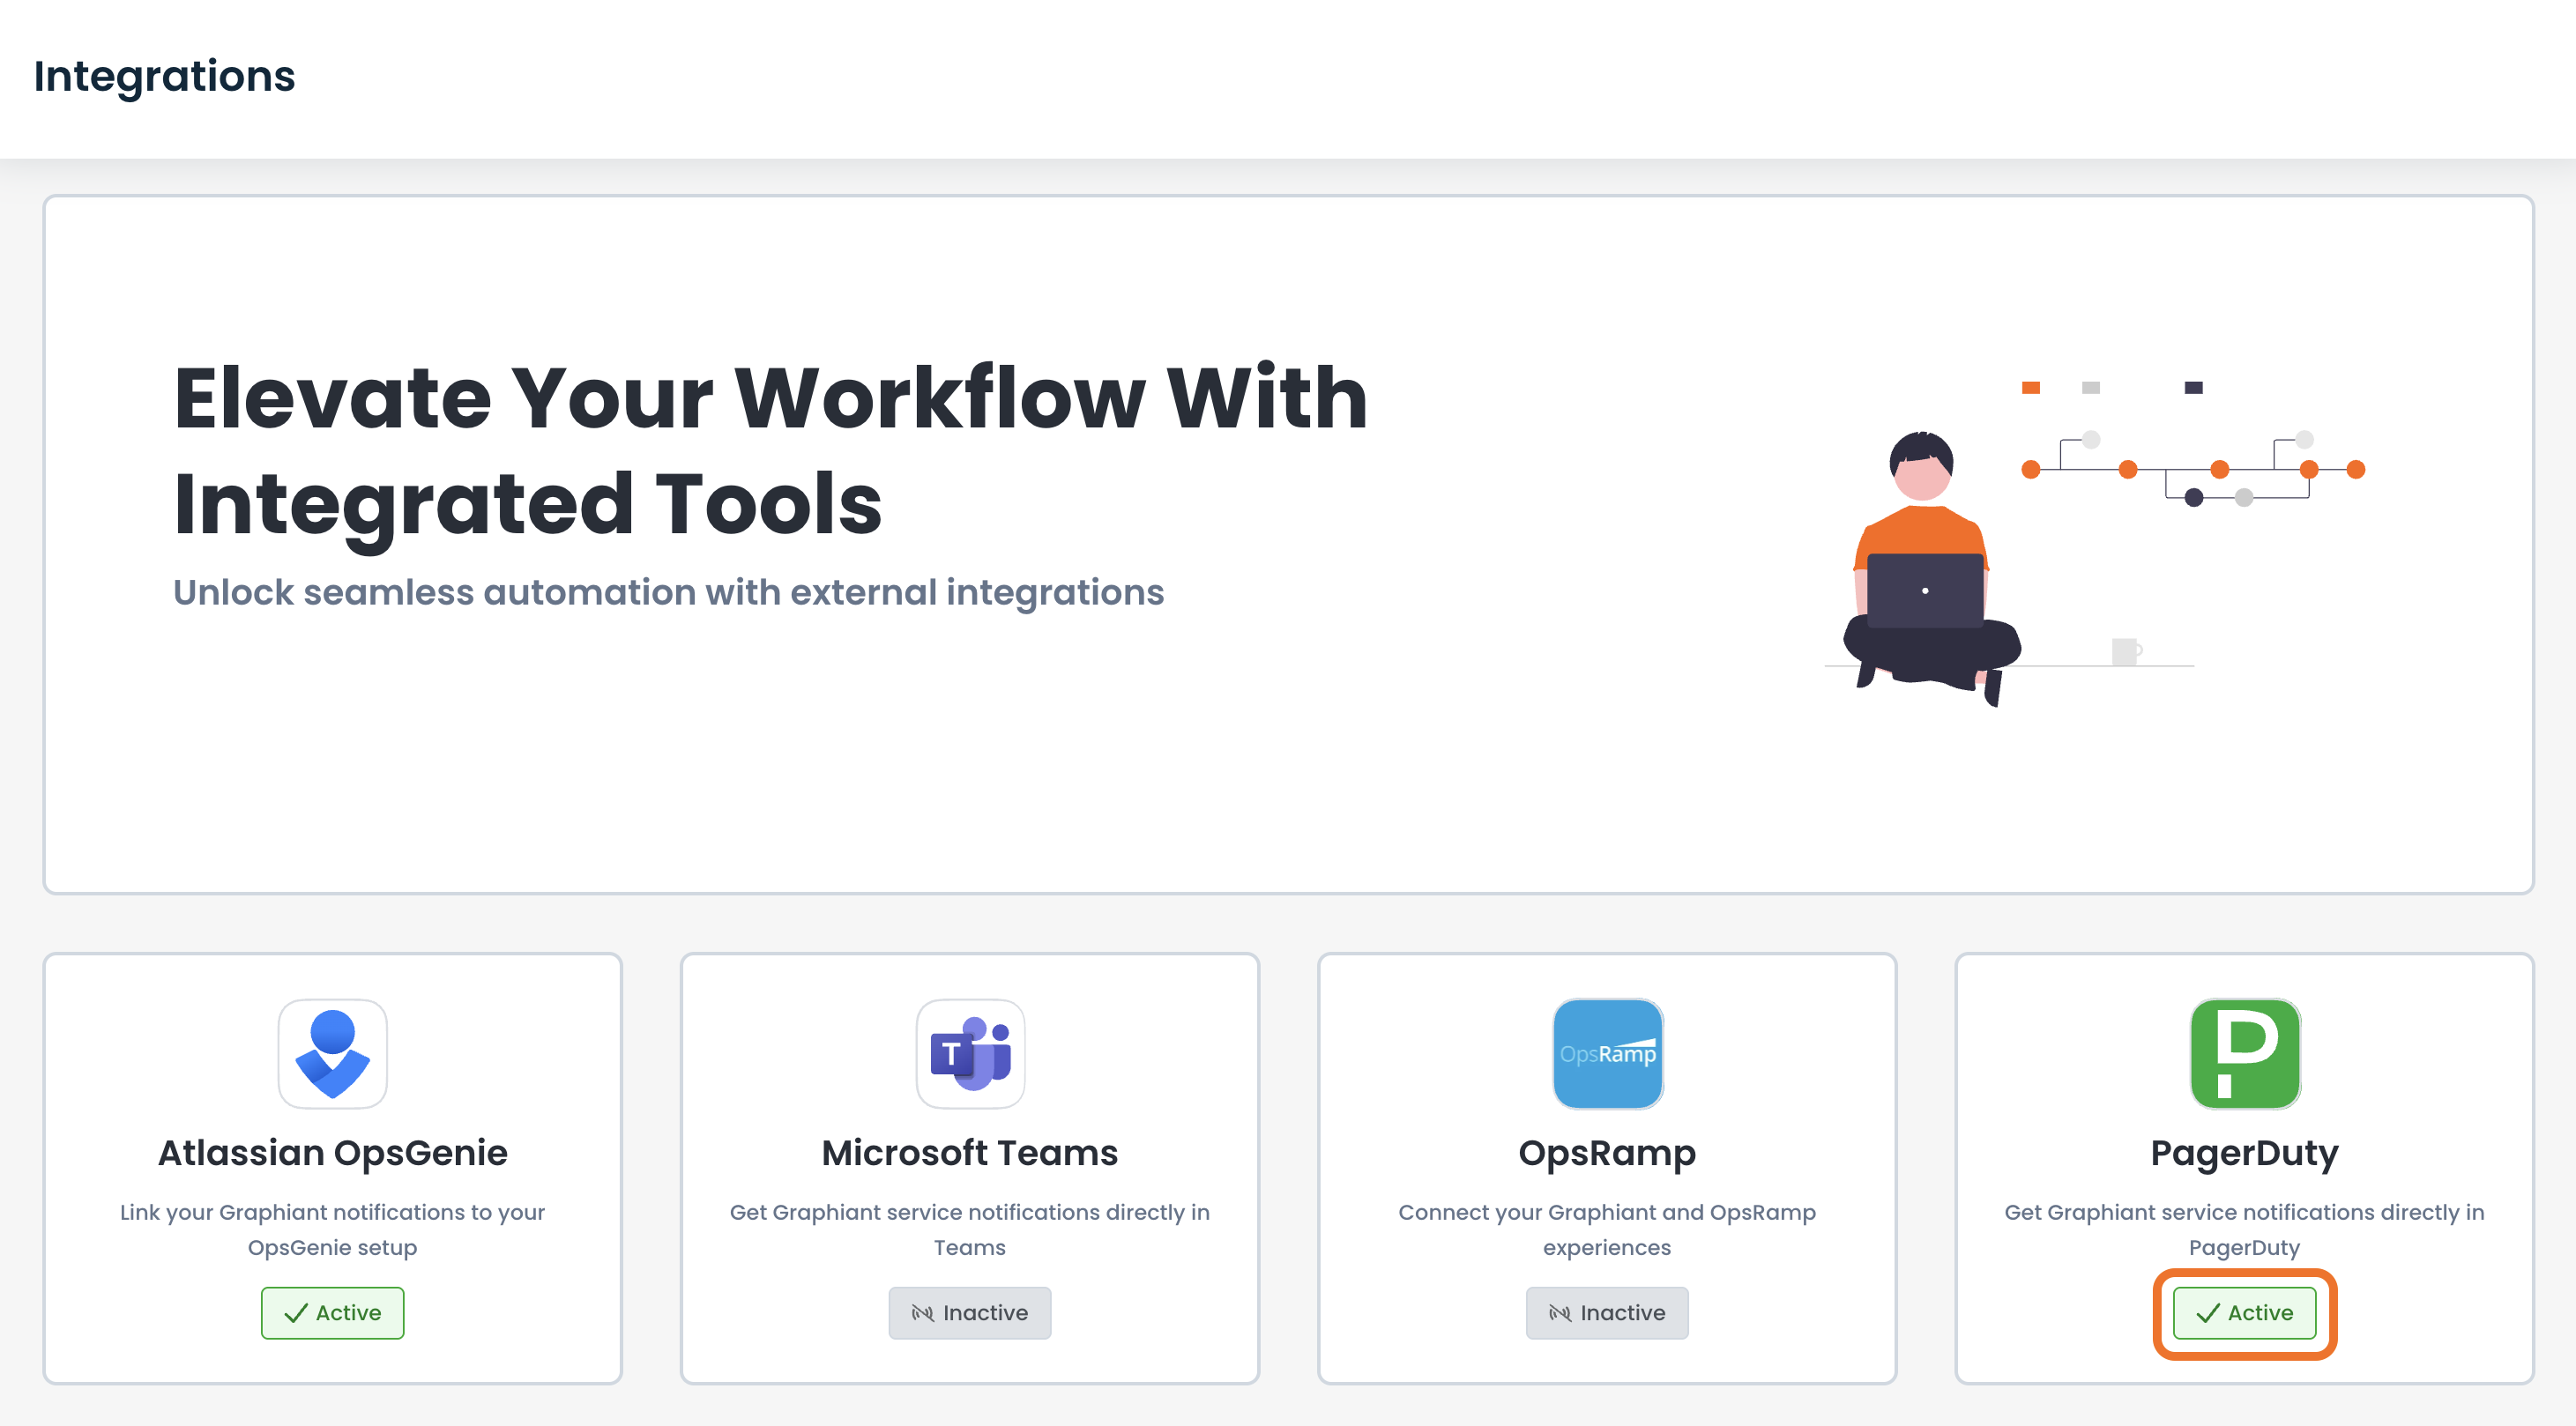
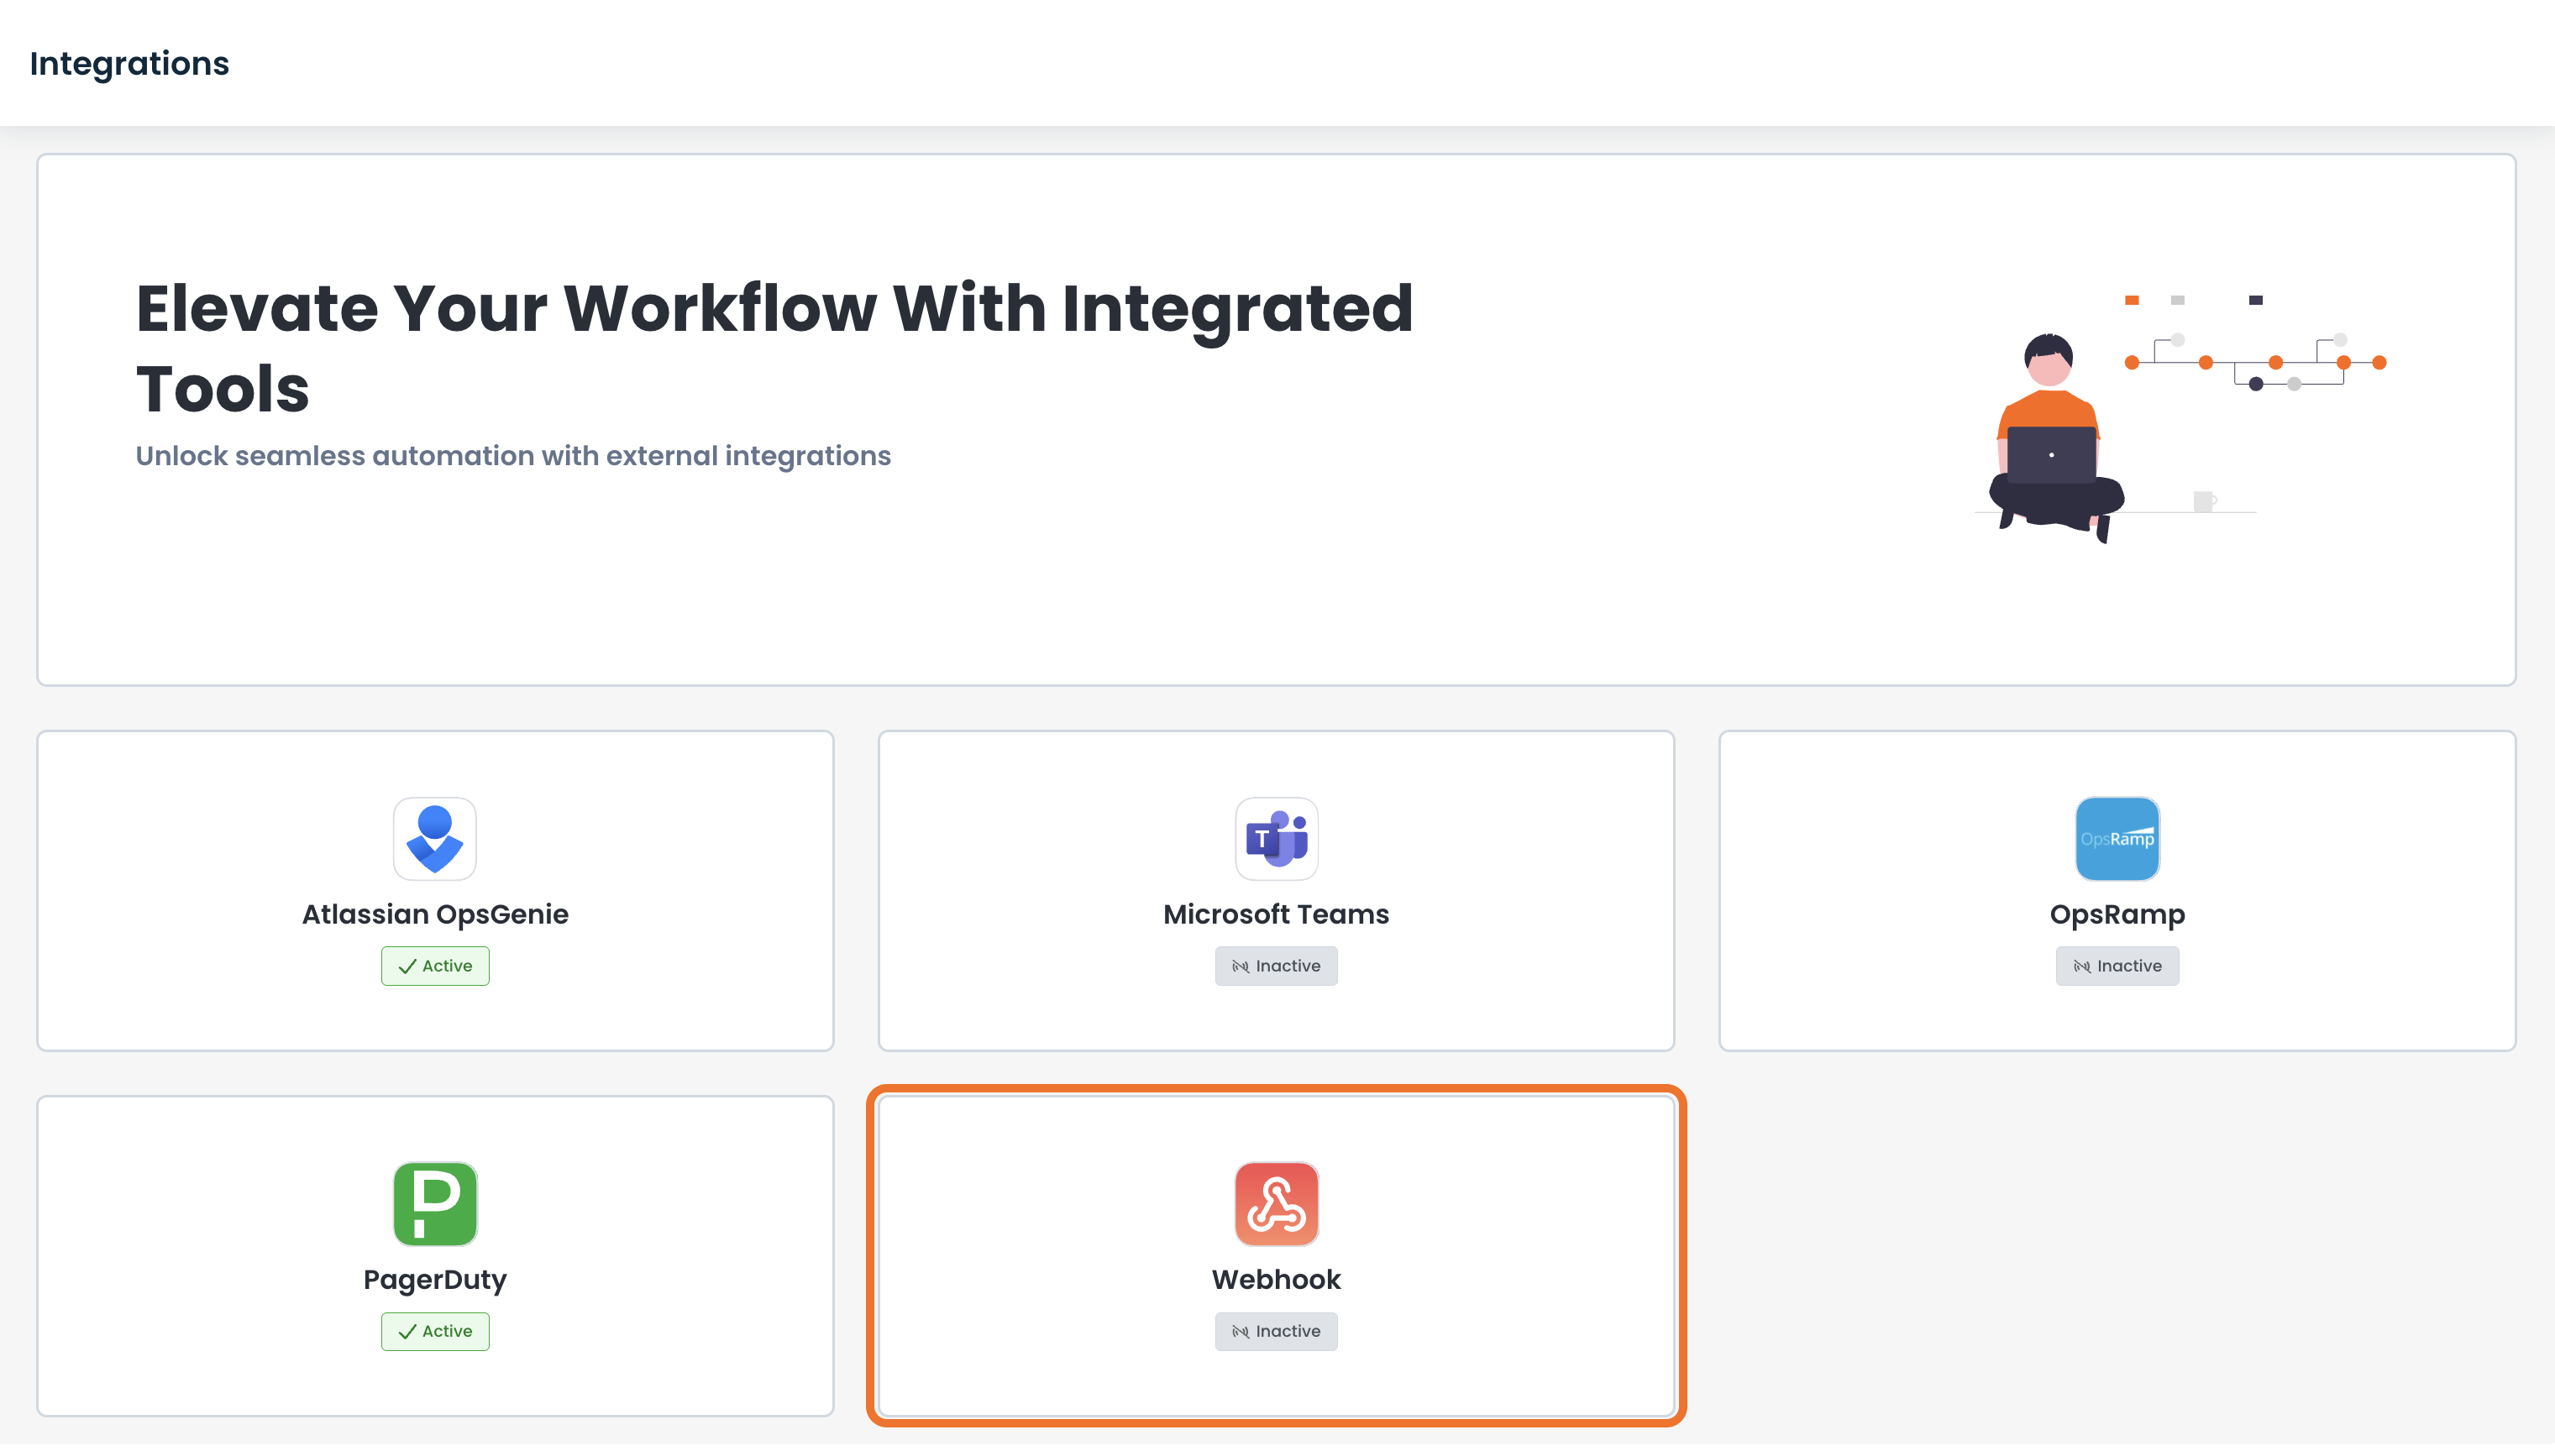
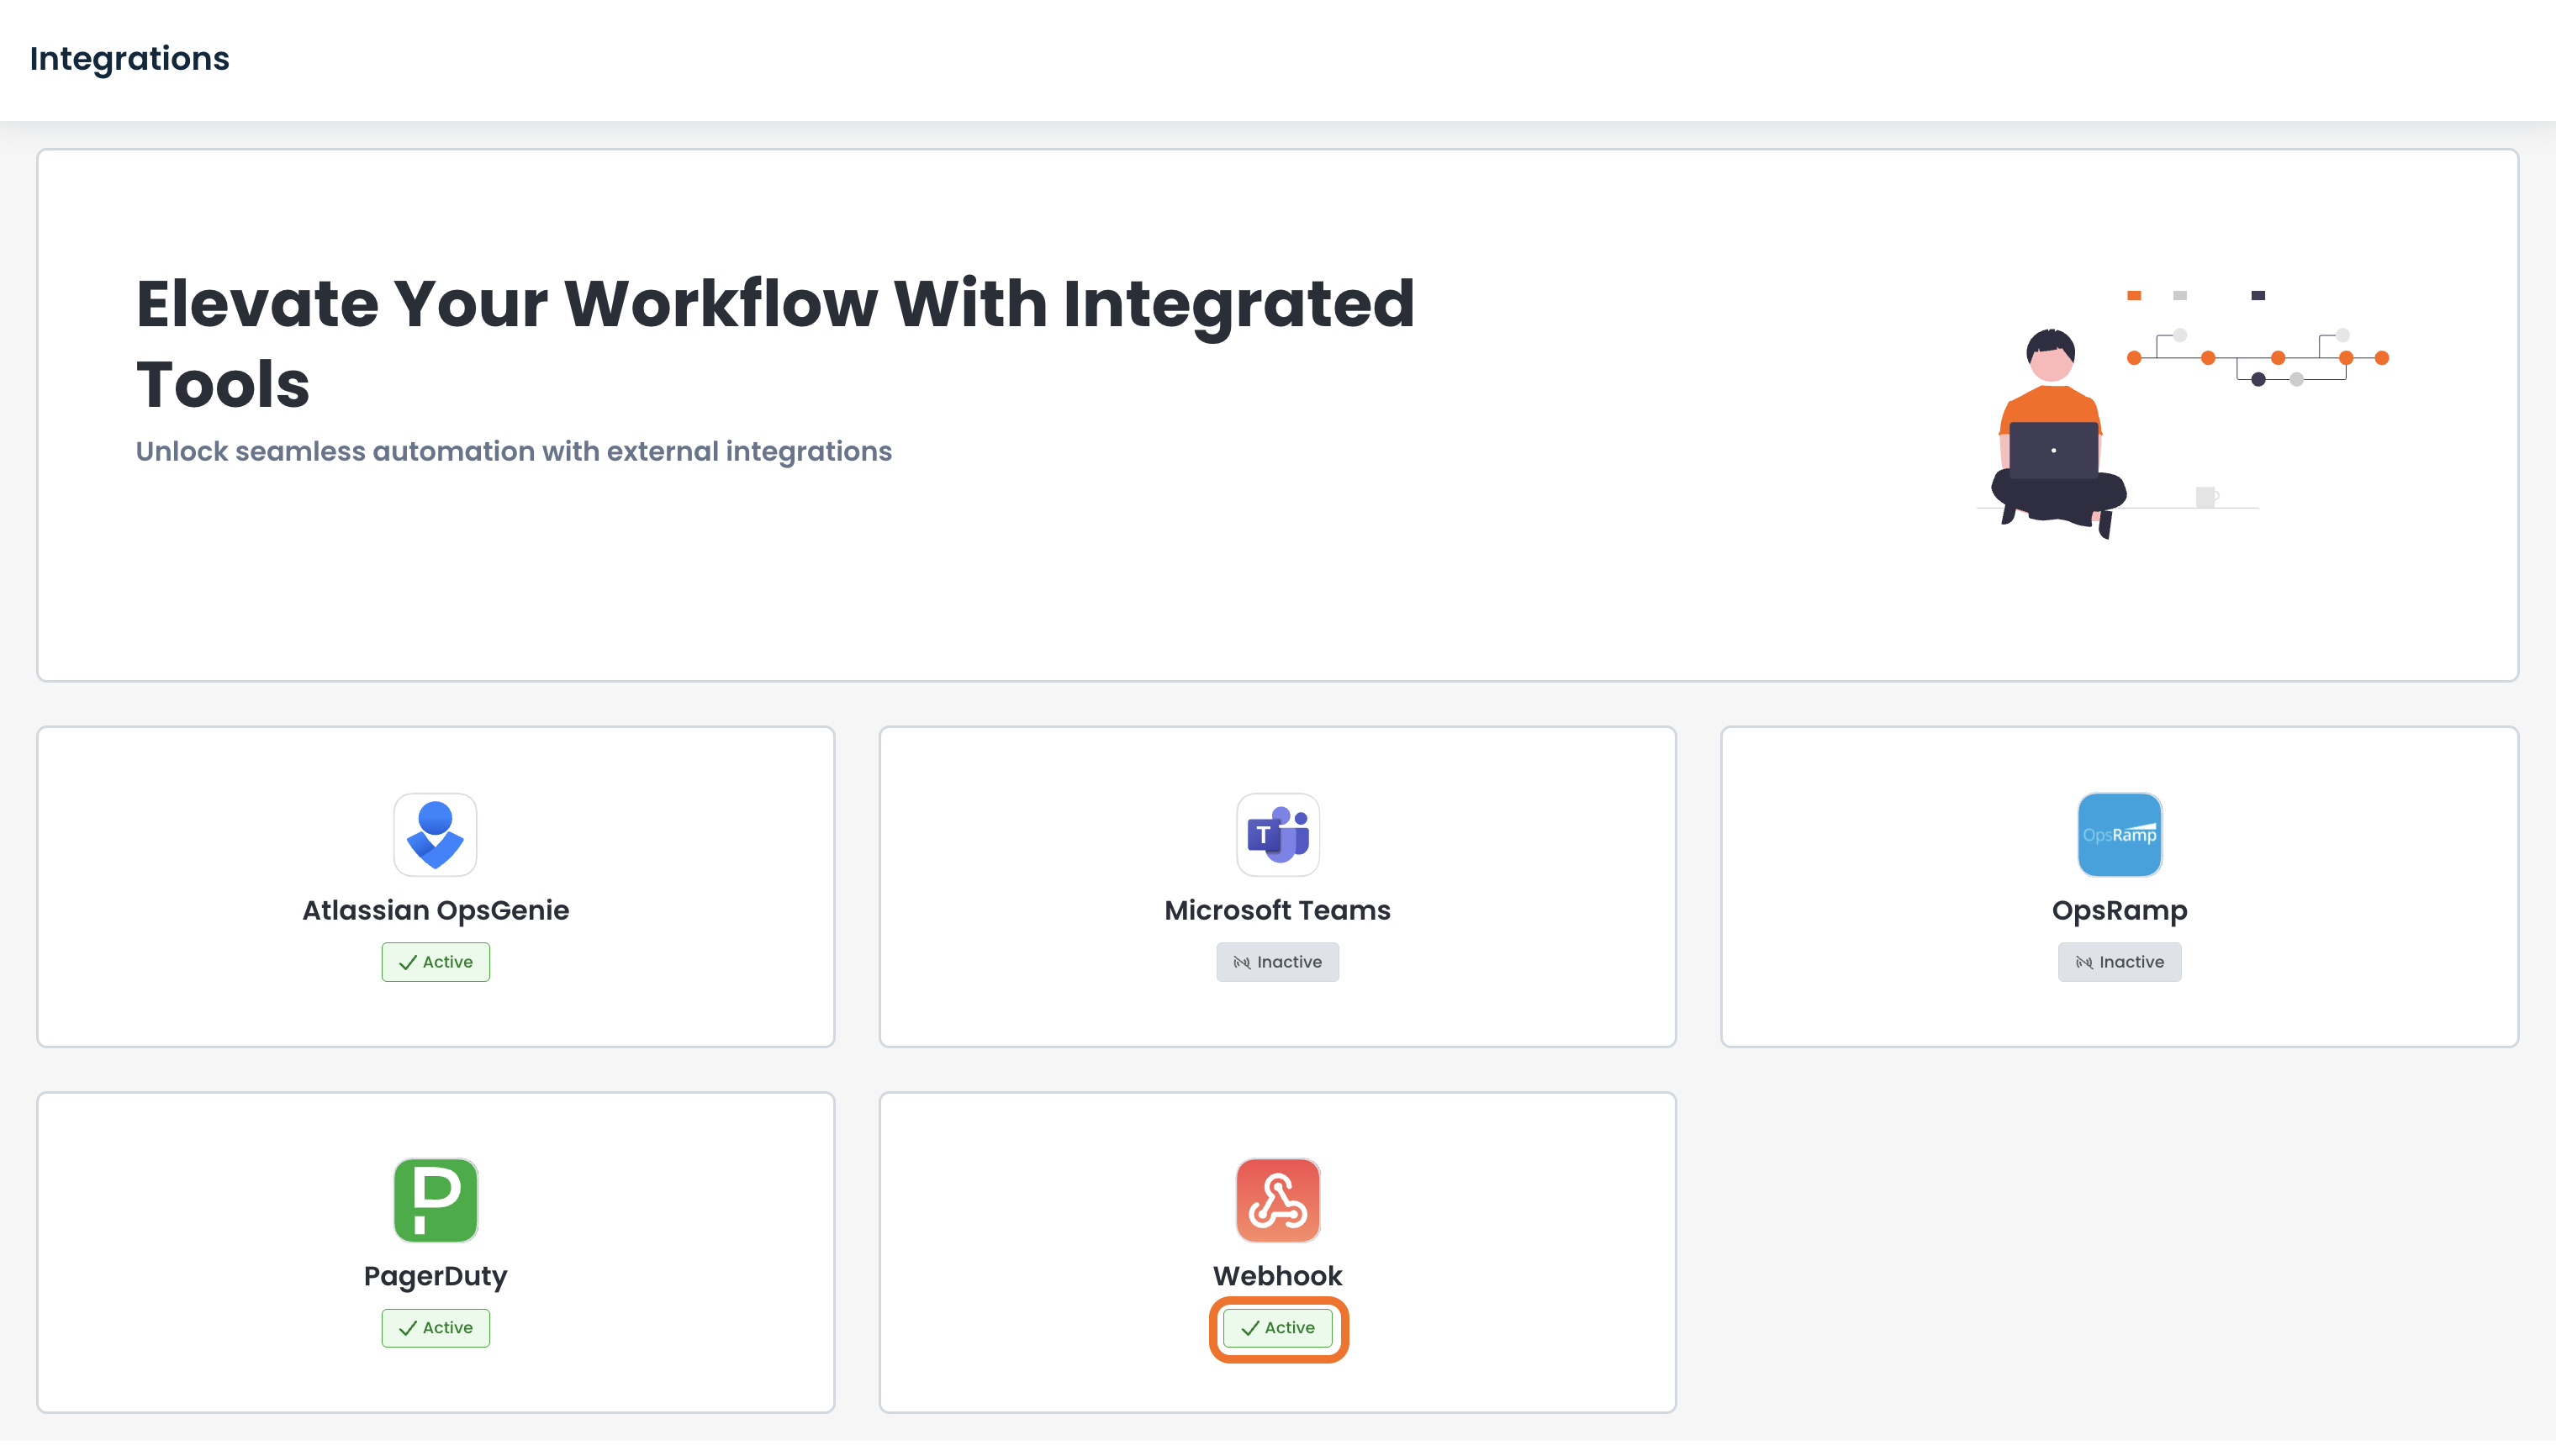
This opens the page to choose the integration(s) to receive notifications from Graphiant.
The status of each application is shown as either:
Active: The integration is turned on to receive notifications from Graphiant
Inactive: The integration is turned off so as to not receive notifications from Graphiant
Integrating with Atlassian OpsGenie
In order to configure the Atlassian OpsGenie integration:
You will first need to create an incoming webhook within Atlassian Opsgenie.
Locating Atlassian OpsGenie Integration in the Graphiant Portal
From the Integration page, select 'Atlassian OpsGenie'.
This opens the page to configure and edit Atlassian OpsGenie integrations.
Here will be visible all previously created integrations and their active / inactive status.
.png)
Configuring Atlassian OpsGenie Integration
To add a new integration to Altassian OpsGenie, click 'Add Integration' at the top right.
.png)
The new integration fields will appear above any existing integrations.
.png)
Complete the following fields:
Integration Nickname: The name defining the use of the integration.
OpsGenie Key: The incoming API Key from the OpsGenie app.
Note:
The Integration Nickname field is pre-filled with the Integration ID. Should a name be desired for ease of the user that is more specific to the use of the integration, enter it here.
.png)
Click off of the fields and the 'Save' button will be activated.
Click 'Save'.
.png)
The new OpsGenie Integration configuration is complete.
Note":
By default, the new integration is toggled to be on. If for any reason the integration is not to be used yet, click the toggle to be off.
.png)
Atlassian OpsGenie will now show as "Active" on the Integration page when the integration is complete and toggled on.
.png)
Note:
Be sure to configure notifications to be sent to Atlassian OpsGenie for any alarm needed.
The OpsGenie integration can be tested to ensure that the API Key integration is working by clicking 'Send Test Notification'.
This will prompt a test message from Graphiant to be received by OpsGenie via the integration.
.png)
Editing an Existing Atlassian OpsGenie Integration
To edit an existing OpsGenie integration, from the OpsGenie Integration page in the Graphiant Portal, click 'Edit Integration'.
.png)
Edit the necessary fields; click 'Save'.
.png)
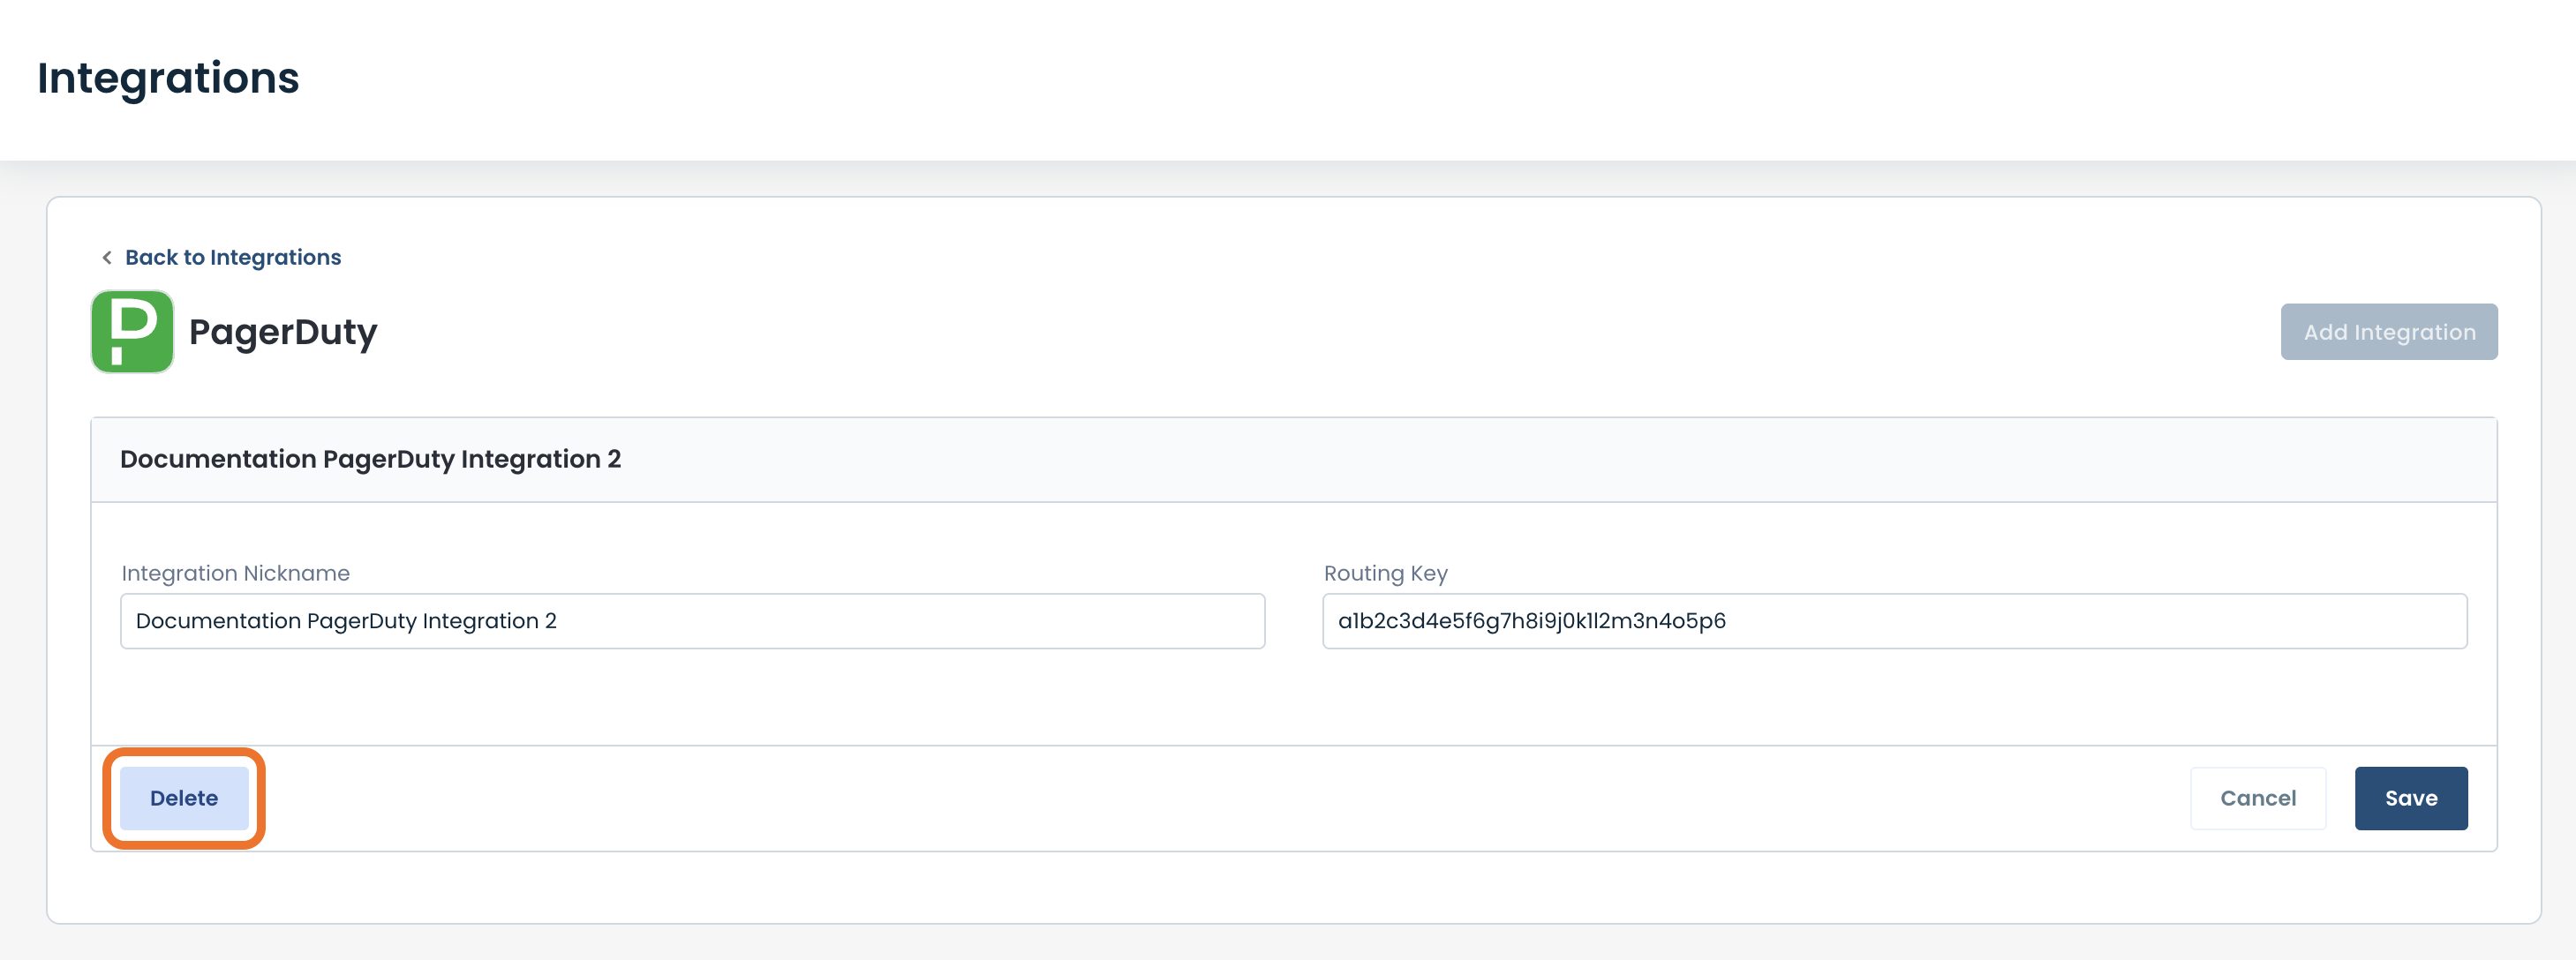
Deleting an Atlassian OpsGenie Integration
To delete an existing OpsGenie integration, from the OpsGenie Integration page in the Graphiant Portal, click 'Edit Integration'.
.png)
Click 'Delete'.
.png)
The chosen OpsGenie integration will be deleted and no longer appear in the integration table.
Alert:
There is no warning message when 'Delete' is clicked; the integration will be deleted immediately. Take care to delete the intended integration.
Integrating with Microsoft Teams
In order to configure the Microsoft Teams integration:
You will first need to create an incoming webhook within Microsoft Teams
Locating Microsoft Teams Integration in the Graphiant Portal
From the Integration page, select 'Microsoft Teams'.
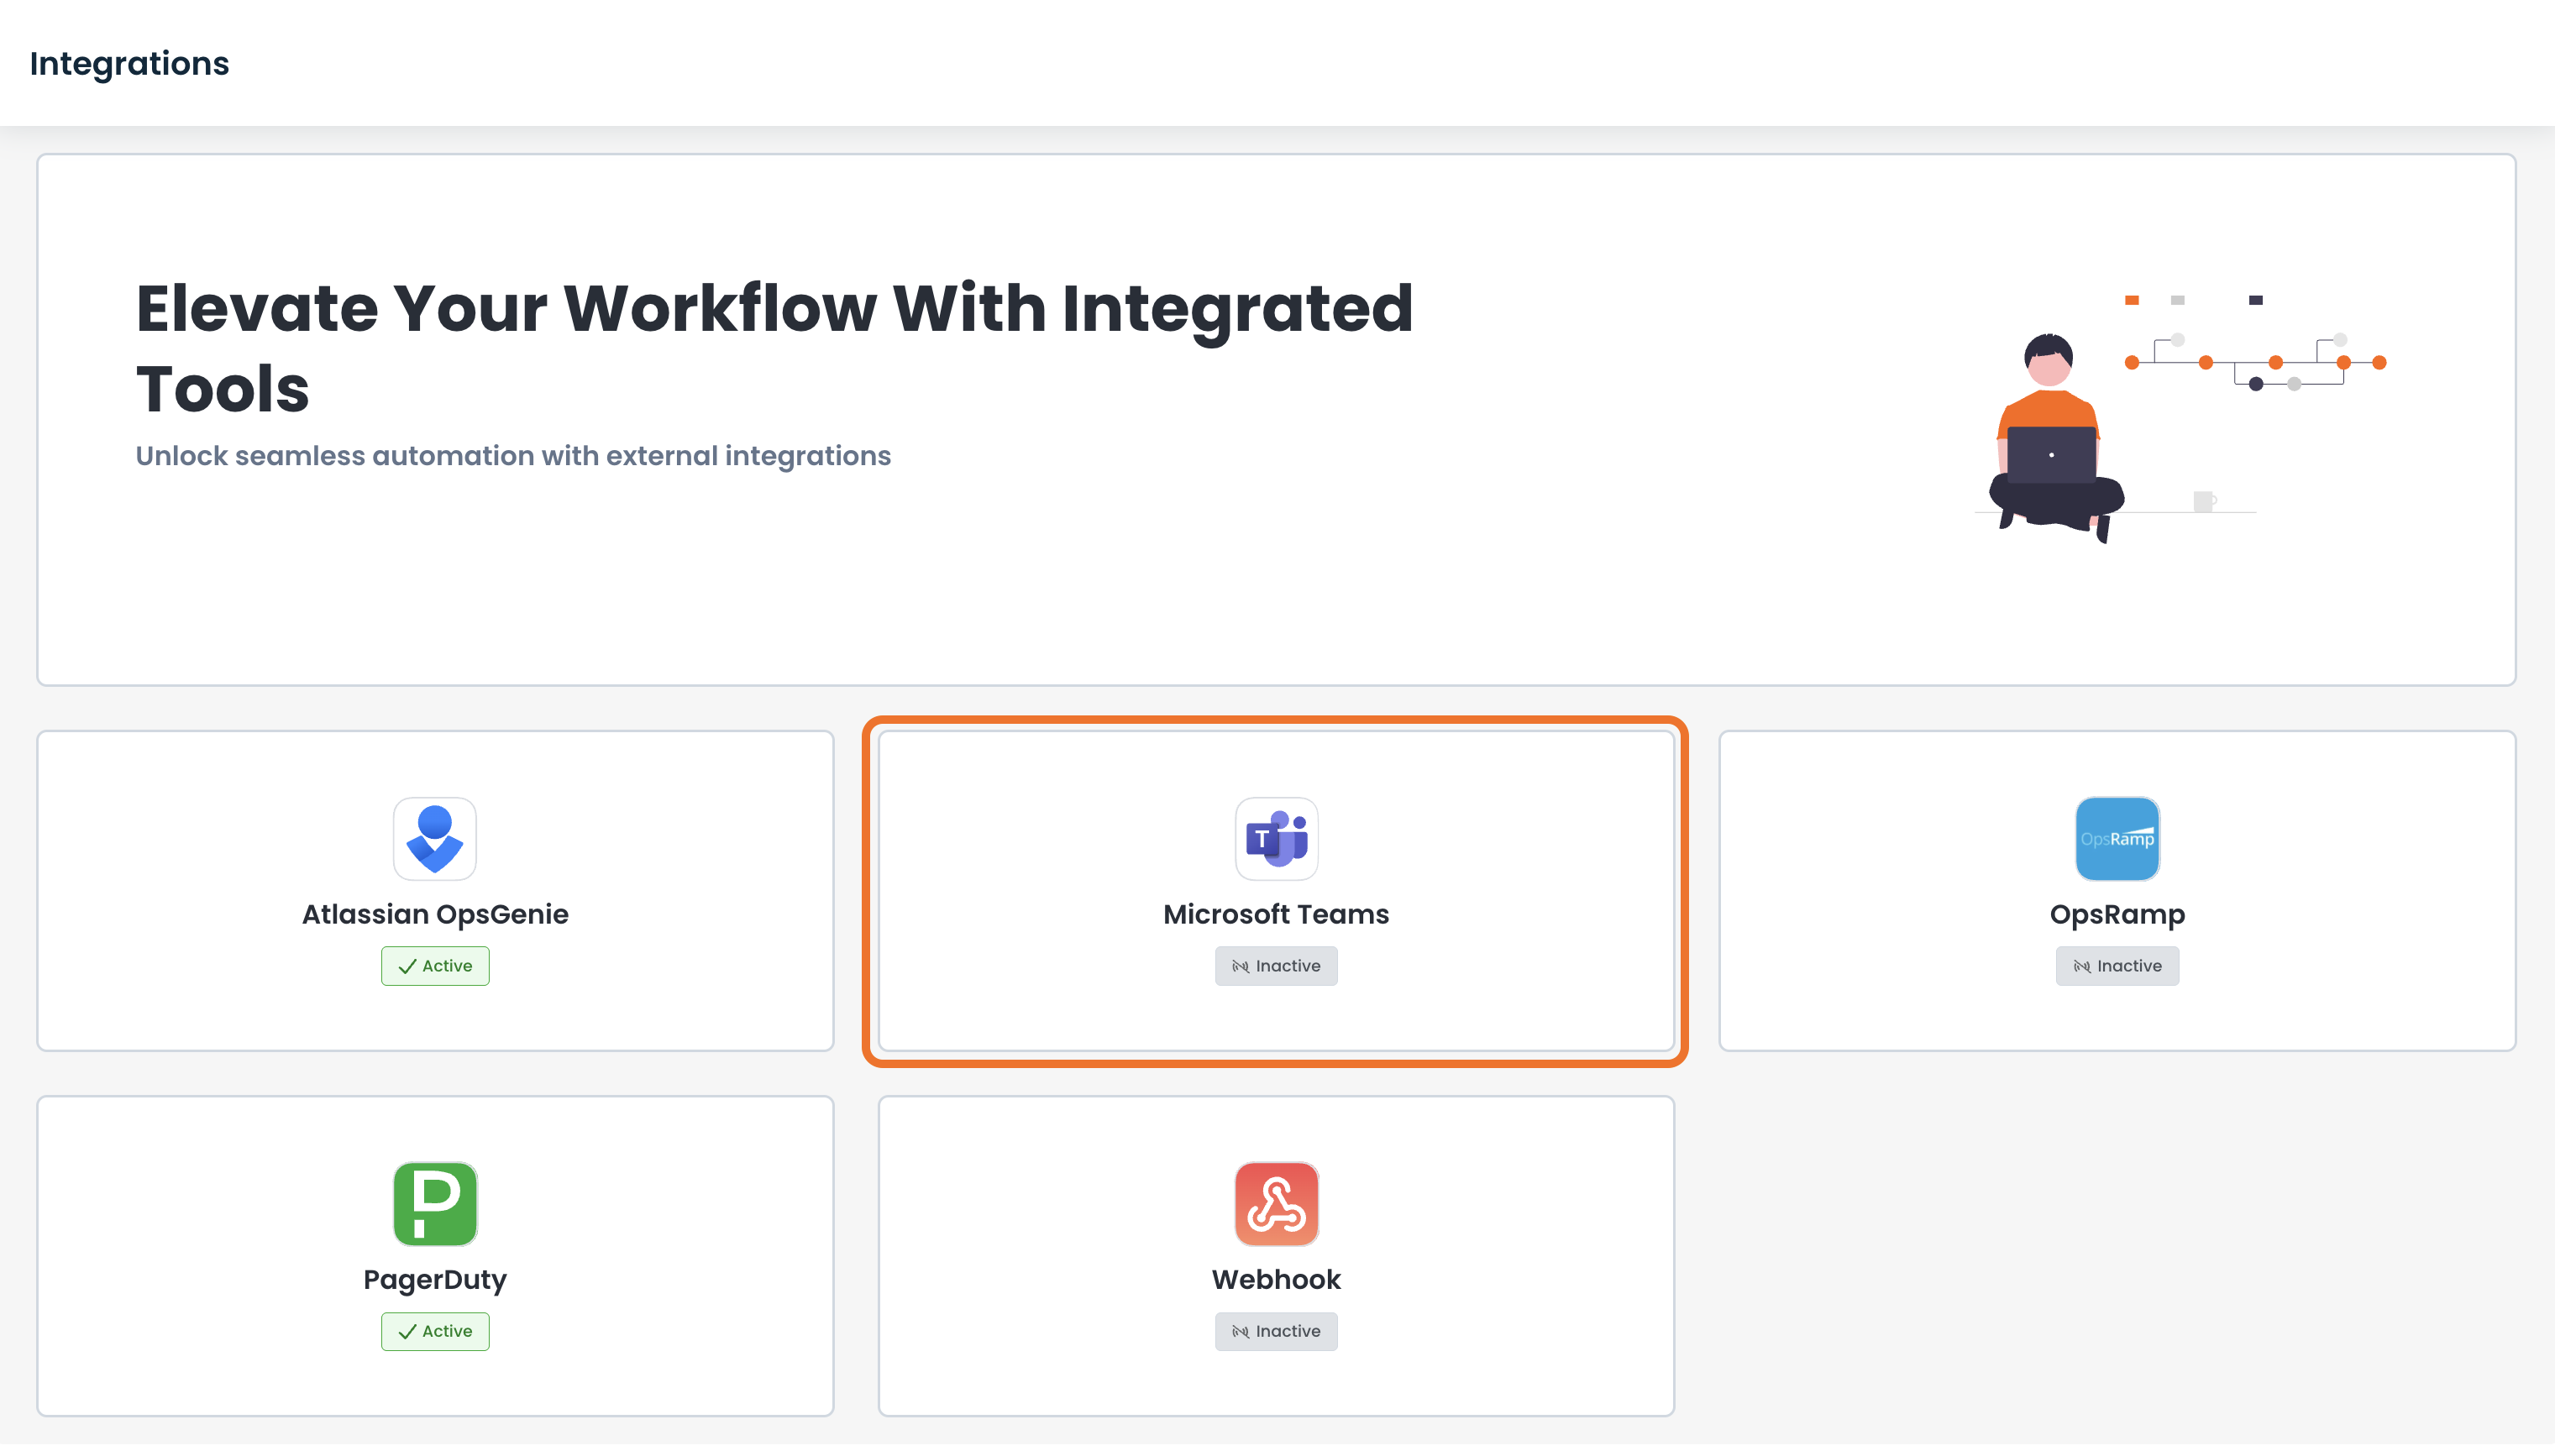
This opens the page to configure and edit Microsoft Teams integrations.
Here will be visible all previously created integrations and their active / inactive status.
.png)
Configuring Microsoft Teams Integration
To add a new integration to Microsoft Teams, click 'Add Integration' at the top right.
.png)
The new integration fields will appear above any existing integrations.
.png)
Complete the following fields:
Integration Nickname: The name defining the use of the integration.
Webhook URL: The incoming Webhook URL from the Microsoft Teams app. For instructions on creating a Teams Webhook, click here.
Note:
The Integration Nickname field is pre-filled with the Integration ID. Should a name be desired for ease of the user that is more specific to the use of the integration, enter it here.
.png)
Click off of the fields and the 'Save' button will be activated.
Click 'Save'.
.png)
The new Teams Integration configuration is complete.
Note:
By default, the new integration is toggled to be on. If for any reason the integration is not to be used yet, click the toggle to be off.
.png)
Microsoft Teams will now show as "Active" on the Integration page when the integration is complete and toggled on.
.png)
Note:
Be sure to configure notifications to be sent to Microsoft Teams for any alarms needed.
The Teams integration can be tested to ensure that the Webhook URL integration is working by clicking 'Send Test Notification'.
This will prompt a test message from Graphiant to be received by Teams via the integration.
.png)
Editing an Existig Microsoft Teams Integration
To edit an existing Teams integration, from the Teams Integration page in the Graphiant Portal, click 'Edit Integration'.
.png)
Edit the necessary fields; click 'Save'.
.png)
Deleting a Microsoft Teams Integration
To delete an existing Teams integration, from the Teams Integration page in the Graphiant Portal, click 'Edit Integration'.
.png)
Click 'Delete'.
.png)
The chosen Teams integration will be deleted and no longer appear in the integration table.
Alert:
There is no warning message when 'Delete' is clicked; the integration will be deleted immediately. Take care to delete the intended integration.
Integrating with PagerDuty
In order to configure the Pager Duty integration:
You will first need to create an incoming webhook within Pager Duty.
Locating PagerDuty Integration in the Graphiant Portal
From the Integration page, select 'PagerDuty'.
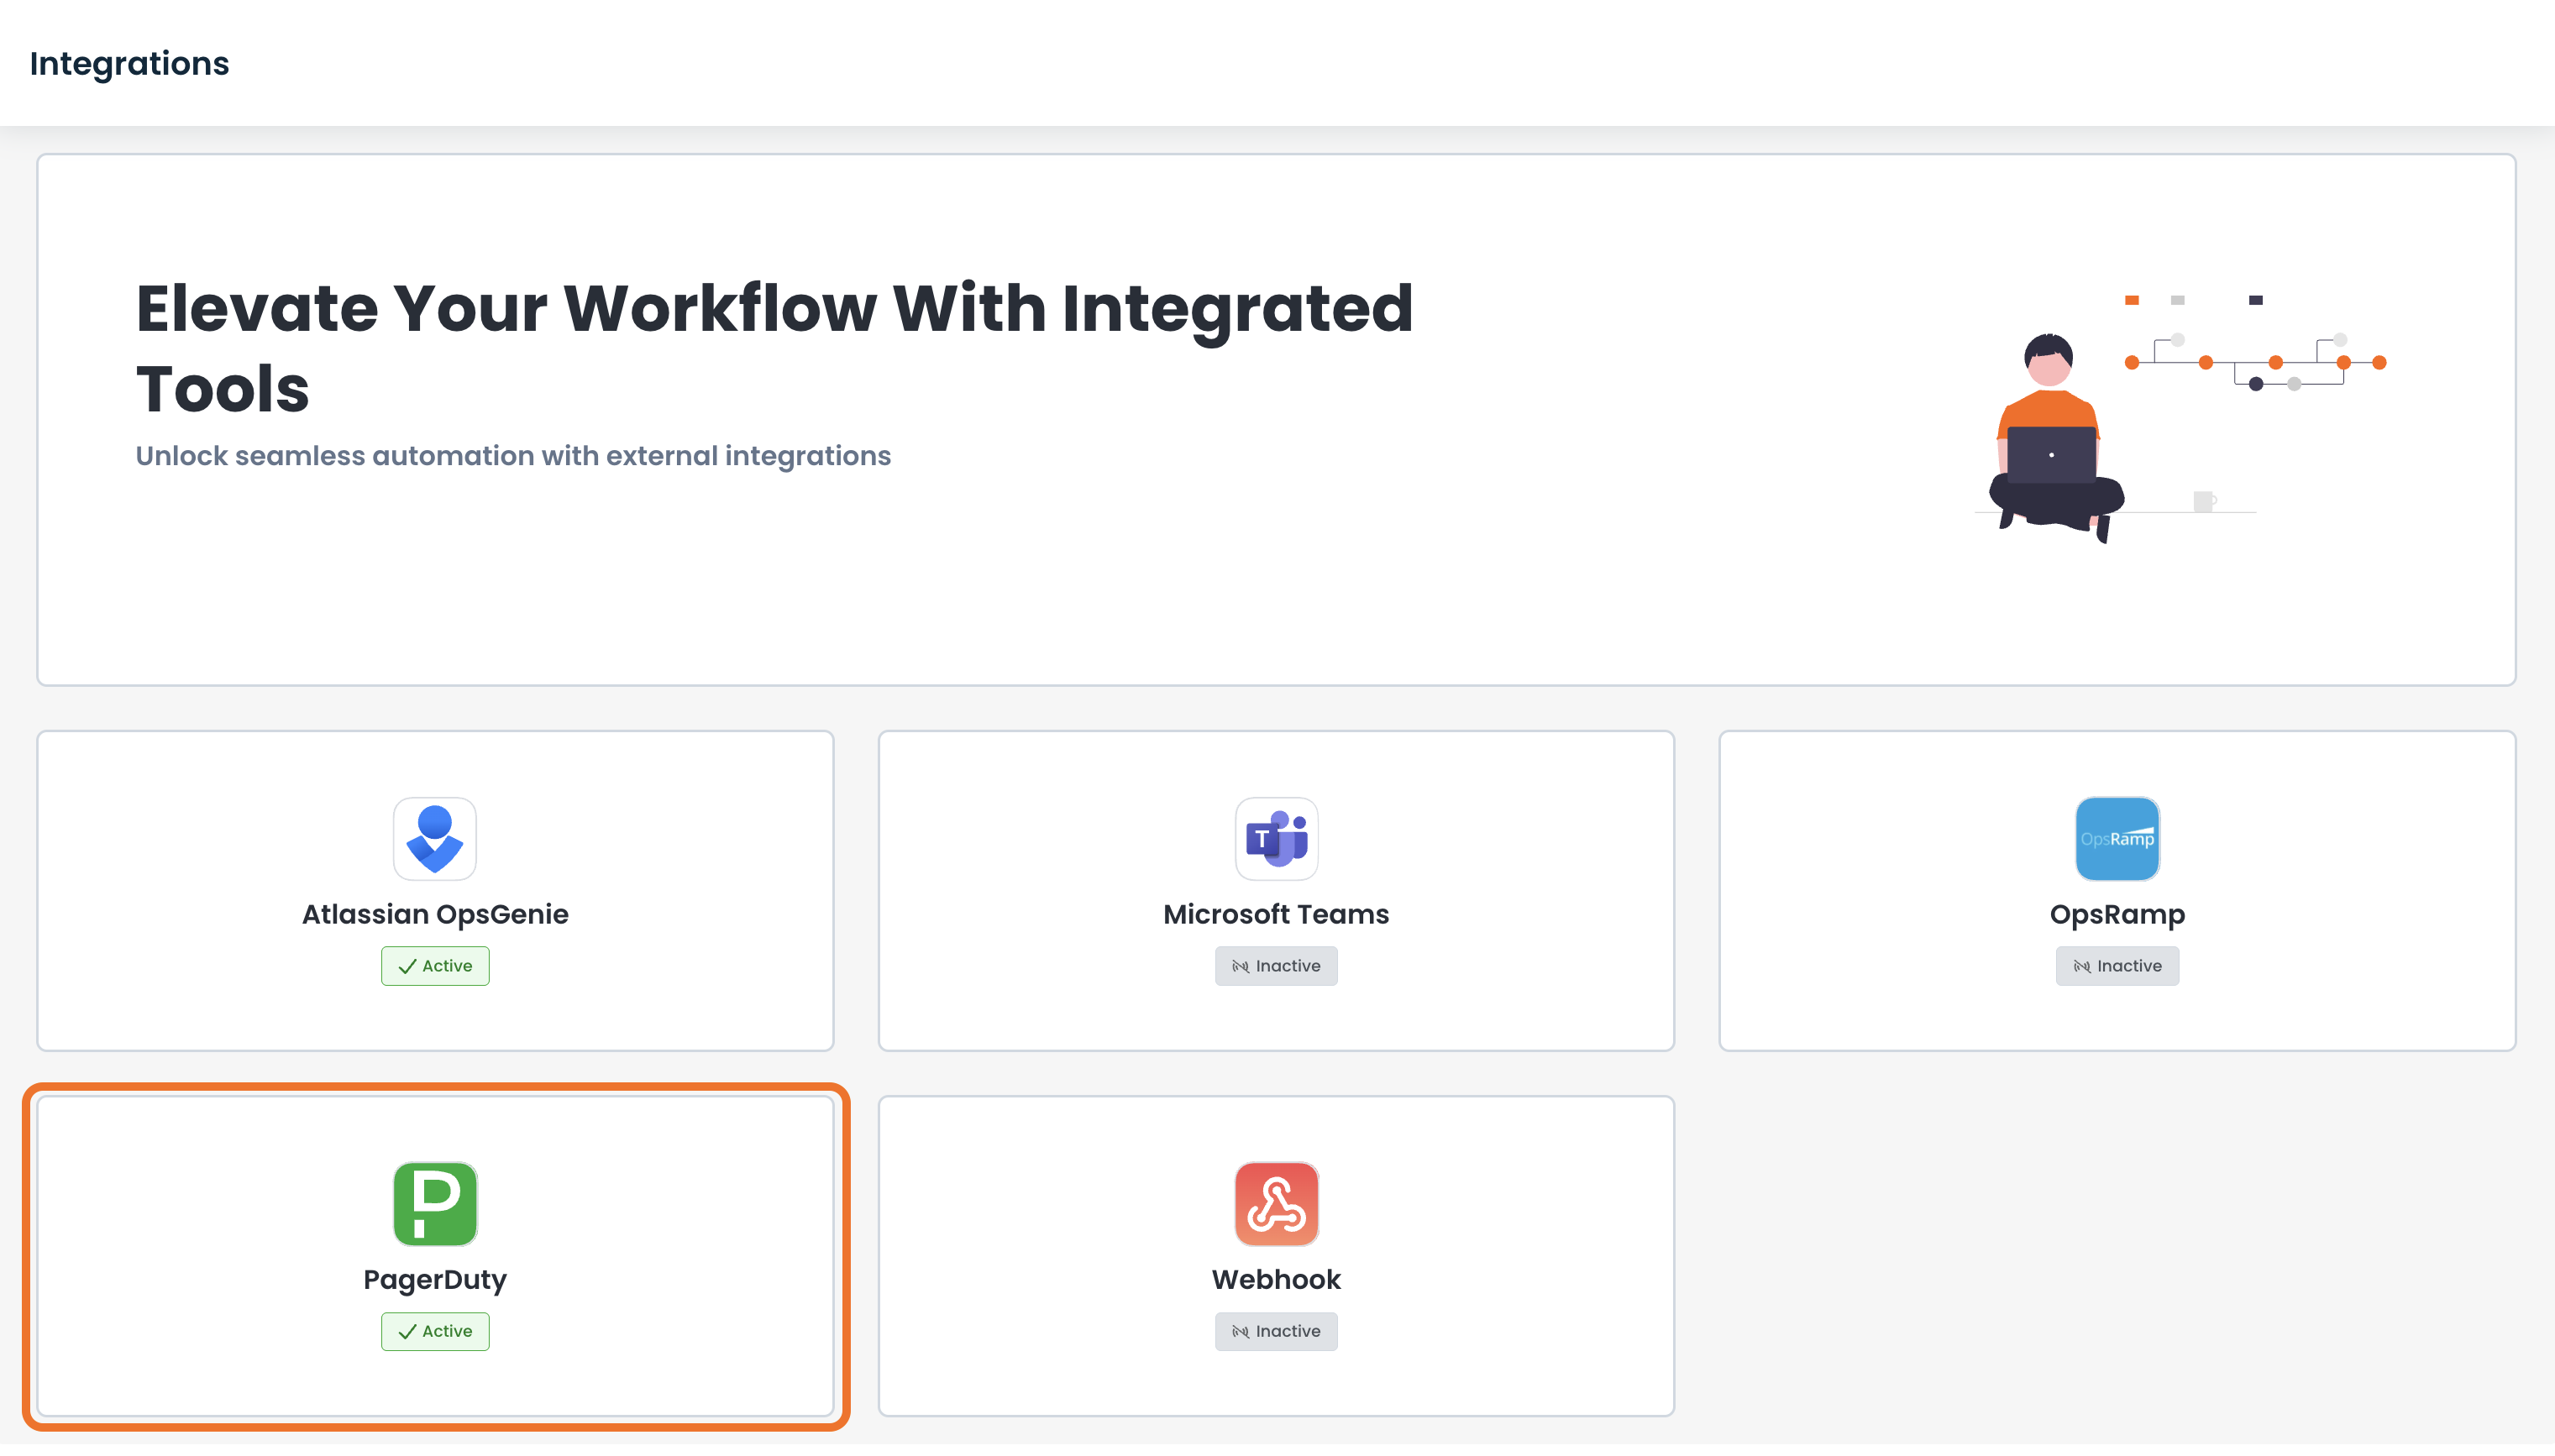
This opens the page to configure and edit PagerDuty integrations.
Here will be visible all previously created integrations and their active/inactive status.
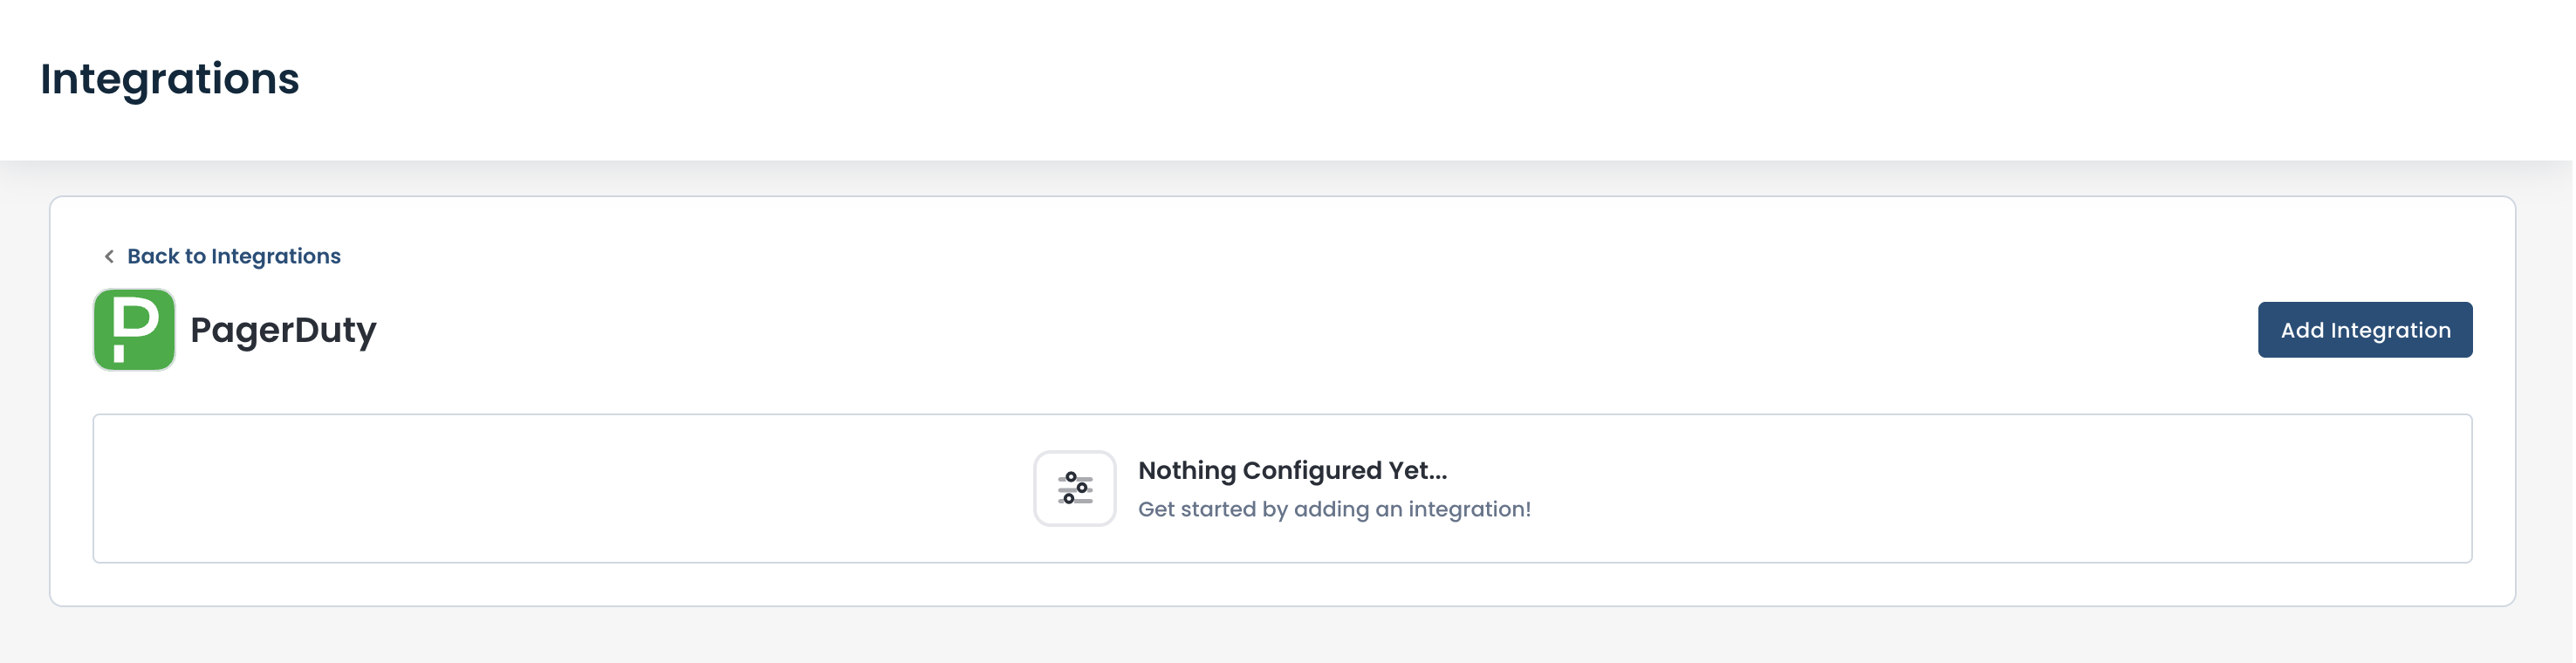
Configuring PagerDuty Integration
To add a new integration to PagerDuty, click 'Add Integration' at the top right.
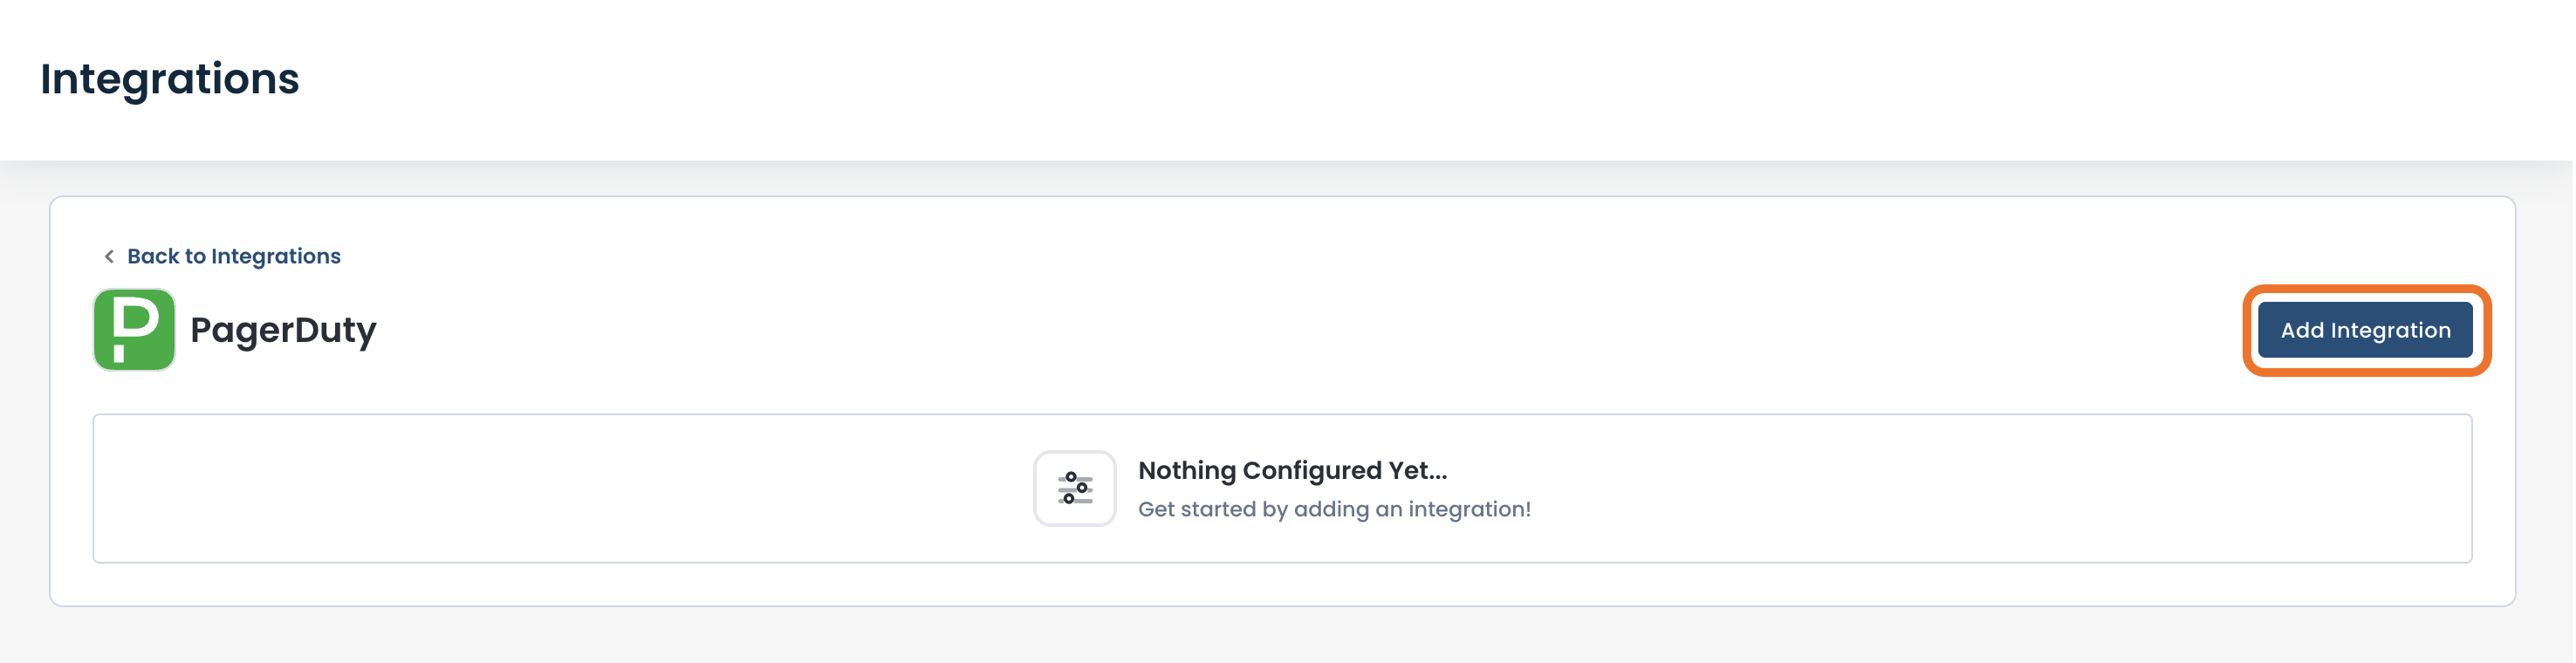
The new integration fields will appear above any existing integrations.
Complete the following fields:
Integration Nickname: The name defining the use of the integration.
Routing Key: The incoming API Key from the PagerDuty app. For information on where to find your PagerDuty routing/integration key, click here.
Note:
The Integration Nickname field is pre-filled with the Integration ID. Should a name be desired for ease of the user that is more specific to the use of the integration, enter it here.
Click off of the fields and the 'Save' button will be activated.
Click 'Save'.
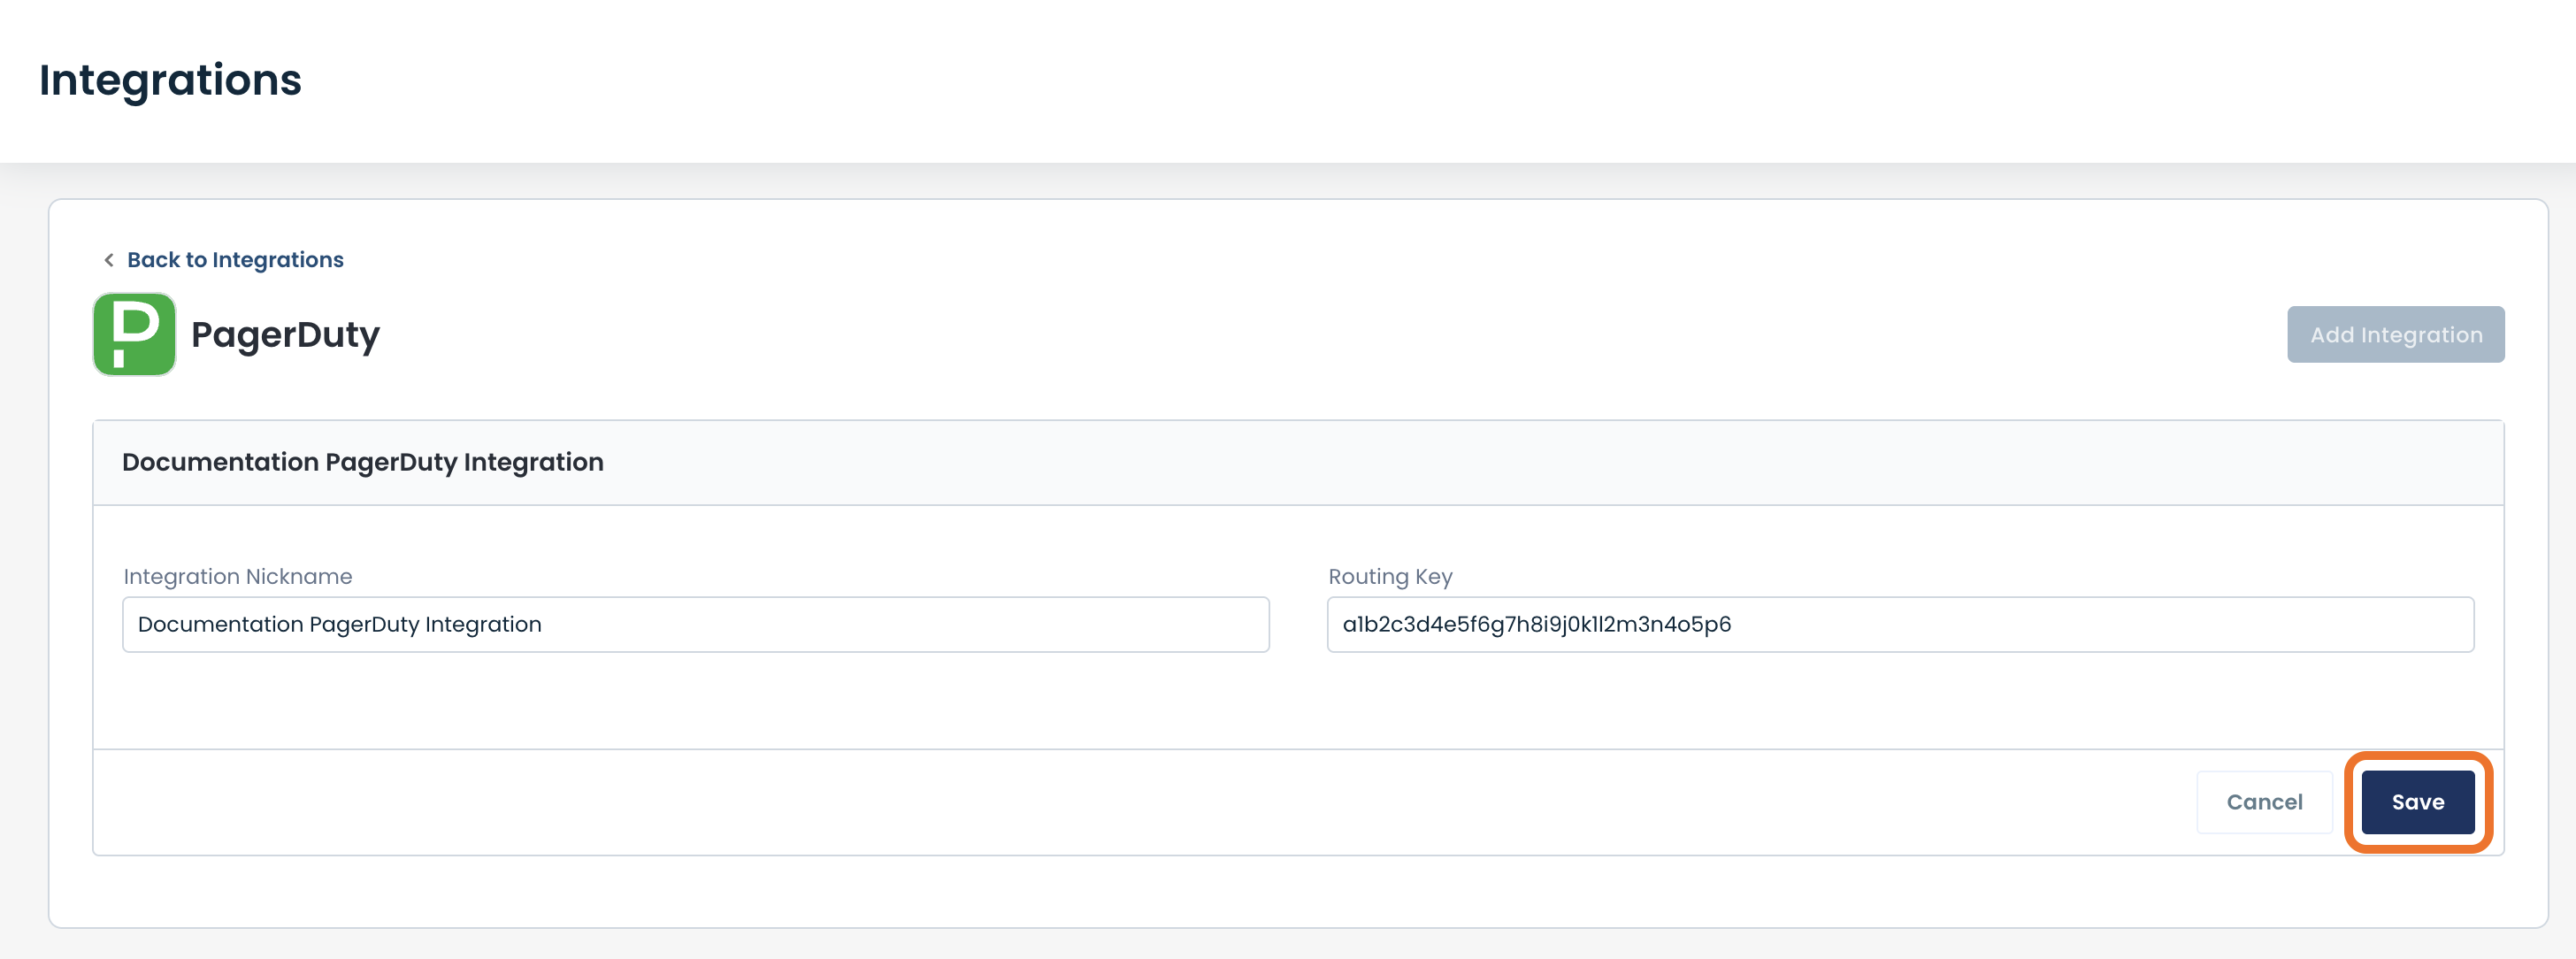
The new PagerDuty Integration configuration is complete.
Note":
By default, the new integration is toggled to be on. If for any reason the integration is not to be used, click the toggle to be off.
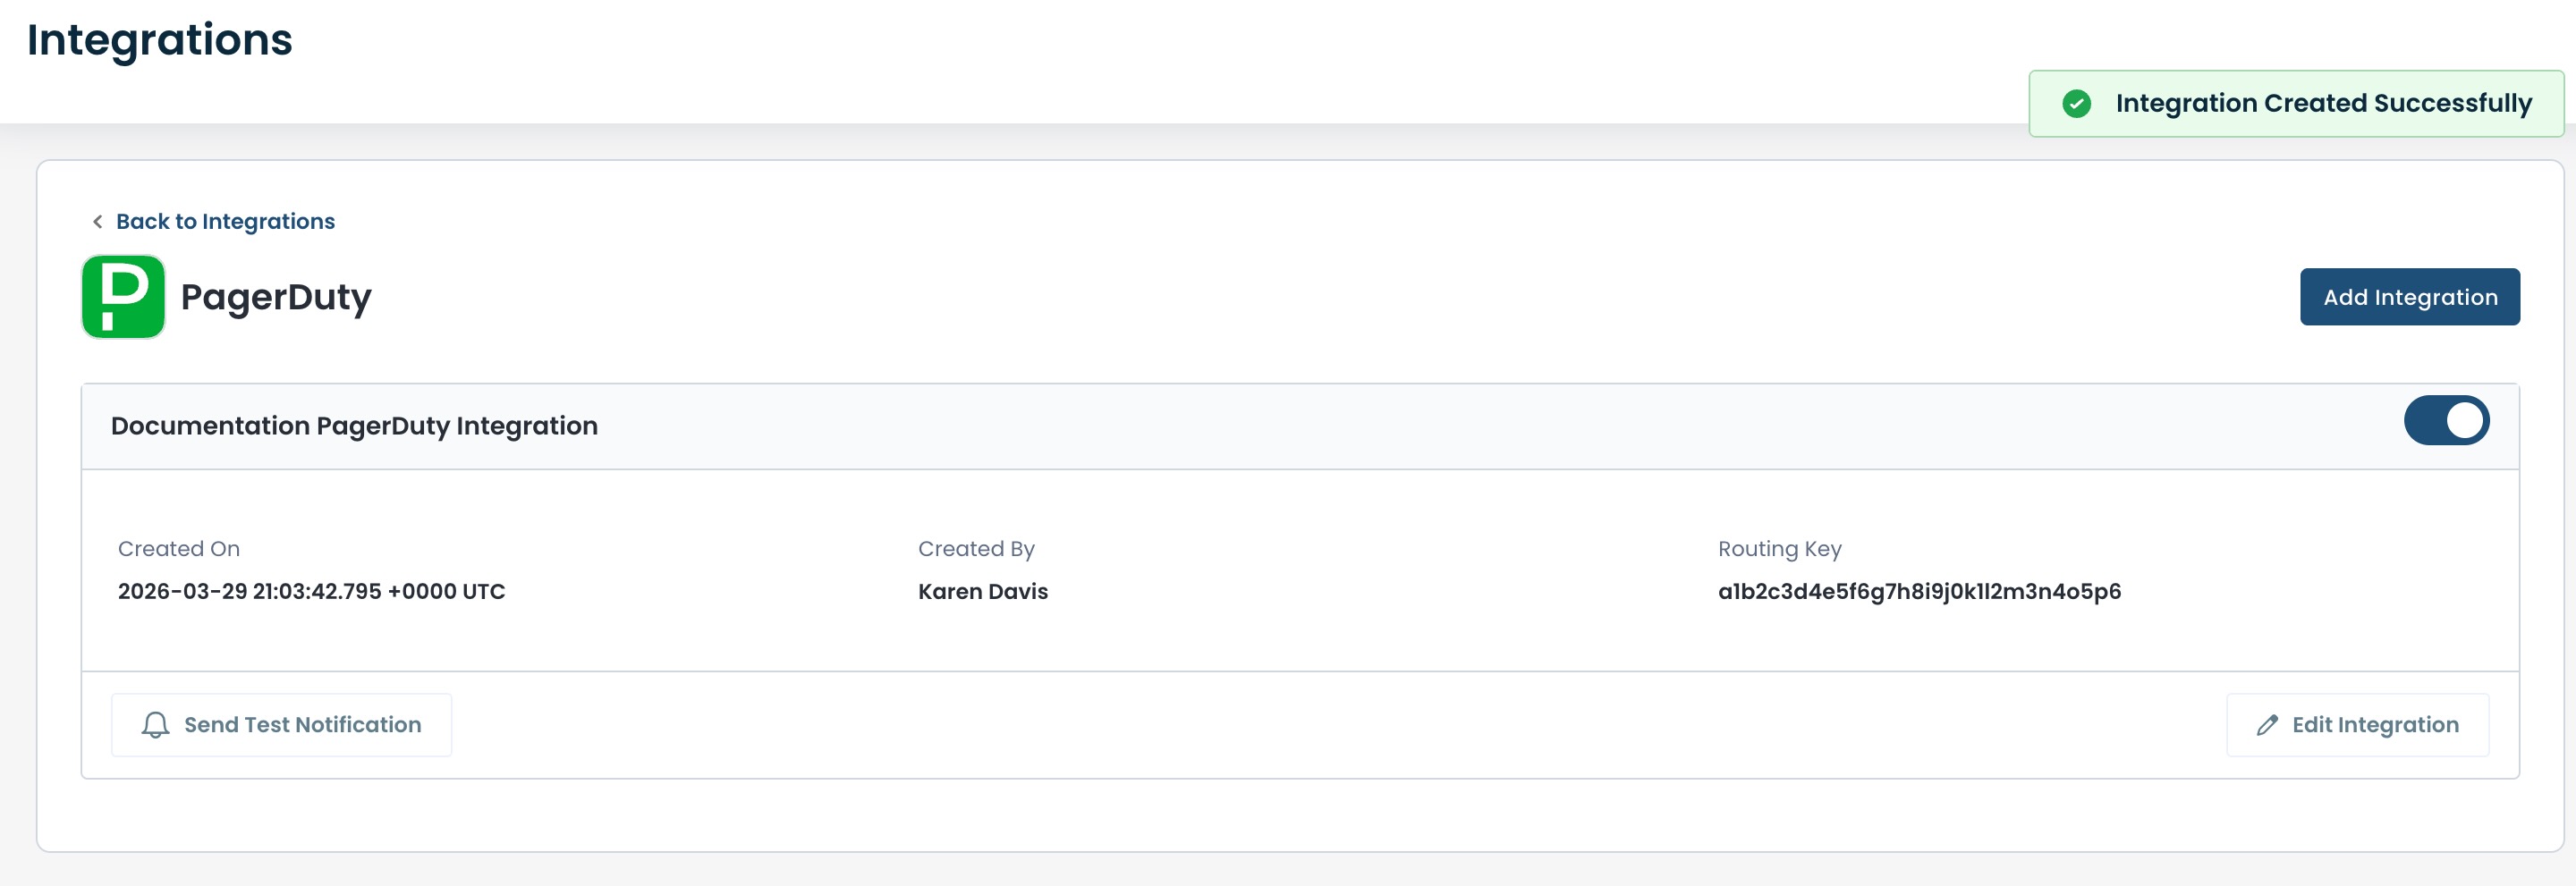
Note:
Be sure to configure notifications to be sent to PagerDuty for any alarms needed.
PagerDuty will now show as "Active" on the Integration page when the integration is complete and toggled on.
The PagerDuty integration can be tested to ensure that the API Key integration is working by clicking 'Send Test Notification'.
This will prompt a test message from Graphiant to be received by PagerDuty via the integration.
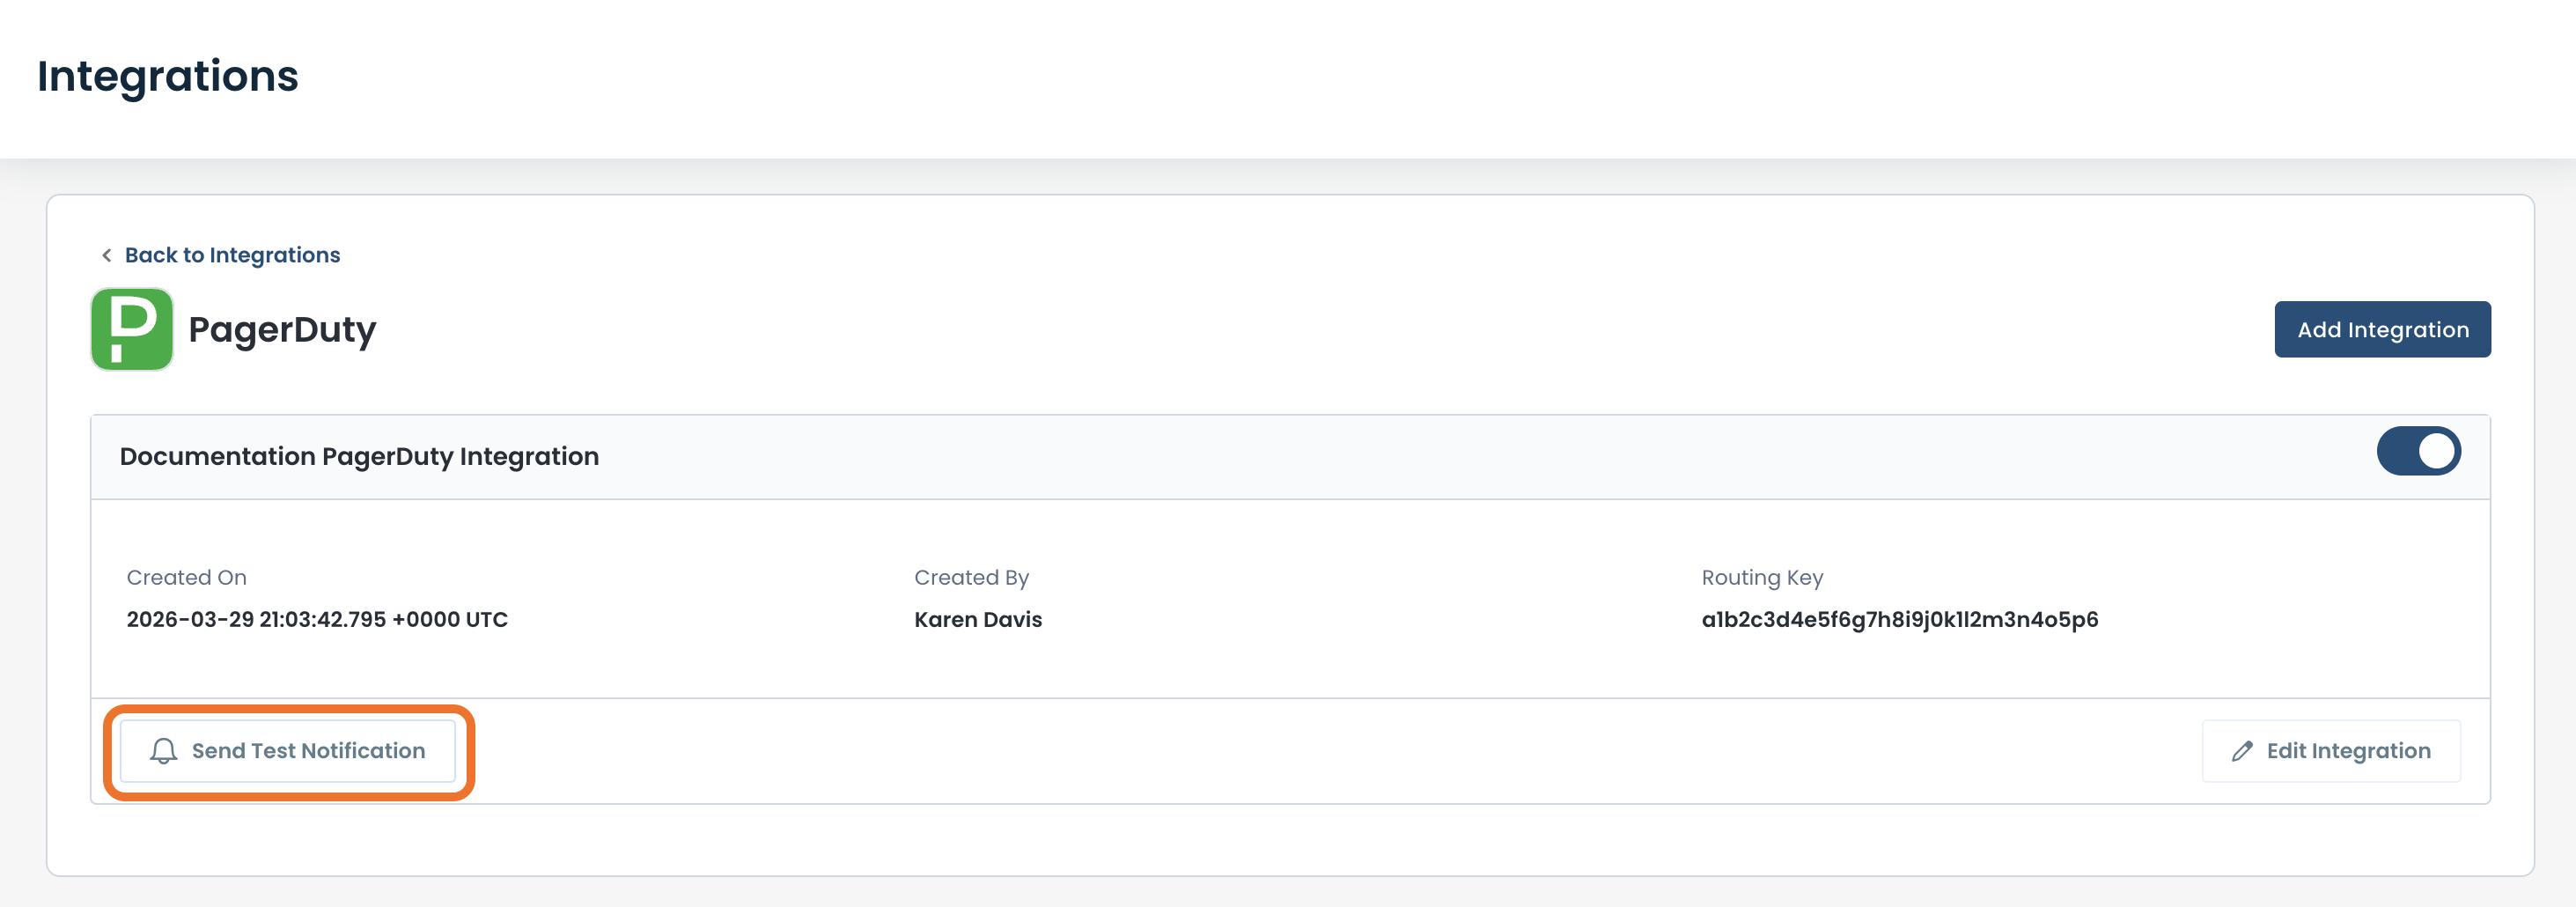
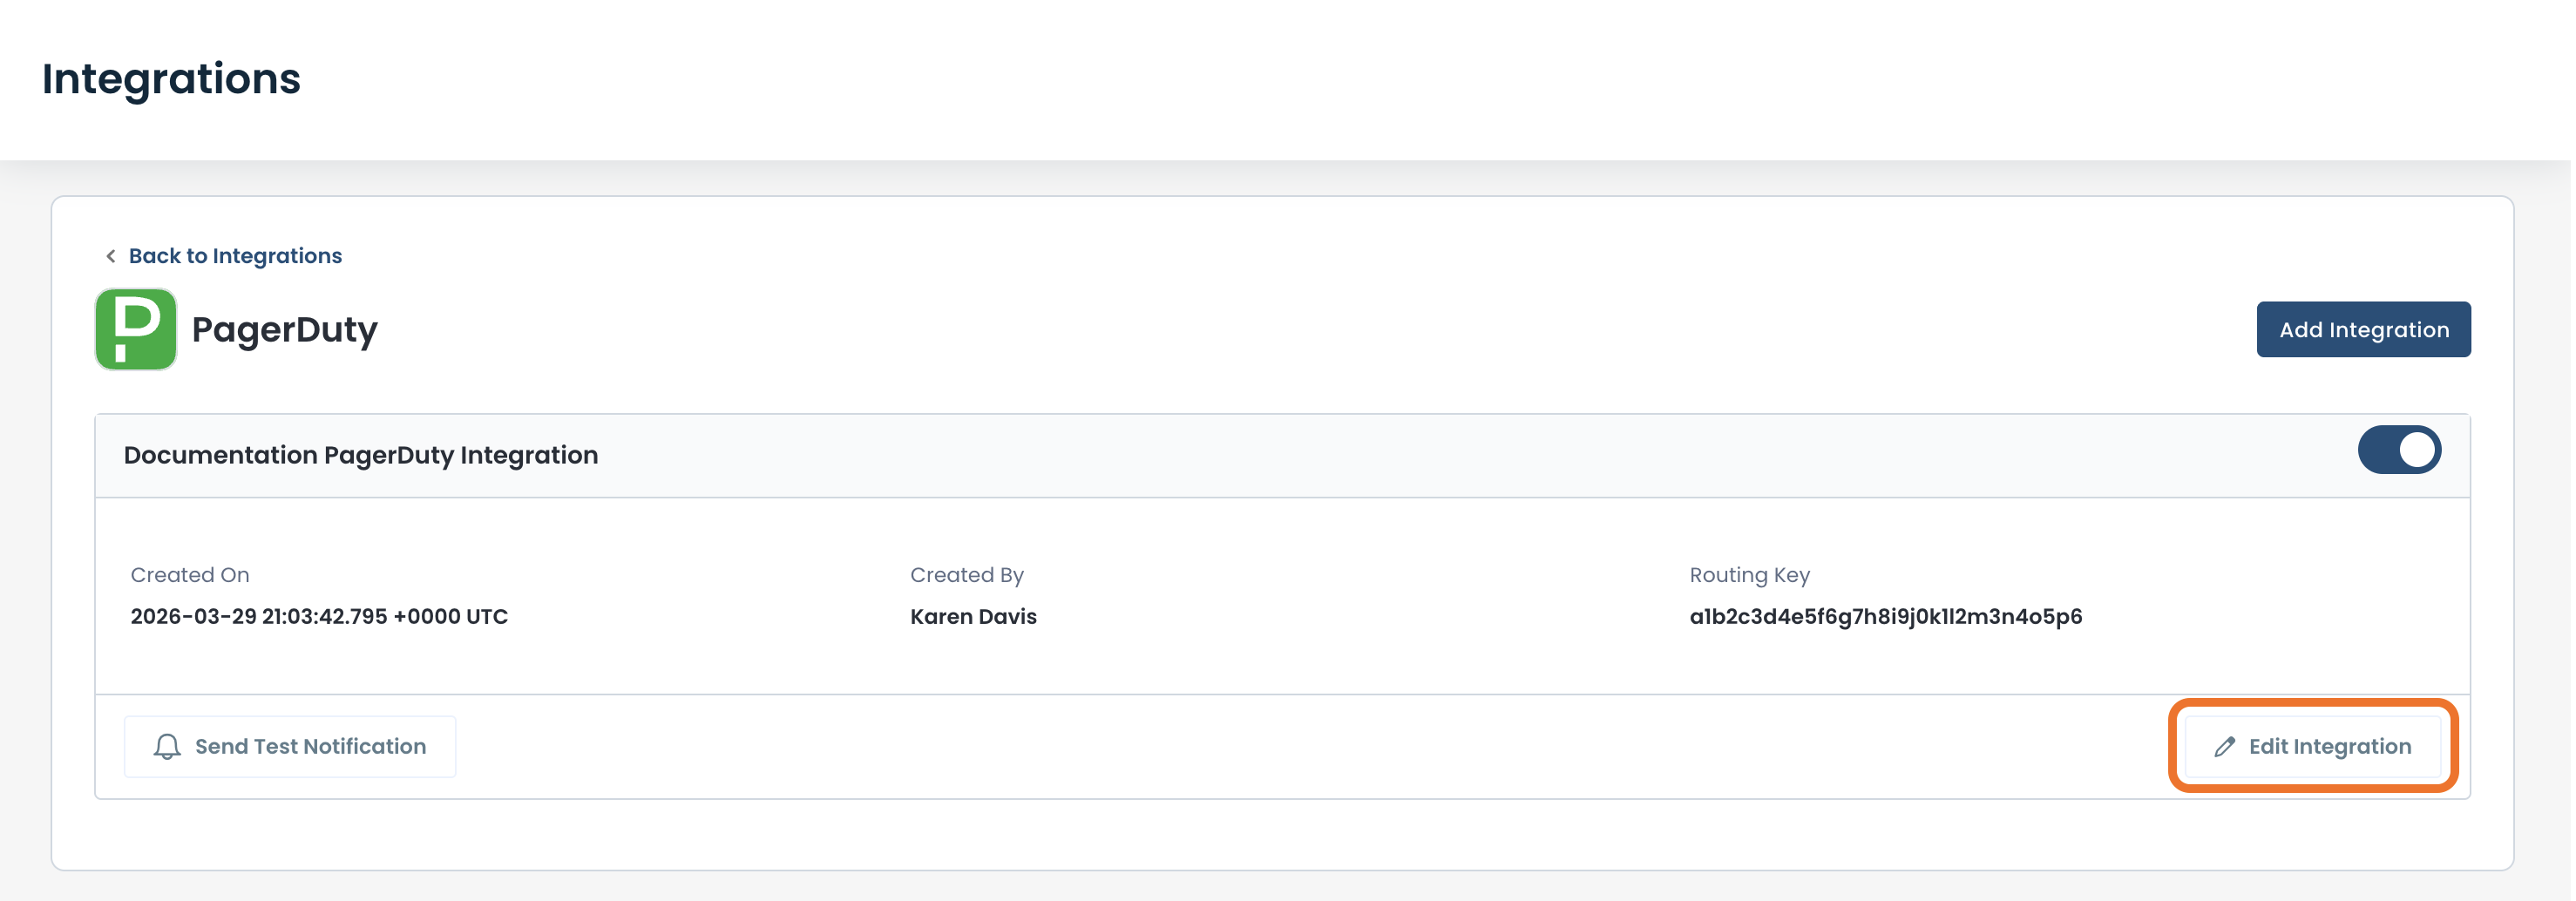
Editing an Existing PagerDuty Integration
To edit an existing PagerDuty integration, from the PagerDuty Integration page in the Graphiant Portal, click 'Edit Integration'.
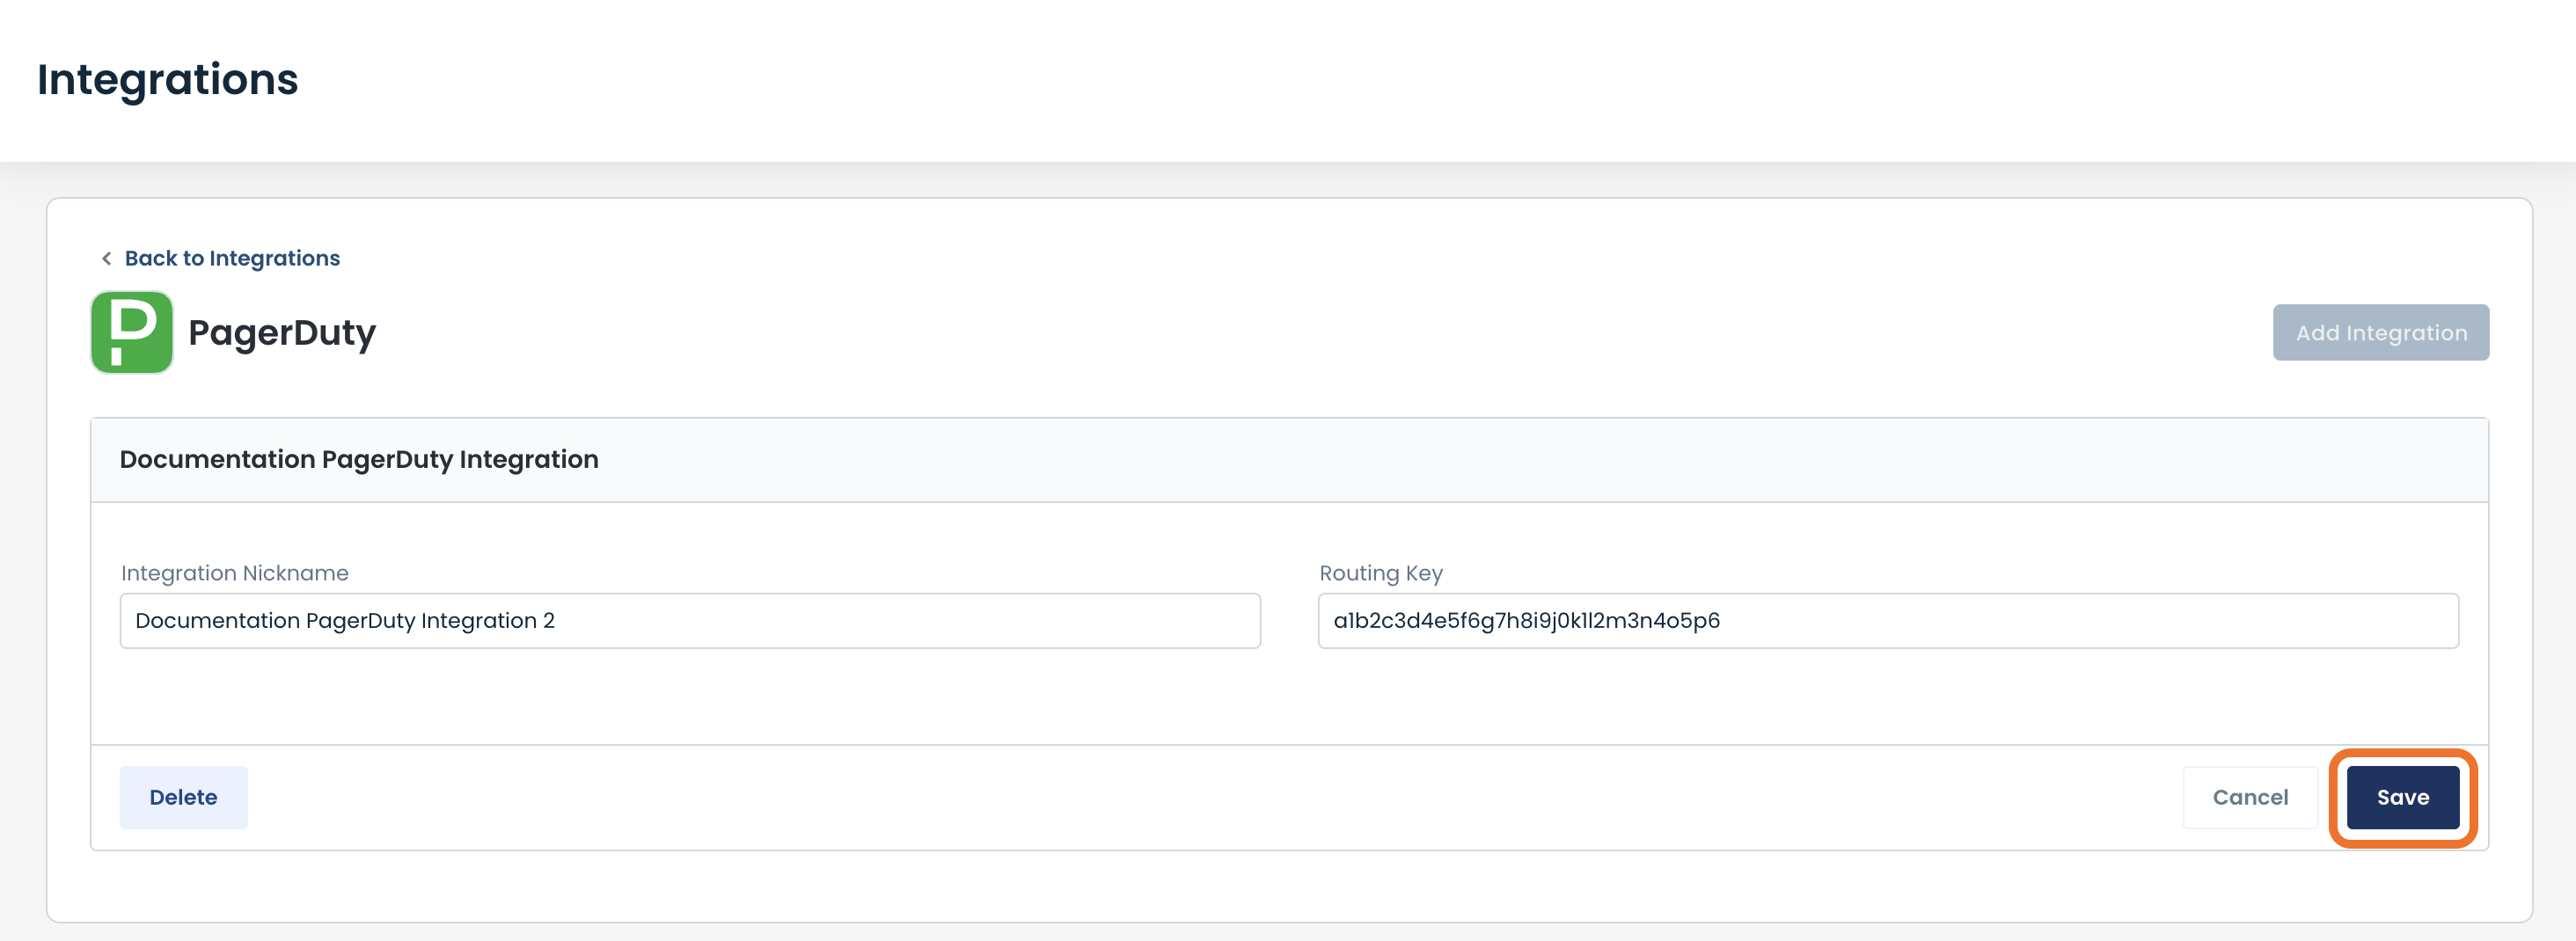
Edit the necessary fields; click 'Save'.
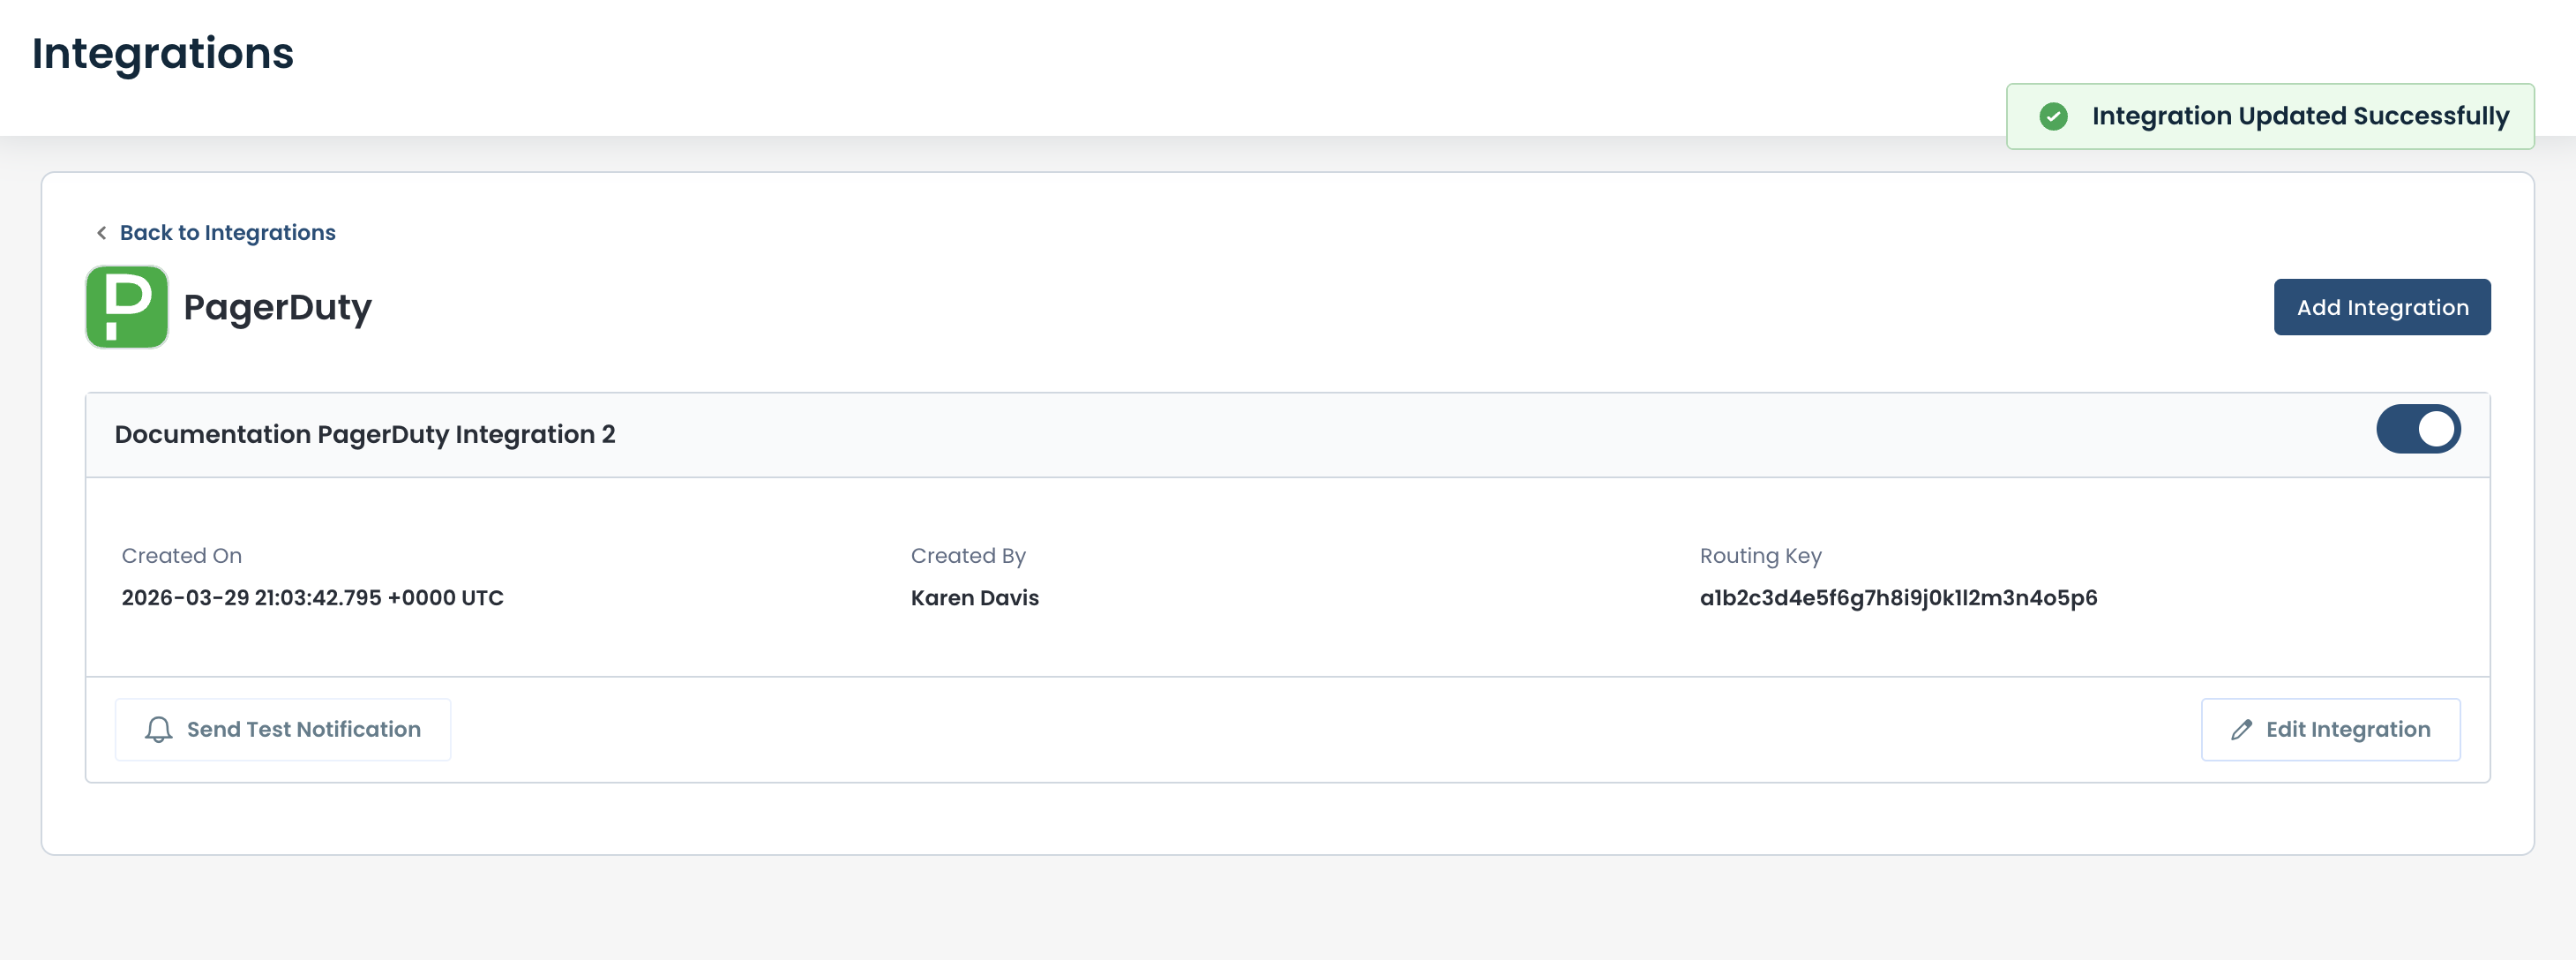
The integration will be updated and you will receive a green banner stated that it was successful.
Deleting an PagerDuty Integration
To delete an existing PagerDuty integration, from the PagerDuty Integration page in the Graphiant Portal, click 'Edit Integration'.
.png)
Click 'Delete'.
The chosen PagerDuty integration will be deleted and no longer appear in the integration table.
Alert:
There is no warning message when 'Delete' is clicked; the integration will be deleted immediately. Take care to delete the intended integration.
Integrating Using a Generic Webhook
Should you need to integrate alarm notifications with a different application than those represented above (for example Slack or Rootly), Graphiant offers a generic webhook interface.
Locating Webhook Integration in the Graphiant Portal
From the Integration page, select 'Webhook'.
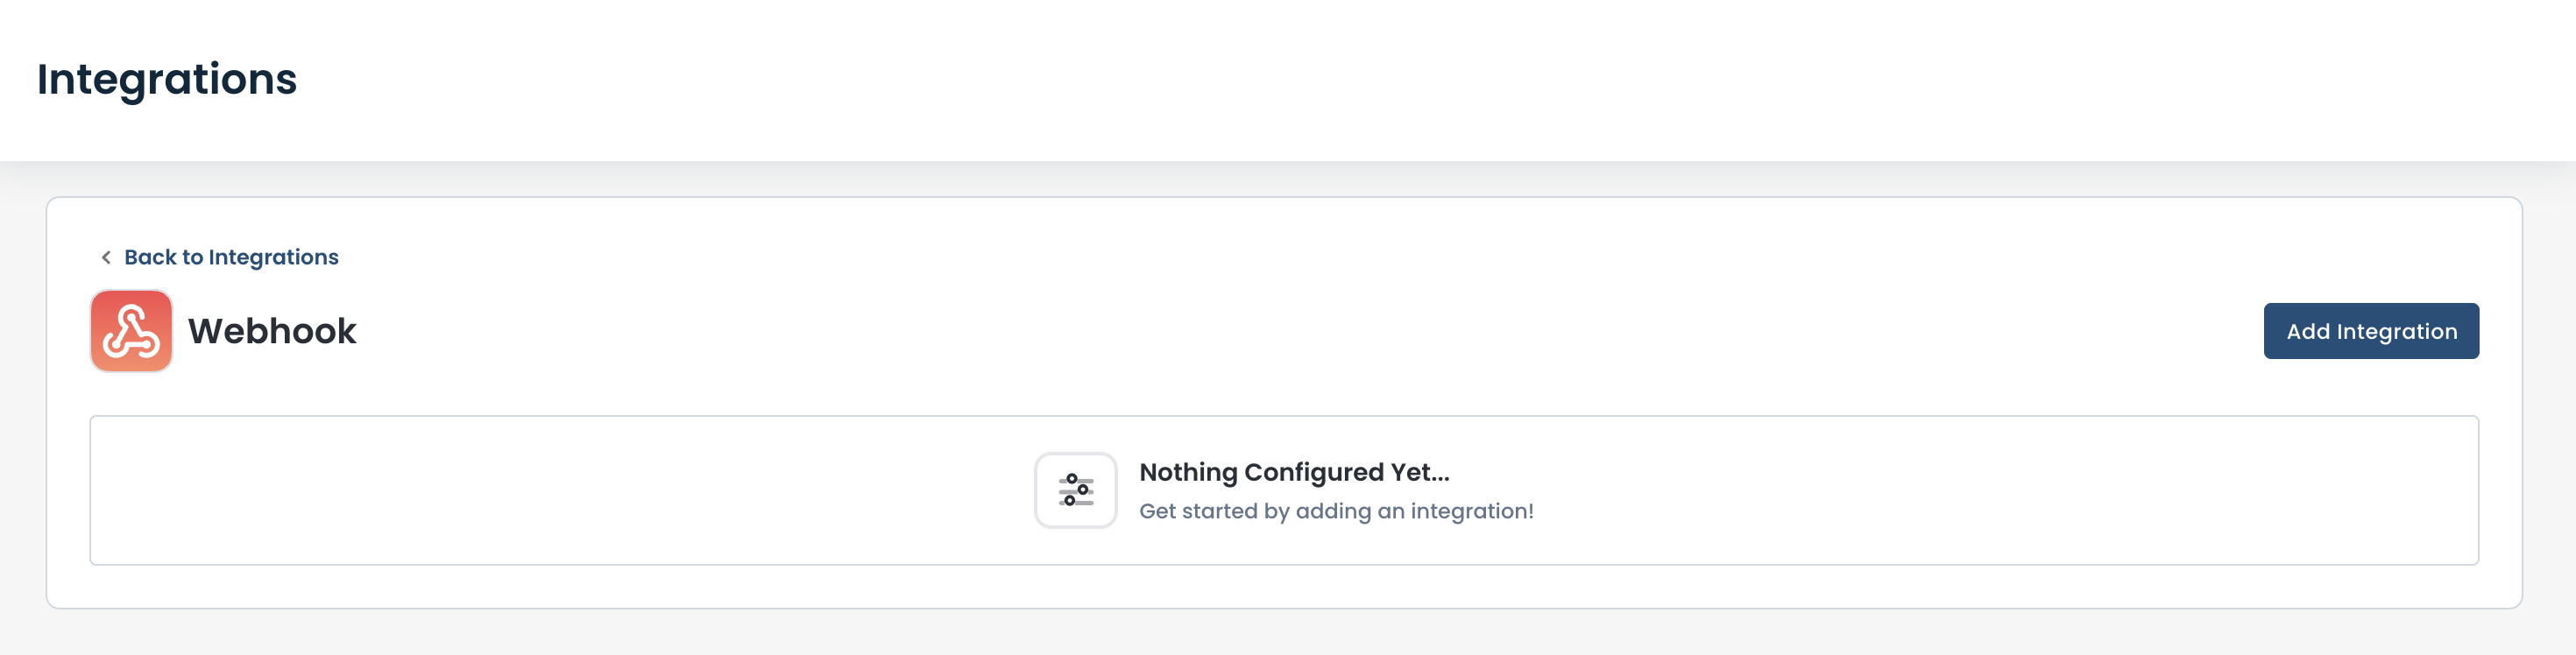
This opens the page to configure and edit integrations using a generic webhook.
Here will also be visible all previously created application integrations you created using a generic webhook, and their active/inactive status.
Configuring a Webhook Integration
To add a new webhook integration, click 'Add Integration' at the top right.
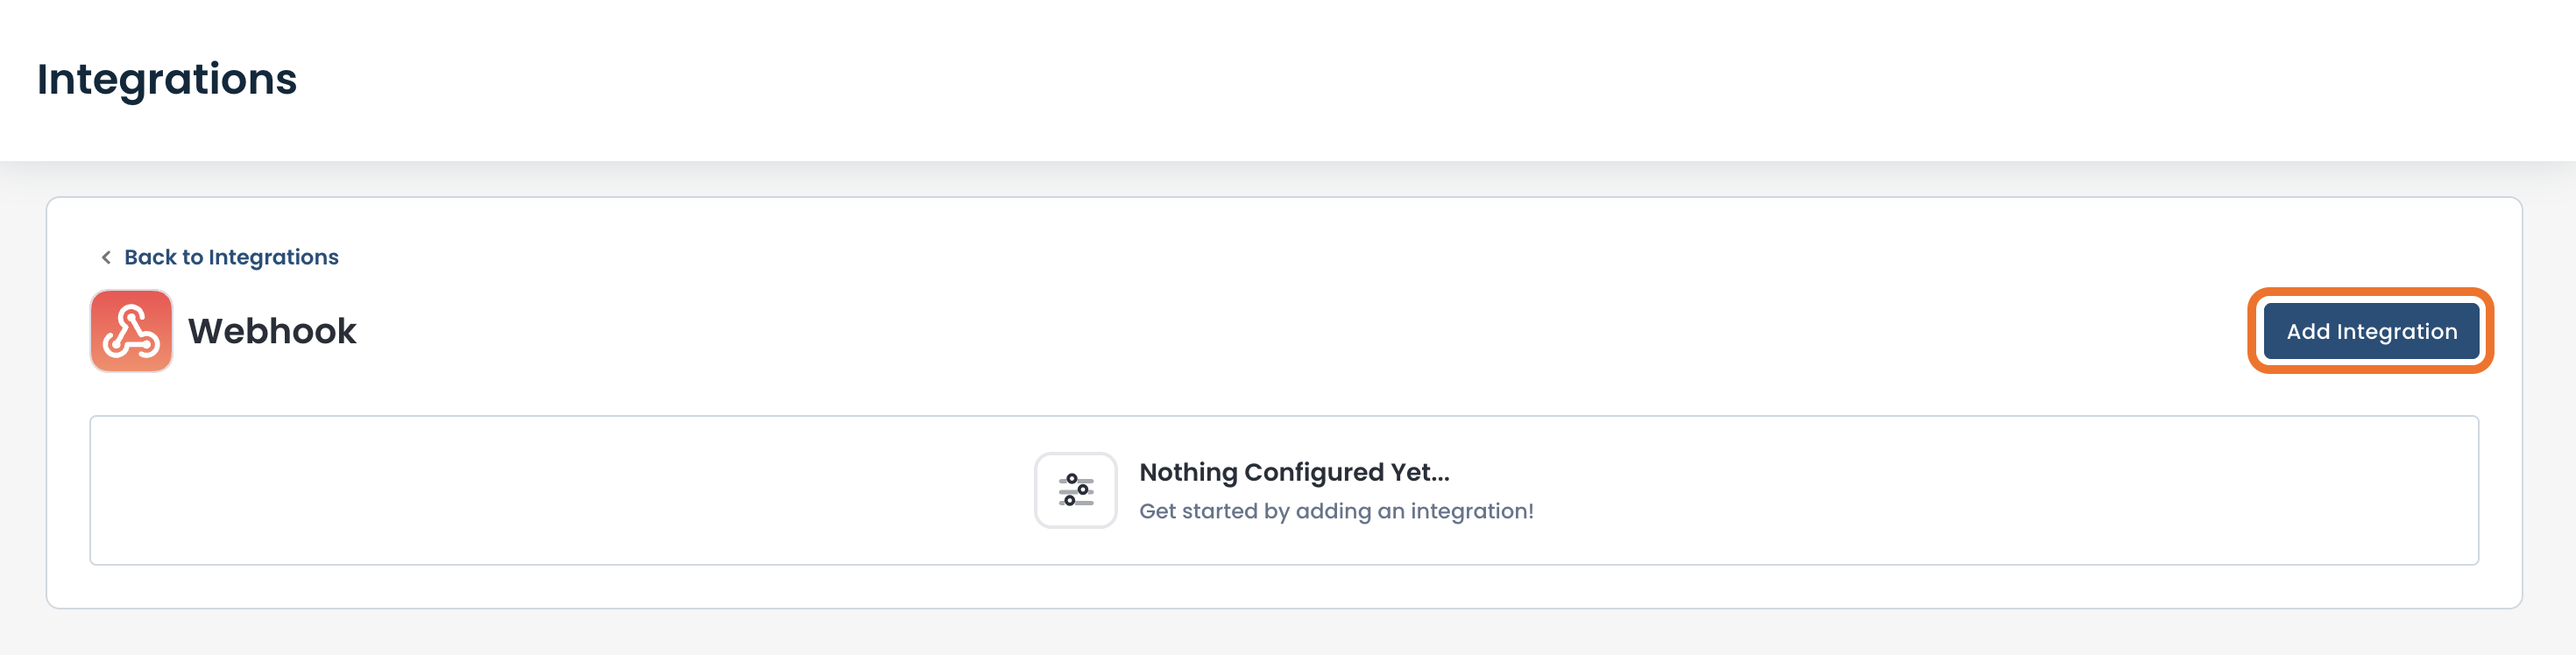
The new integration fields will appear above any existing integrations.
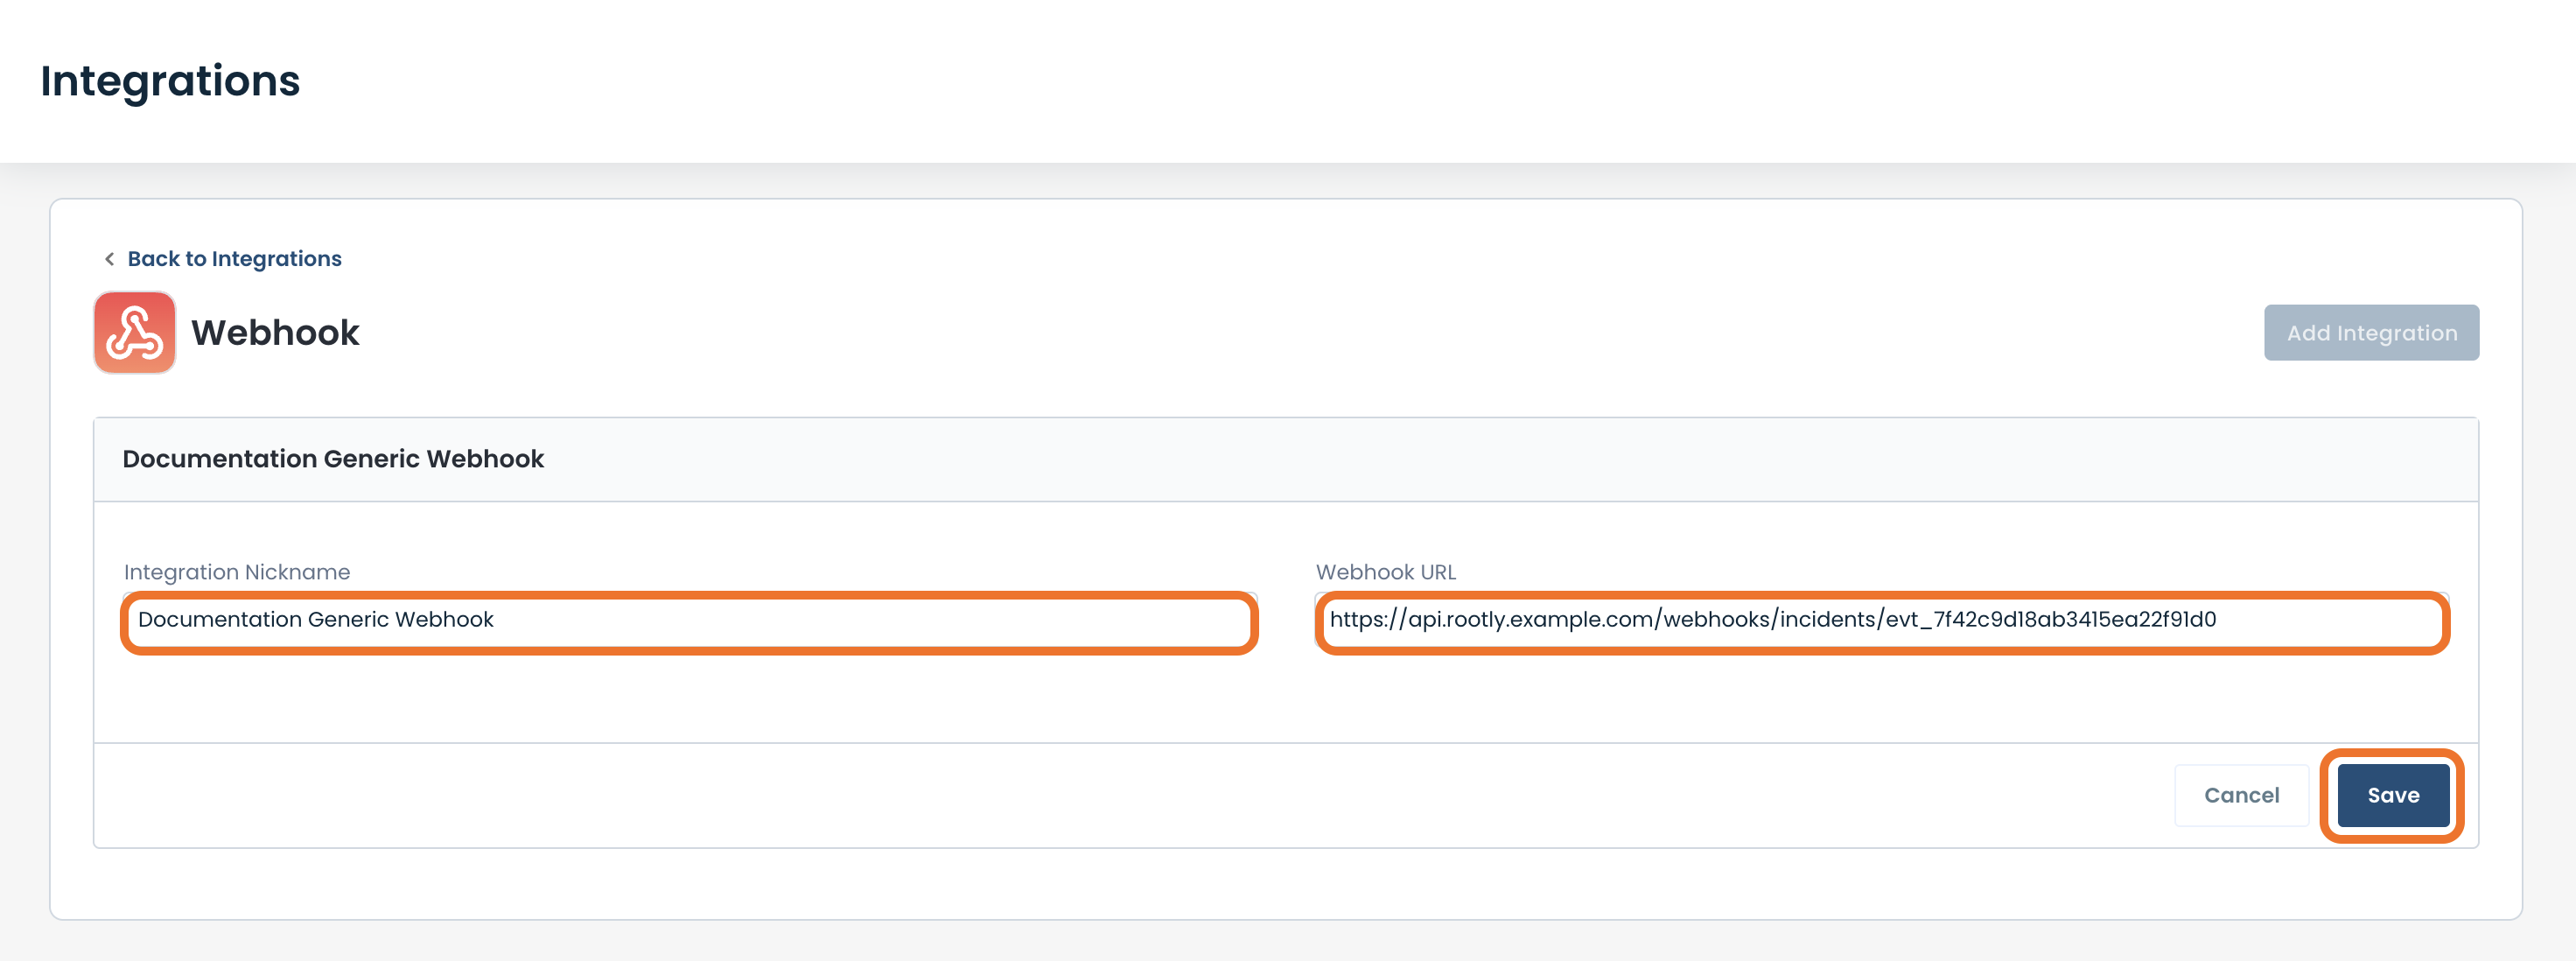
Complete the following fields:
Integration Nickname: The name defining the use of the integration.
Routing Key: The incoming API Key from the desired app.
Note:
The Integration Nickname field is pre-filled with the Integration ID. Should a name be desired for ease of the user that is more specific to the use of the integration, enter it here.
Click 'Save'.
The new Webhook Integration configuration is complete.
Note":
By default, the new integration is toggled to be on. If for any reason the integration is not to be used, click the toggle to be off.
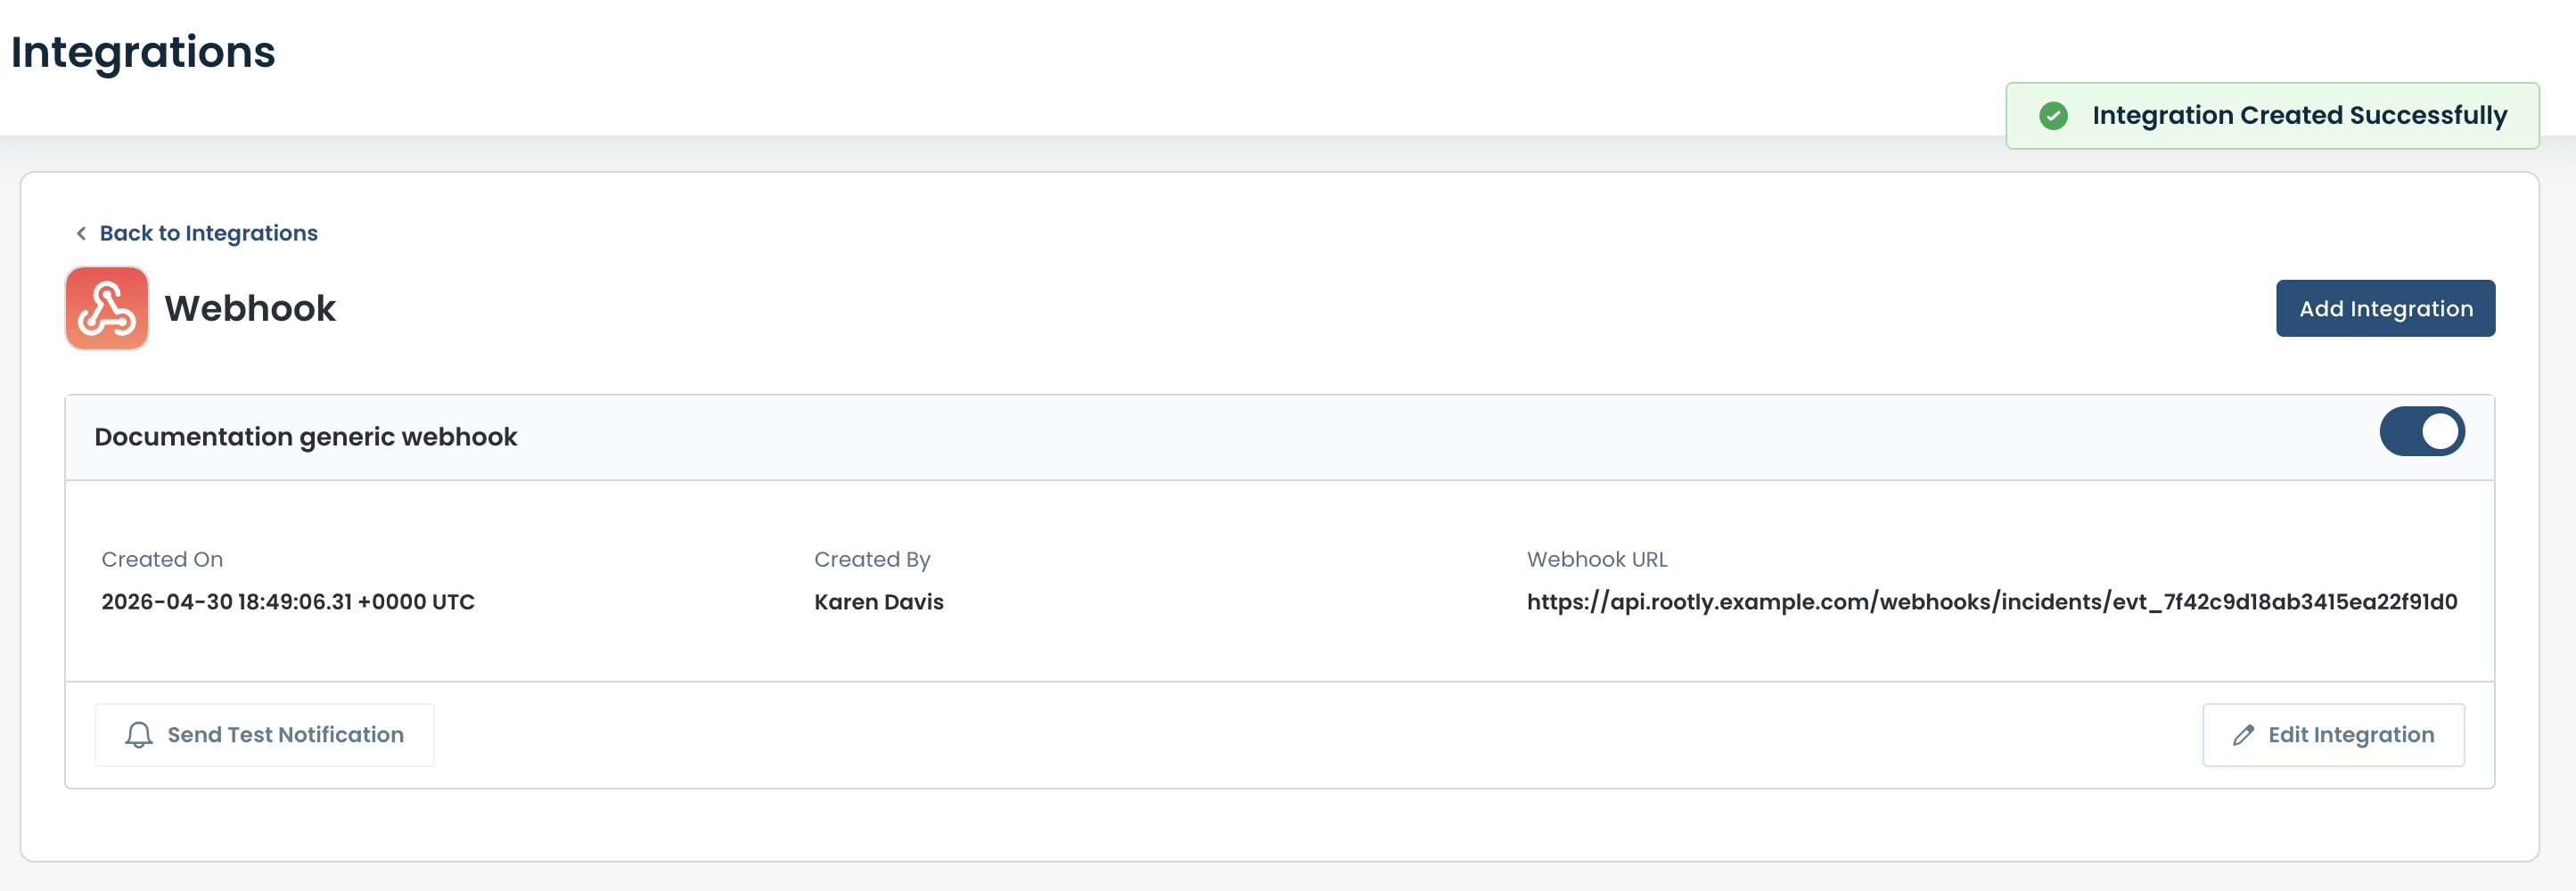
The Webhook will now show as "Active" on the Integration page when the integration is complete and toggled on.
Note:
Be sure to configure notifications to be sent to your application for any alarms needed.
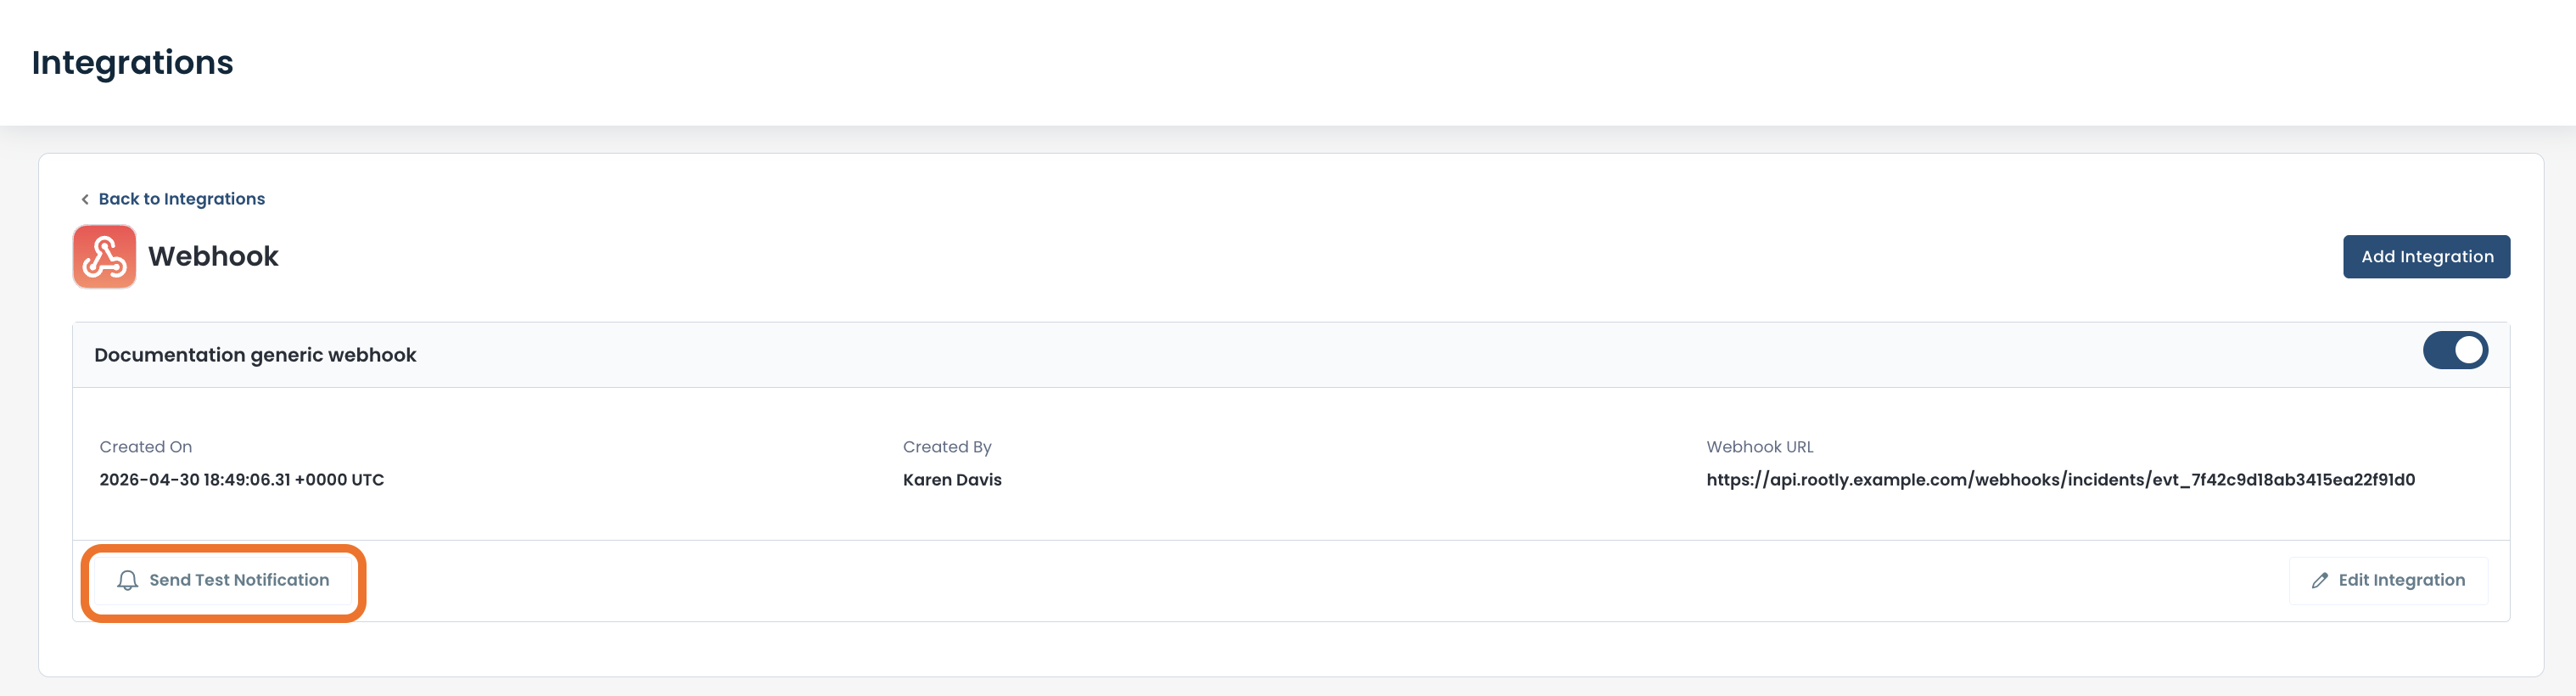
The webhook integration can be tested to ensure that the integration is working by clicking 'Send Test Notification'.
This will prompt a test message from Graphiant to be received by your application via the integration.
Editing an Existing Webhook Integration
To edit an existing webhook integration, from the Webhook Integration page in the Graphiant Portal, click 'Edit Integration'.
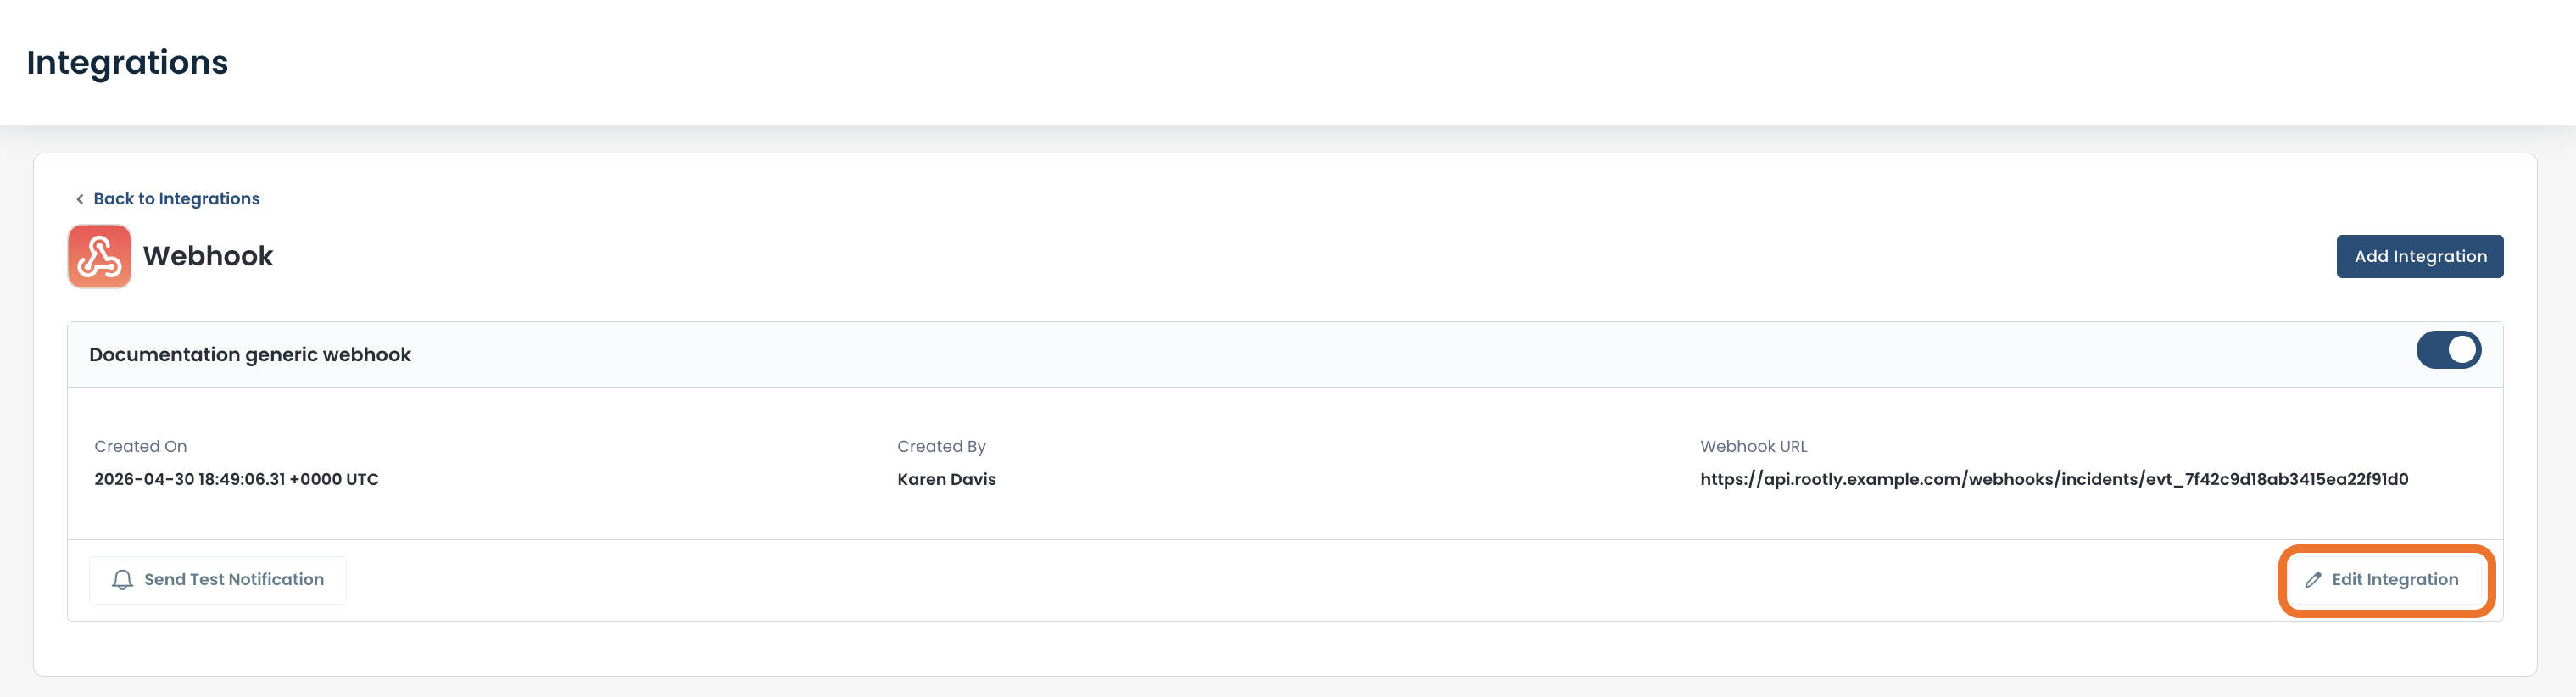
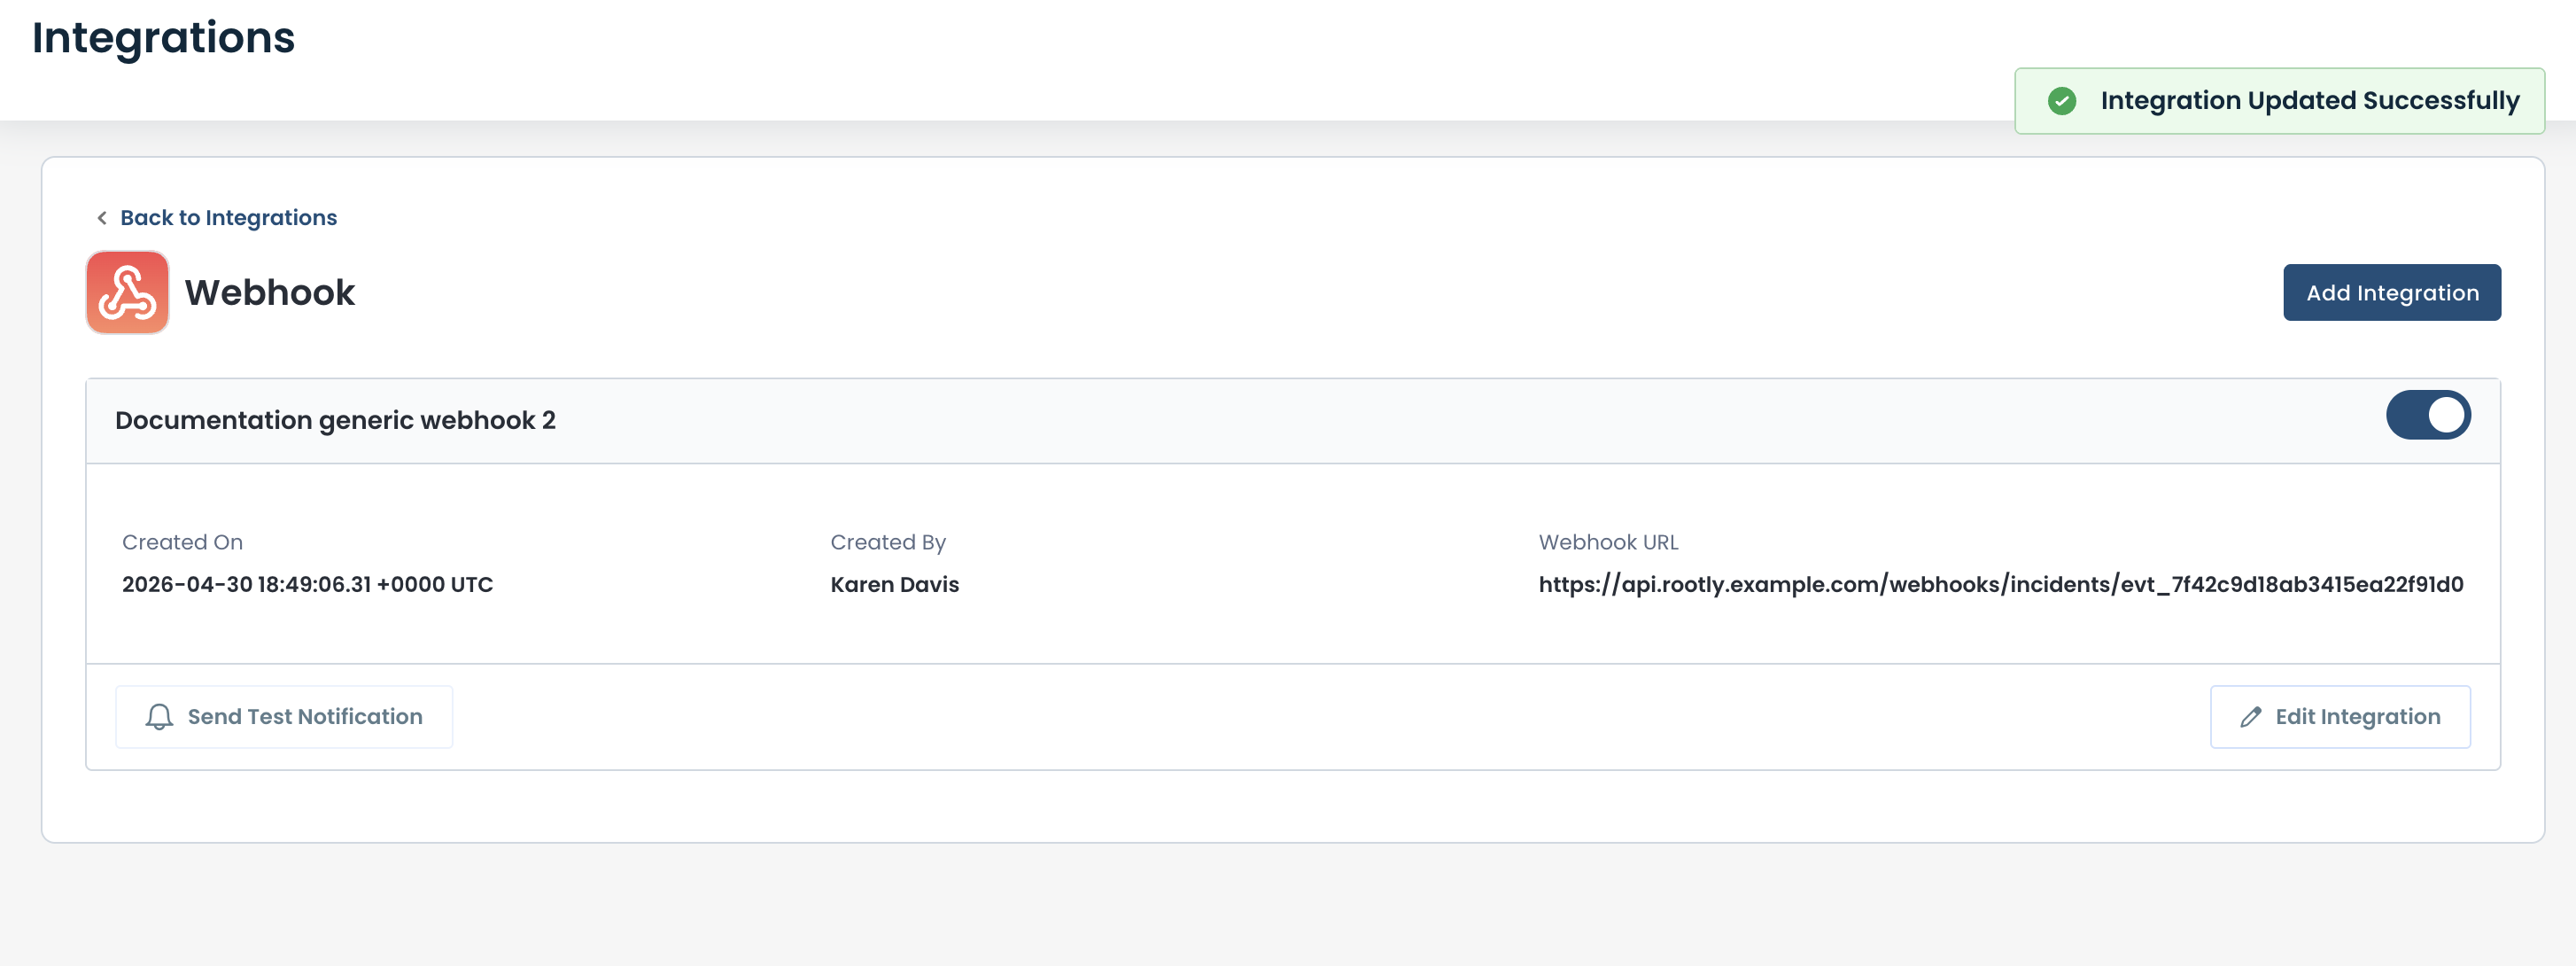
Edit the necessary fields; click 'Save'.
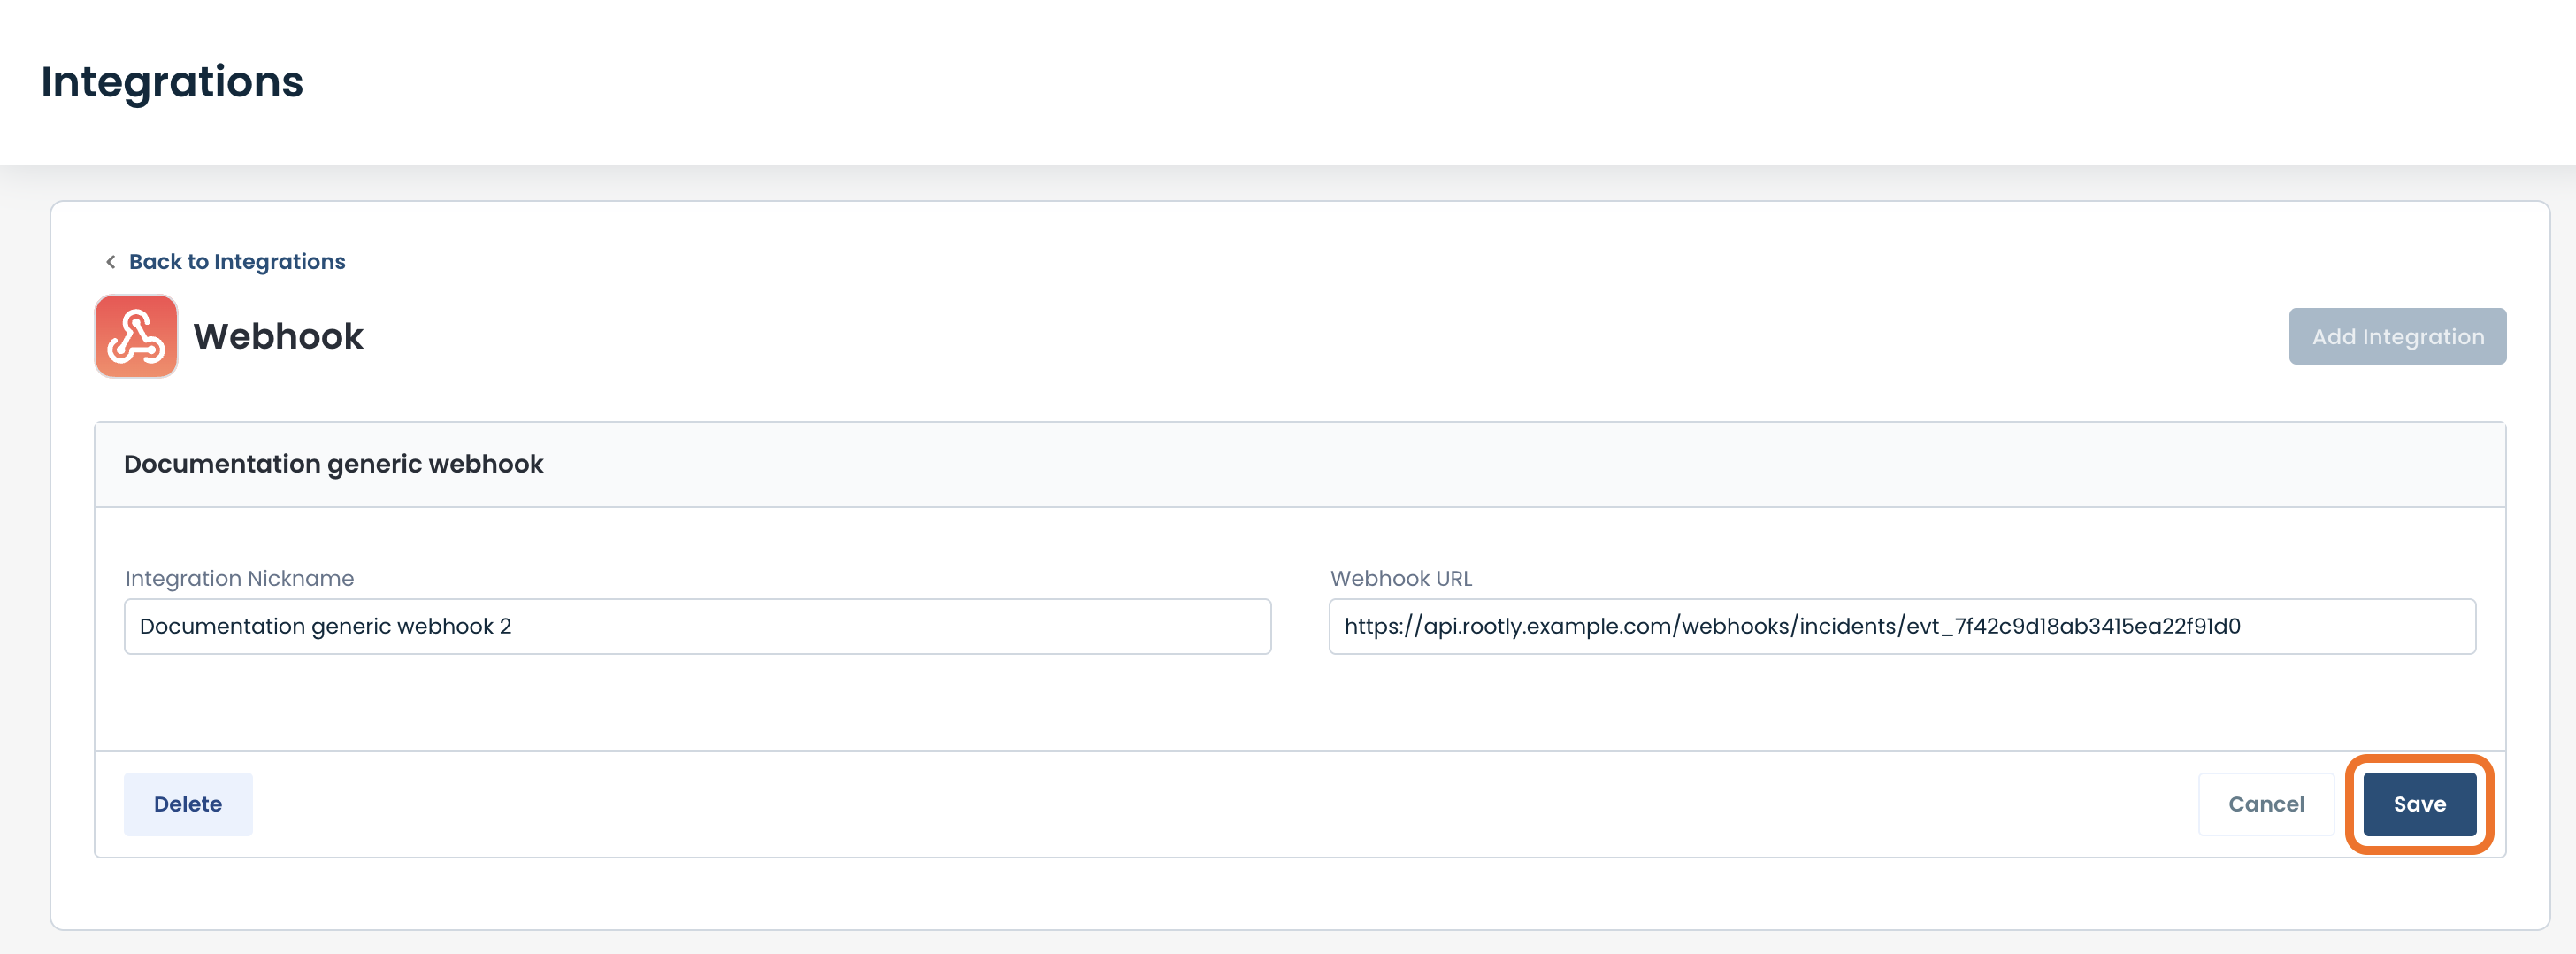
The integration will be updated and you will receive a green banner stated that it was successful.
Deleting a Generic Webhook Integration
To delete an existing webhook integration, from the OpsGenie Integration page in the Graphiant Portal, click 'Edit Integration'.
.png)
Click 'Delete'.
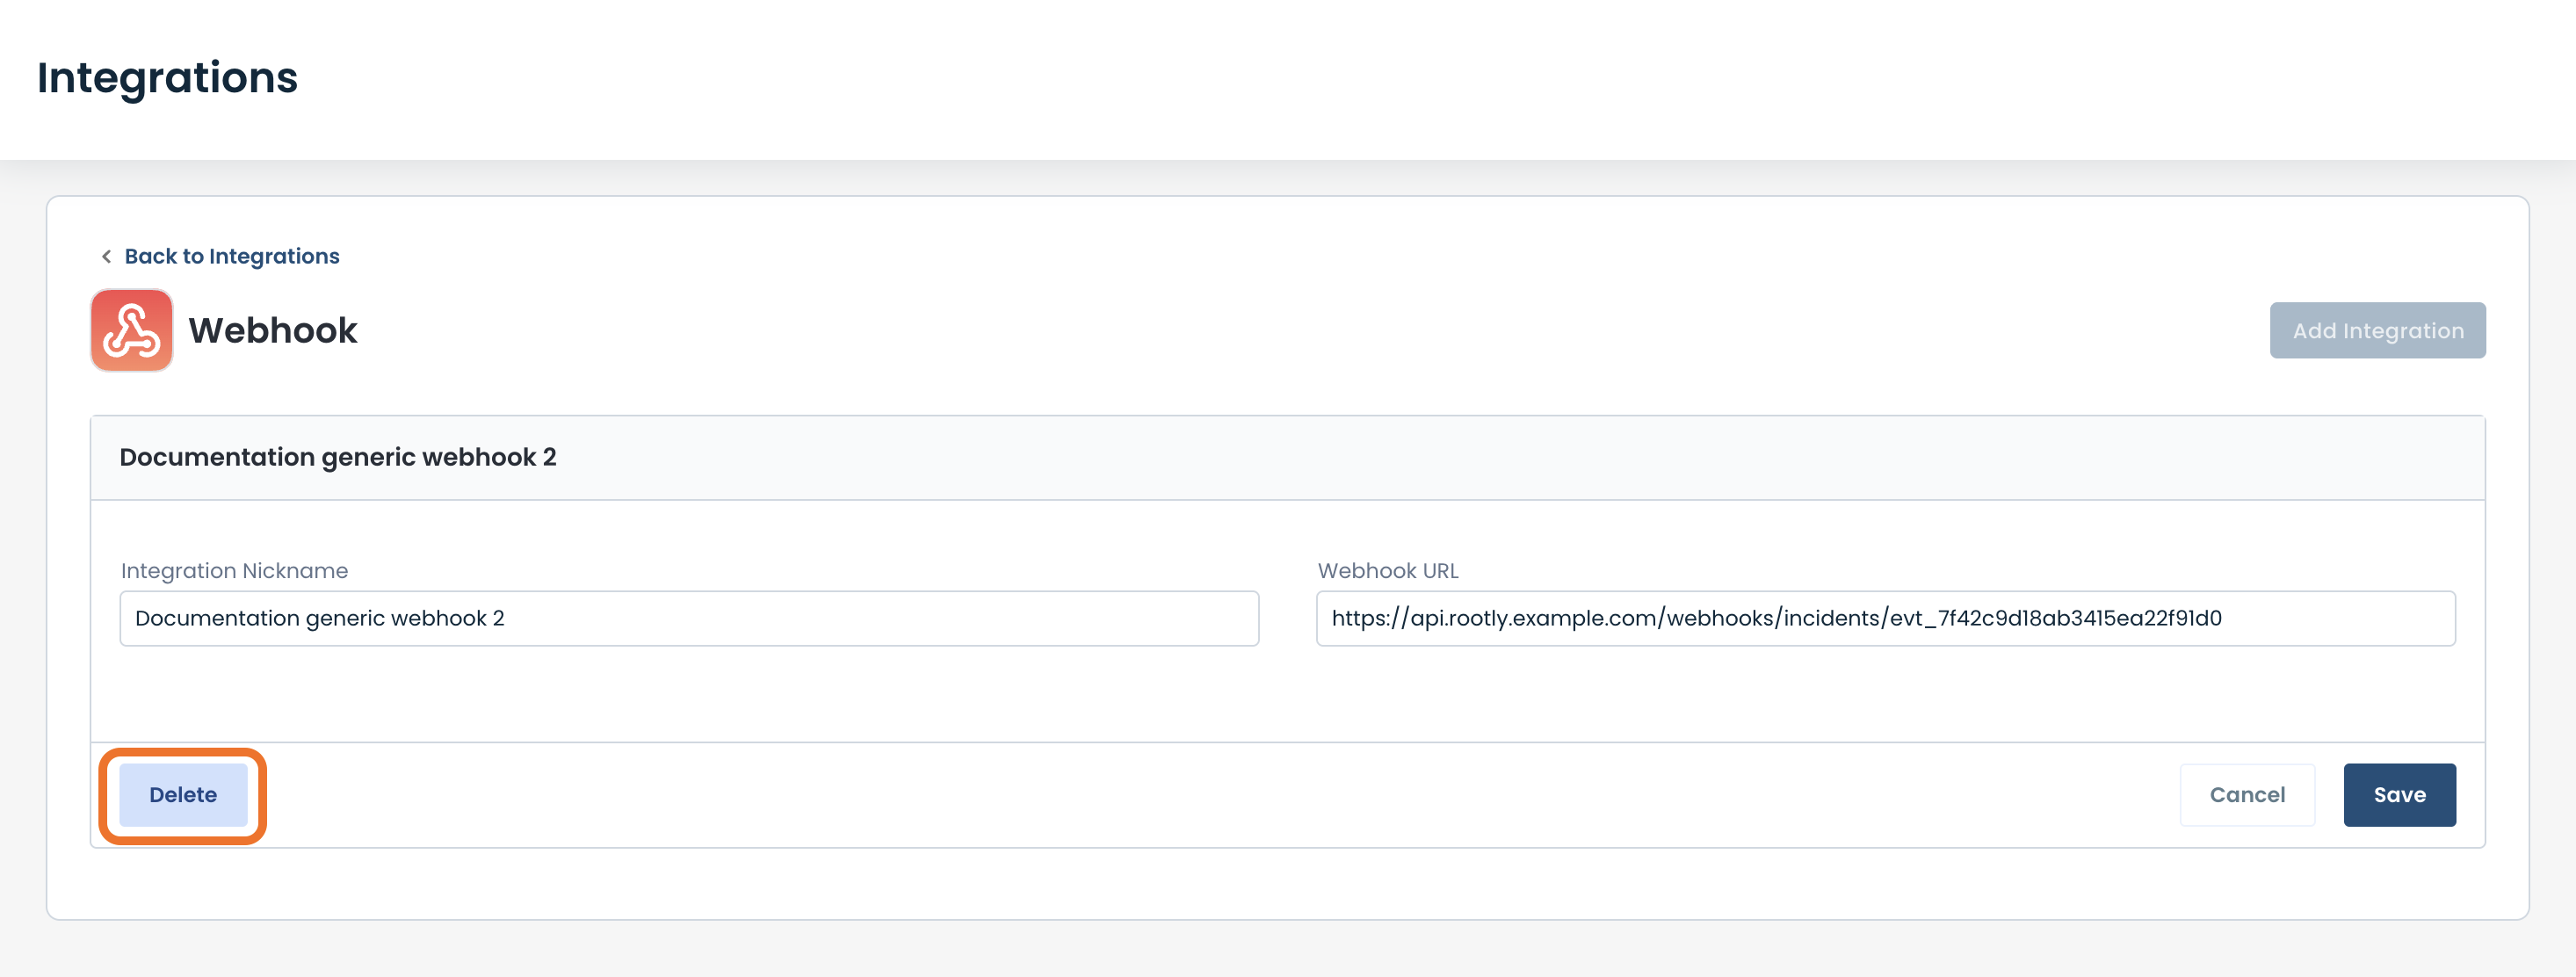
The chosen webhook integration will be deleted and no longer appear in the integration table.
Alert:
There is no warning message when 'Delete' is clicked; the integration will be deleted immediately. Take care to delete the intended integration.
Receiving Alarm Notifications
Once notifications have been configured and an alarm is triggered, an email will be received by the selected user from the alarm notification configuration.
The following information regarding the triggered alarm will be included in the email:
Severity: Level of severity (Critical, High, Medium, Low)
Alarm Type: Name of the alarm for which the notification was sent.
Alarm Detail: Specific information about the event that triggered the alarm.
Entity: The item on which the alarm is occurring; i.e. site, device, interface etc.
Most Recently Observed: Date and time of the latest occurrence of the issue.
First Observed: Date and time of the first occurrence of the issue.
.png)
A URL will also be included linking directly to the Alarms page in the Graphiant Portal.
From there, troubleshooting and remediation of the alarm can be initiated.
Muting a Notification
If a notification is being sent, and for any reason is desired to not send -- for example if the issue is known and currently being remediated -- that notification can be muted.
Should a notification need to be muted, however temporary, click the 3 dots; click 'Mute Notification'.
.png)
This will bring up a confirmation modal for muting the notification.
Notes (optional): Enter information as to why the notification is being muted, so that other users will have the detail.
Click 'Confirm'.
.png)
The notification will no longer be delivered, as it is not being triggered to be sent.
Muted Notification Details
The detail of the muted notification can now be found in the Notification tab of the Alarms page.
.png)
From here, you can view the details of any device that has disabled the alarm associated with that rule.
Scroll to the right; click on the number value of Excluded Entities for the desired rule.
.png)
Excluded Entities are any item which is not triggering a notification; i.e. site, device, interface etc.
Note:
The entities for a notification are hierarchical; if a notification is muted for the site, everything included in that site will also have that notification muted - i.e. the Edge devices and interfaces, for example.
The Excluded Entities table includes the following:
Enterprise: Company name
Device: Name of the device which has had the notification muted
Device interface: Interface attached to the device (if there is one)
Peer: BGP peer of the device (if it has one)
Peer interface: Interface attached to the BPG peer (if it has one)
Notes: The text entered in the 'Notes' field upon muting of the notification
.png)
Unmuting a Notification
A notification can be unmuted from either the Excluded Entities table, or the Alarms table.
Unmuting a Notification from the Excluded Entities Table
From the Excluded Entities table, check the box of the desired notification to which the alarm will be re-enabled.
.png)
Note:
Should there be multiple excluded entities, as many devices as desired can be selected to be re-enabled .
Once checked, a 'Re-enable' button will appear at the top of the table.
Click 'Re-enable'.
.png)
Once a notification has been unmuted / re-enabled, it will no longer appear in Excluded Entities.
.png)
The notifications will now start to be received for that alarm.
Unmuting a Notification from the Alarms table
On the Alarms Page, in the table at the bottom locate the alarm for which to have the notification unmuted.
.png)
Click the 3 dots to the right of that alarm.
Select 'Unmute Notification'.
.png)
A Confirmation screen will appear.
Click 'Confirm' to unmute the notification.
.png)
The notifications will now start to be received for that alarm.
'Rules' Tab
Each Alarm has a Rule that triggers it.
The information for each Rule is in the Rule Table.
From the Alarms landing page (or the 'Notifications Management' page), click the 'Rules' tab.
.png)
This brings up the Rules Table.
The table provides the following information:
Plane: The classification for which the rule is written.
Category: The type of event/issue encompassed by the rule.
Alarm-Set: Parameters to be met for an alarm to be triggered.
Alarm-Clear: Parameters to be met in order for a triggered alarm to be cleared.
Priority: Level of importance of the rule:
PØ = Critical
P1 = High
P2 = Medium
P3 = Low
.png)
To enable/disable a Rule, click the Toggle to the right of the Rule.
.png)
Note:
Rules can be enabled and disabled here in the Portal. Graphiant Customer Support can create a new rule or fine-tune an existing rule if necessary; i.e. if a rule needs to be reprioritized as it would be more helpful. Graphiant Customer Support can be reached here.