What is Graphiant Observability?
Monitoring of networks is invaluable.
So is quick action.
While Graphiant monitors networks, gathering and analyzing data to provide insights into network operations, we also offer alarms that provide rapid visibility for prompt responses to potential issues.
Graphiant Observability is comprised of the intuitive and readily available information in our Site Health Dashboard, along with instant notification of alarms. Together, these allow administrators to not only have a bird's eye view into the real-time, up to the minute health of all of the sites in your network; but also to pinpoint, swiftly troubleshoot, and remediate issues when they occur. This significantly contributes to enhancing network efficiency and minimizing work downtime.
Graphiant Observability is an essential component of proactive network management.
Graphiant Observability Overview
Note:
This article is an overview of both aspects of Graphiant Observability: the Site Health Dashboard, and the Alarms and Notifications.
Video Overview
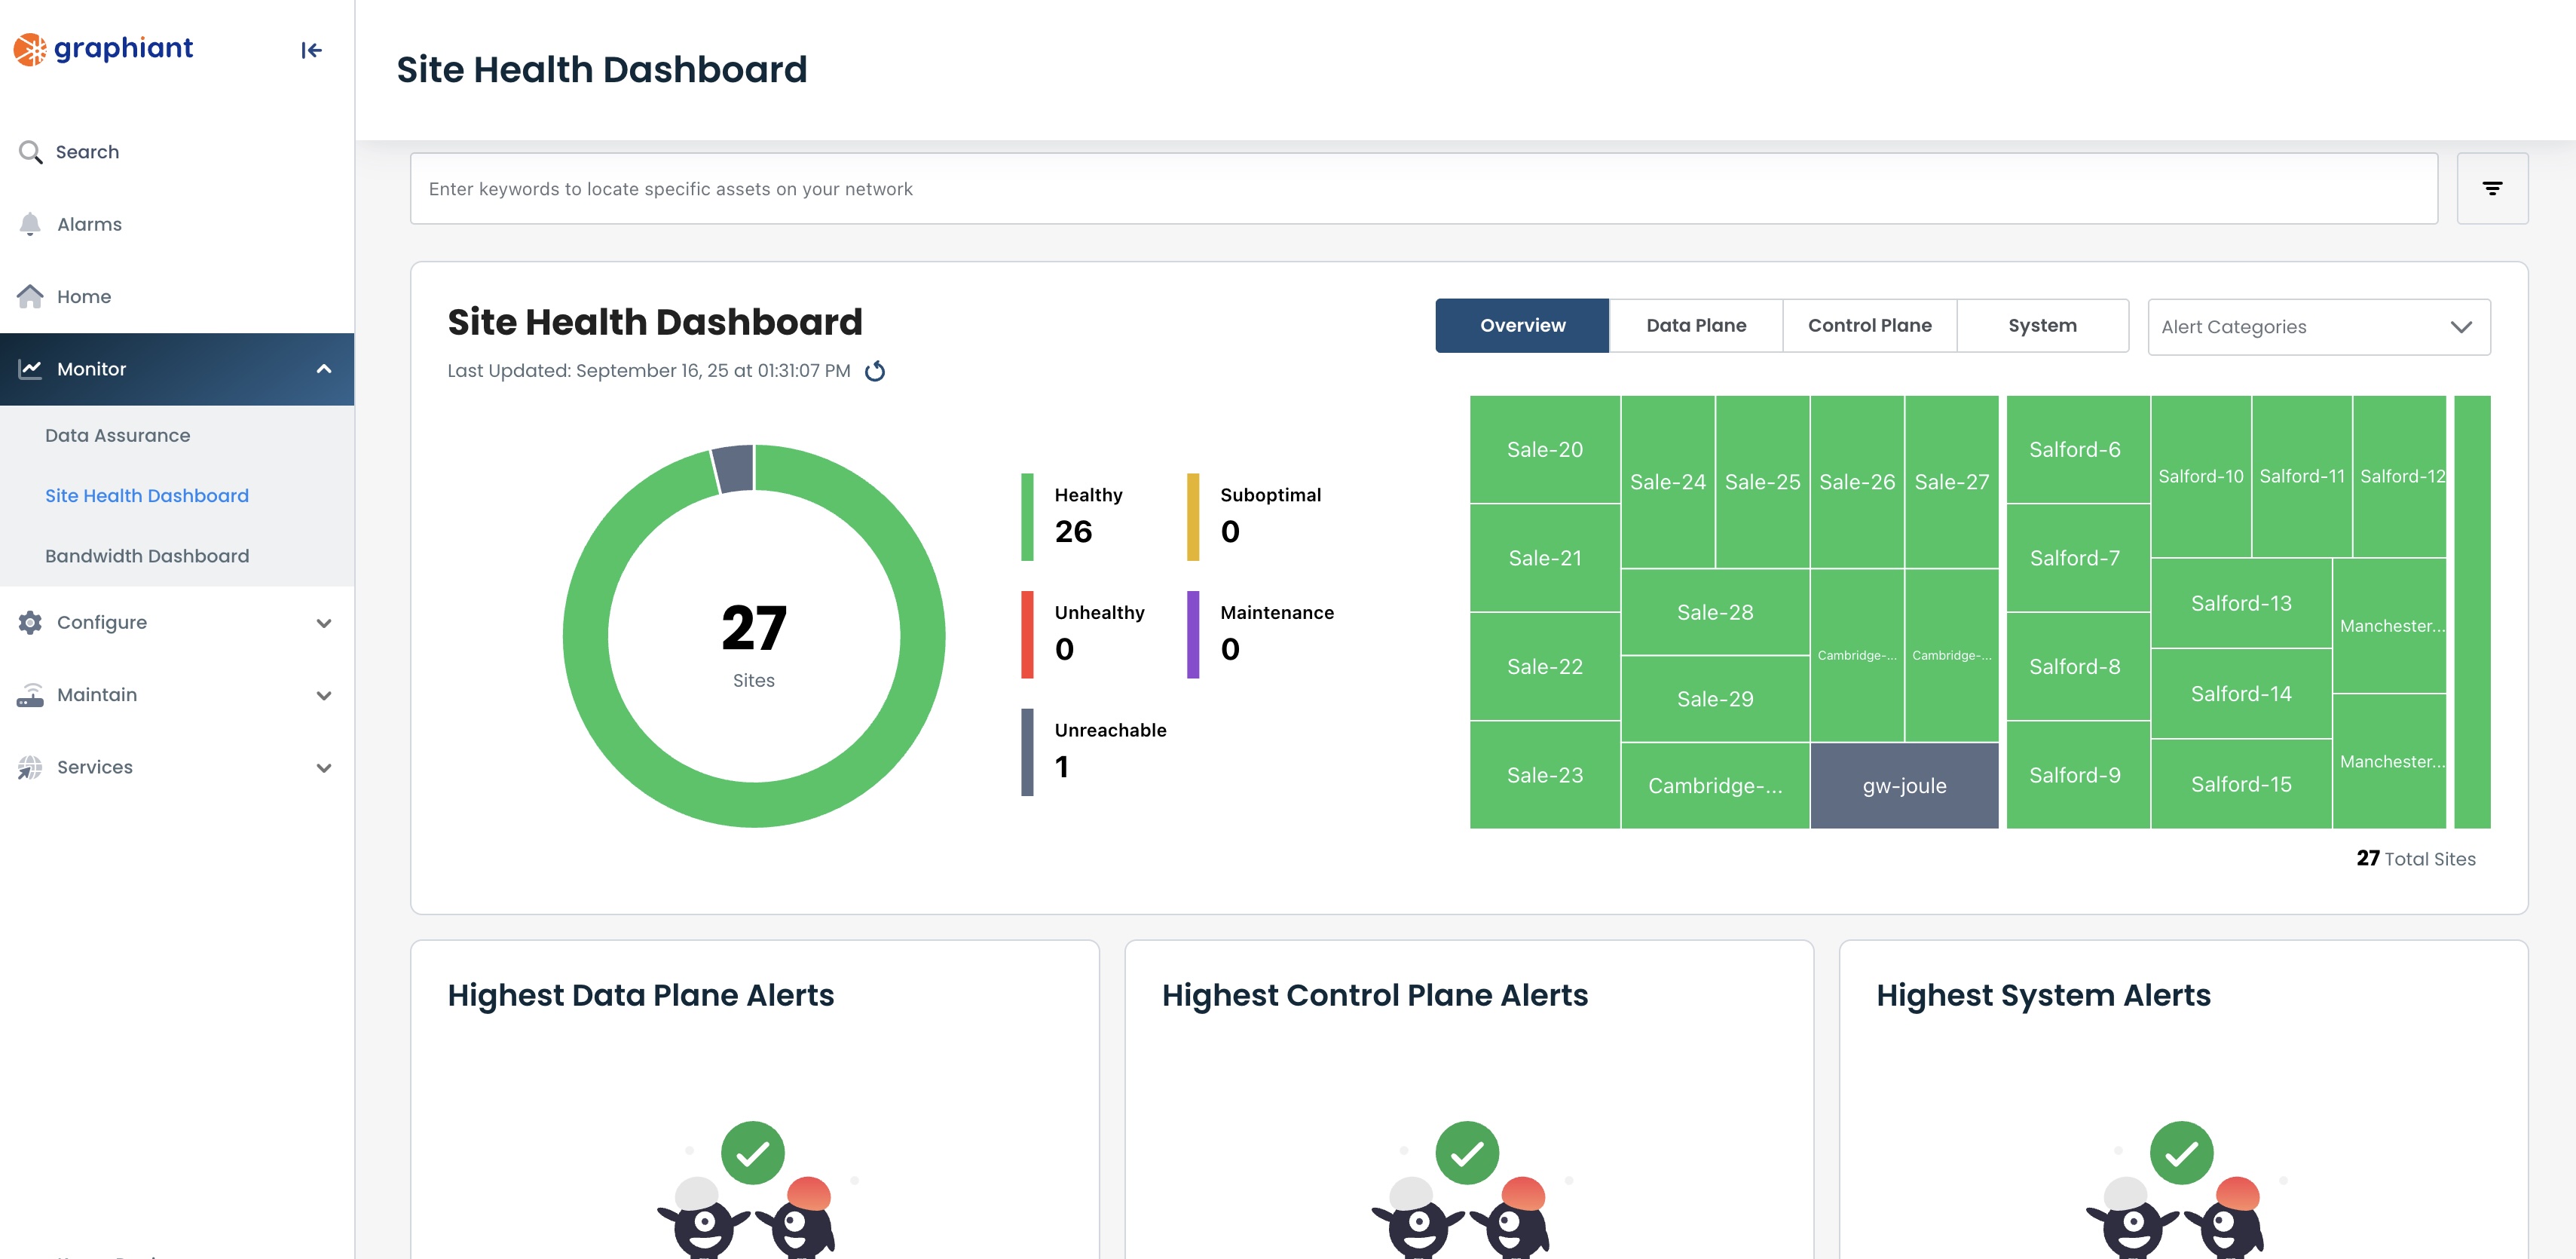
Site Health Dashboard
The Site Health Dashboard is located under 'Monitor'; 'Site Health Dashboard' in the left sidebar.
From here, you can see the health of every site in the network at a glance, customize your view to instantly get the data that you need, as well as have the ability to visualize the health overview of all of the Edges in a particular site with just one click.
Overview
The landing page for the Site Health Dashboard is the Overview screen.
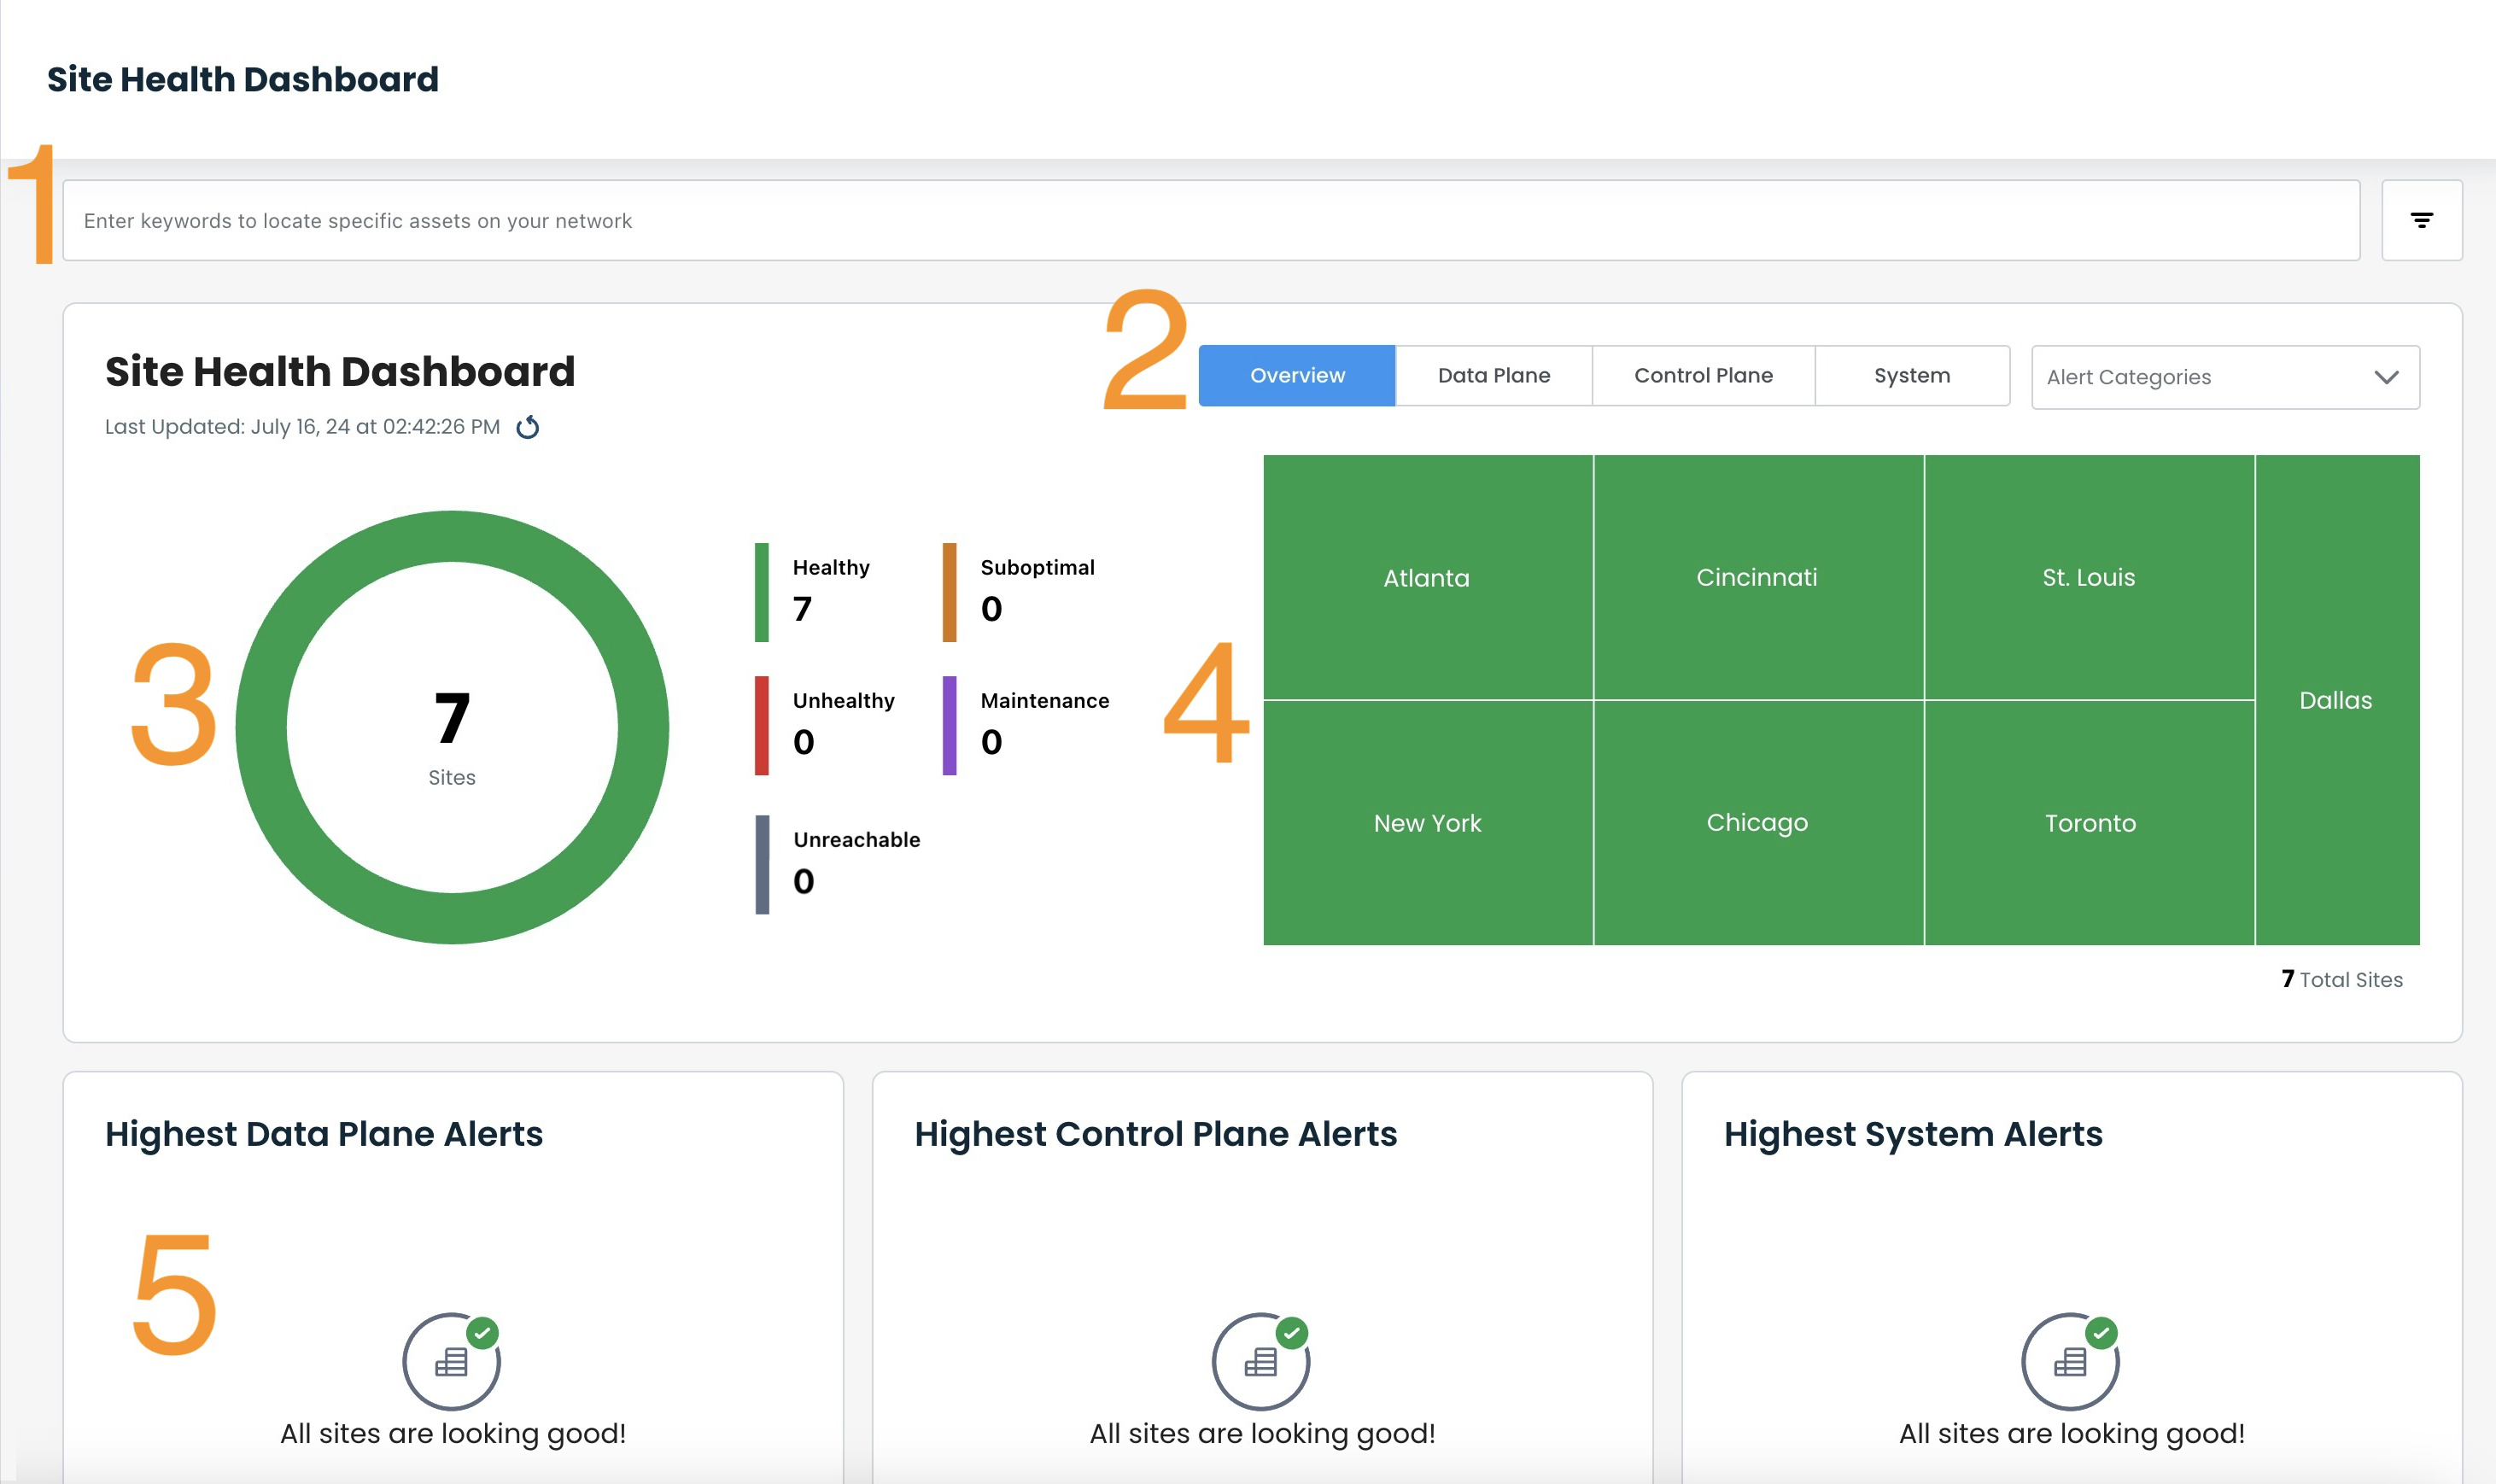
The color-coded health status indicators across the dashboard are as follows:
Healthy: Green
Suboptimal: Orange
Unhealthy: Red
Maintenance: Purple (a site will have this indicator if one or more of its Edges are in Maintenance Mode)
Unreachable: Gray (a site will have this indicator if metrics are not being received)
The Overview page is laid out in five sections:
Filter Bar (top of page): Information entered / selected here will determine the information shown on the entirety of the page.
Plane Selection and Alert Categories (uppermost right): The selections made here will narrow down the information shown to drill down even further to exactly what you are most interested in.
Donut Chart & Legend (upper left): Represents the health of all of the sites, including the number of sites in each level of health.
Donut Chart: Clicking on a color(s) will filter the heat map to show only sites with that health status(es).
Legend: Clicking on a color(s) will filter the heat map to remove all sites with that health status(es).
Heat Map (upper right): These tiles are both visual indicators of the health of the sites, and direct links to the health of the individual site and the Edges within that site.
Network Plane Alerts (bottom): Any alerts of issues within each plane of the network will be represented here.
Hovering over each site in the heat map provides a quick look at the site, specifically:
Site Name
Overall health
Region
Individual Health statuses of:
Data Plane
Control Plane
System
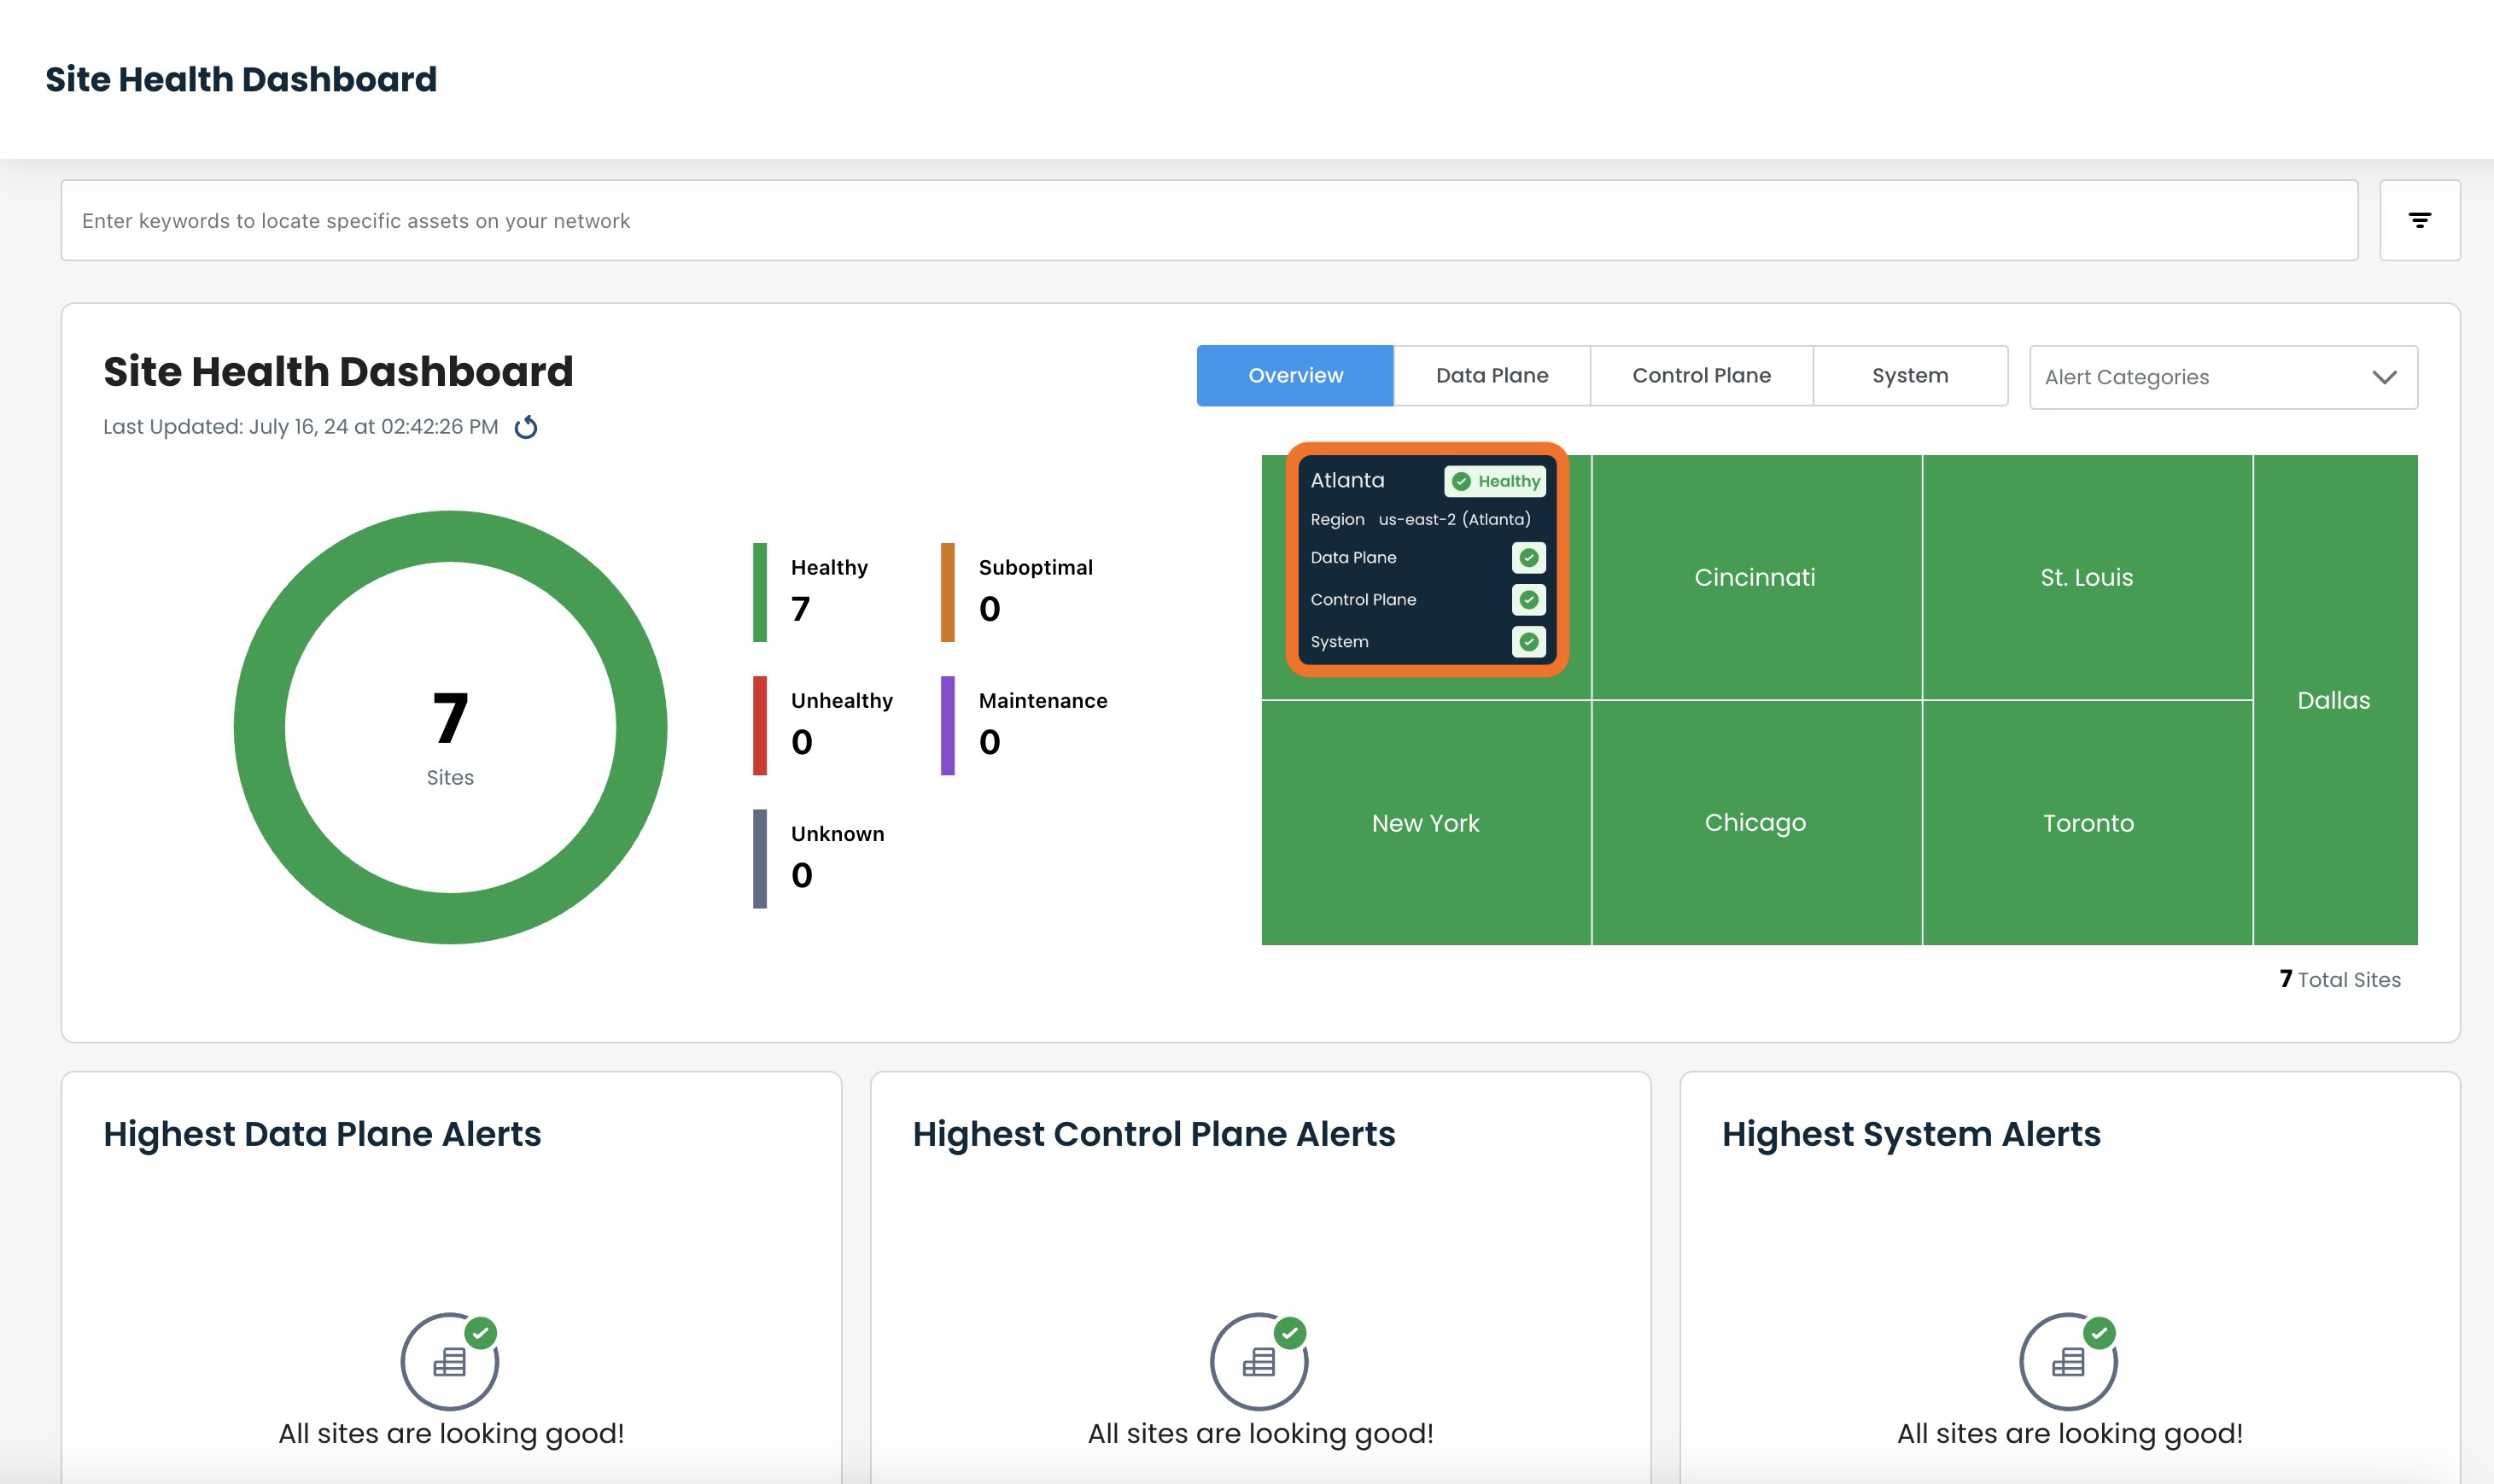
Each of these tiles is also a clickable button, a direct link to the health of the individual site and the Edges within that site.
Should issues arise within a network, the highest alerts will be represented in their respective planes of the network and would appear similar to this:
.png)
The site names and number of alerts within those sites are shown here.
Each bar is a link that takes you directly to the current issues of the site that has the alert(s).
Site-Level Information
Clicking on any of the Site tiles, or a plane alert bar, will take you to the information at the individual site level.
Every page within this area will contain the following information, whether you are on the Issues page, or move to Data, Control, or System planes:
Site Name and Health
Edge Selector: If multiple Edges are attached to the site, the data shown is that of the highlighted Edge here.
Time Picker: Narrows down the data retrieval to the time frame selected; default is "Past 15 minutes"
Plane Selector: From here you can navigate directly to the Data, Control, or System planes.
Edge Health and software version
View Site Details link: Further information is available in the Site Dashboard with details on utilization and connectivity for the site.
Device Troubleshooting link: For further testing and exploration of an issue, this opens the Troubleshoot tab for the Edge in the Graphiant Portal
Issues
The Issues page is the landing page for the selected site, which holds detailed information for any current issues in the network.
.png)
If an Issue is known to the user to not be of concern (if an Edge is undergoing testing, for example), it can be disabled by clicking the [-] to the far-right of that issue.
.png)
The issue will no longer be reflected in the Site Health Dashboard heat map, but will still remain in the Issues Table for ease of location should the issue need more attention.
The [-] will now appear as a [+] for re-enabling that issue if desired.
Data Plane
The data plane tab shows the status of, and information about, the traffic between the Edge and the Graphiant Core, with regards to:
Data: Down Transitions
QoE
Data: Loss Value
Latency and Jitter
.png)
Control Plane
The control plane tab shows information about the connections to the Edge with regards to both Portal and Control data.
.png)
System
The system tab shows the status of, and information about, the system resources of the Edge.
The Stats graph gives percentage utilized on the following three items:
CPU
Memory
Disk
System Details contain the following:
Up Time
Last Reboot Reason
Crashes (last 24 hours)
.png)
Alarms and Notifications
The Alarms page is located under 'Alarms' in the left sidebar.
Graphiant Alarms give you the ability to set Notifications that matter the most for your network.
When an event occurs that triggers the alarm, an alert vie email, Teams, and/or OpsGenie promptly highlights the issue and brings it to your attention quickly.
Detailed information describes the event, and a URL links you to Graphiant's Alarms page, showing any active alarms.
From the Alarms page, you are able to select the Troubleshoot option, which takes you to the plane of the network for which the alarm was generated; from there you can quickly see the event and implement the best remediation.
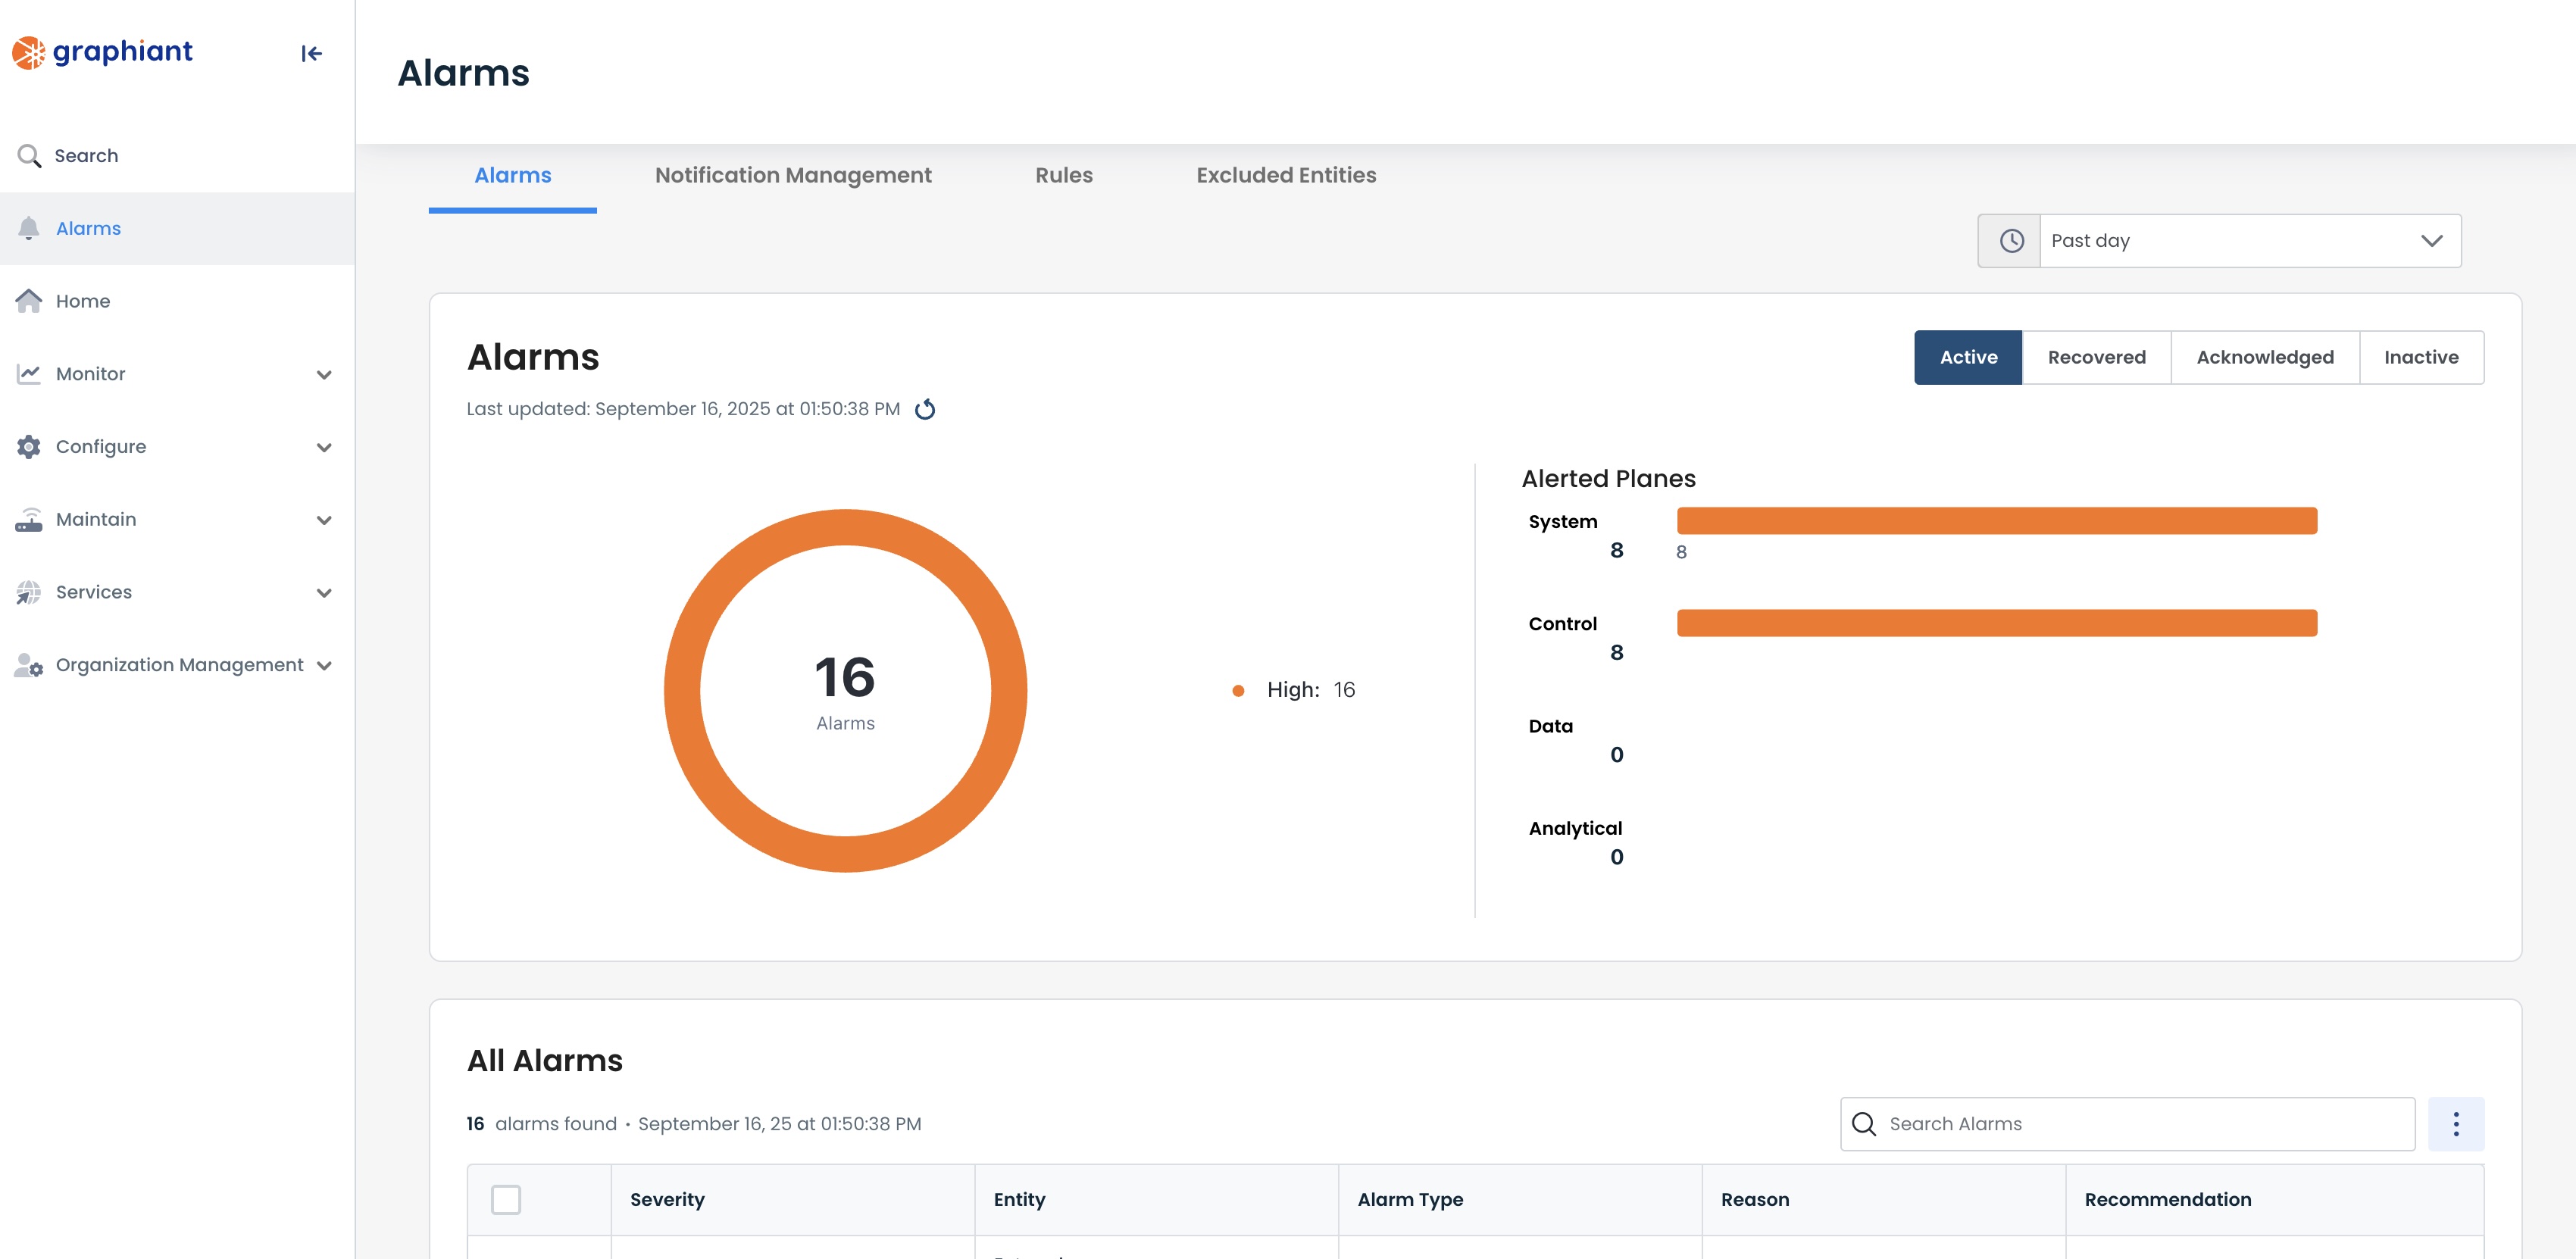
Alarms Landing Page
The landing page for the Alarms page is the Active Alarms screen (all current alarms that have not been mitigated and cleared).
Alarm severity and corresponding colors are as follows:
Critical: Red
High: Orange
Medium: Yellow
Low: Green
The Overview page is laid out in five sections:
Time Picker (top, to the right of menu tabs): Length of time taken into account when pulling alarm data
Status Bar (uppermost right corner): Each Alarm Status selected here will determine the information shown on the entirety of the page.
Donut Chart (upper left): Represents total alarms for the selected Status, including the number of each severity
Alerted Planes (upper right): Indicates in which planes the alarms are found for the selected Status
Alarms Table (bottom): All alarms contained in the selected Status
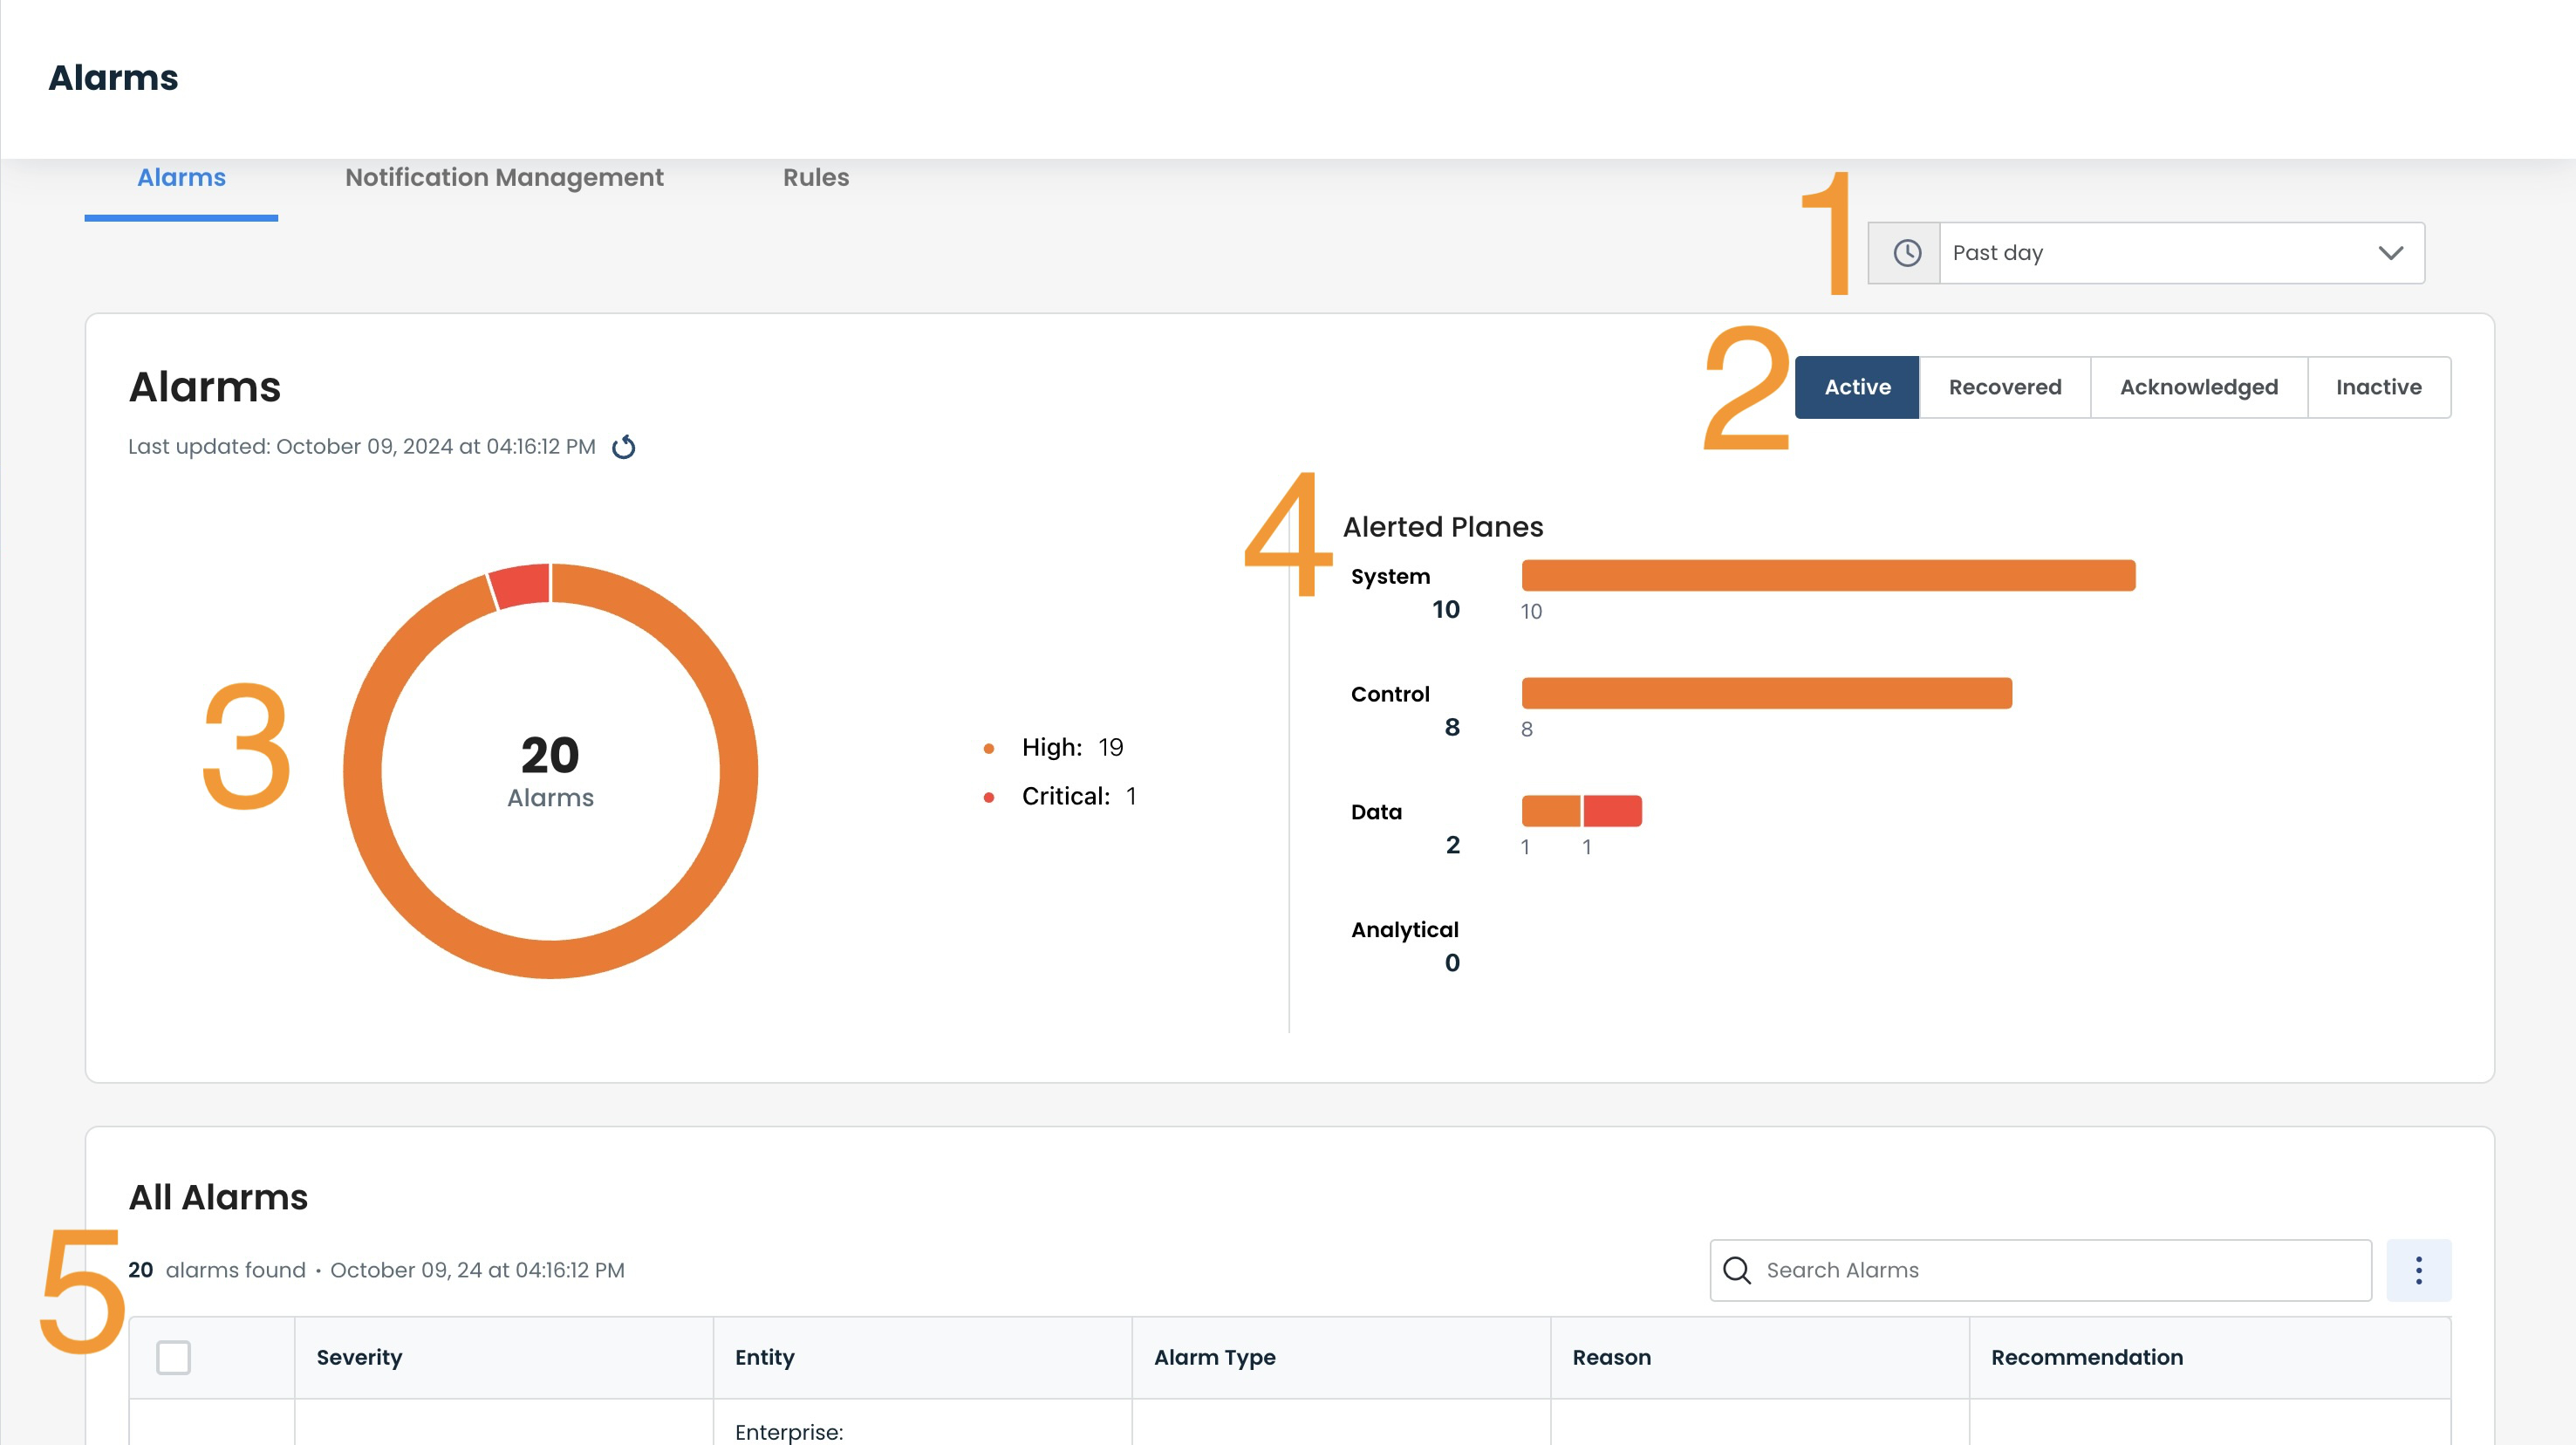
Alarm Statuses are established as:
Active: All current alarms that have not been mitigated and cleared.
Recovered: All alarms that have been mitigated and cleared.
Acknowledged: All alarms that have been assigned to an individual to recover; these are independent of the alarm's current state of Active, Recovered, or Inactive.
Inactive: Alarms can be considered Inactive for either of the following reasons:
No longer seeing the issue, but not yet cleared. Consider the following example: Alarm was triggered due to a CPU spike of 95; CPU is no longer at 95, but needs to be below 80 before it is cleared.
Alarm has been disabled.
Alerted Planes are defined as:
System: Related to platform / hardware-related parameters
Control: Related to connectivity from the Edge to the Graphiant infrastructure that provides configuration and routing information.
Data: Related to connectivity to the Graphiant backbone.
Analytical: Inferred from the data gathered from the other three planes.
Each alarm can be manipulated with tools found by clicking the ellipses to the right of the alarm.
From here you can:
Create Notifications: Notifications about Active Alarms can be created to be sent to a user for quick action to be taken. Once created, this tool will change to being able to Mute / Unmute a notification.
Acknowledge the Alarm: Once an alarm is acknowledged as being worked on, it (and all of its associated alarms) are marked as Inactive.
Troubleshoot: Allows the user to quickly see the network details to remediate an alarm.
Disable the Alarm: To be used if an alarm is alerting, and for any reason is desired to not be alerting. Once disabled, the tool changes to read 'Enable' should the alarm be desired to be re-enabled.
.png)
Notifications
Notifications of alarms can be a vital tool in the immediate remediation of an issue; instead of checking the network periodically, a notification brings instant attention to a behavior that could be problematic for a network.
Alarms are always visible in the Portal on the Alarms screen. For proactive alerting of an issue, notifications can be set up for individual or groups of alarms if desired, and forwarded to an email of your choice.
Creating Notifications
Alarm notifications can be created by either:
Clicking 'Notification Management' from the Alarm landing page; click 'Add Notification'.
Select 'Create Notification' from the ellipses to the right of the alarm of which to be notified.
Simply fill out and save the information, and you are all set to start receiving Graphiant notifications for any alarm(s) that you choose.
.png)
Notification Management
By clicking the 'Notification Management' tab, you can see information on the notifications that have been set up across your network.
The page is laid out in two sections:
Visual Donut Chart (top): Represents number of times any notification has been triggered across the network.
Notifications Table (bottom): All notifications that have been created, listed by name.
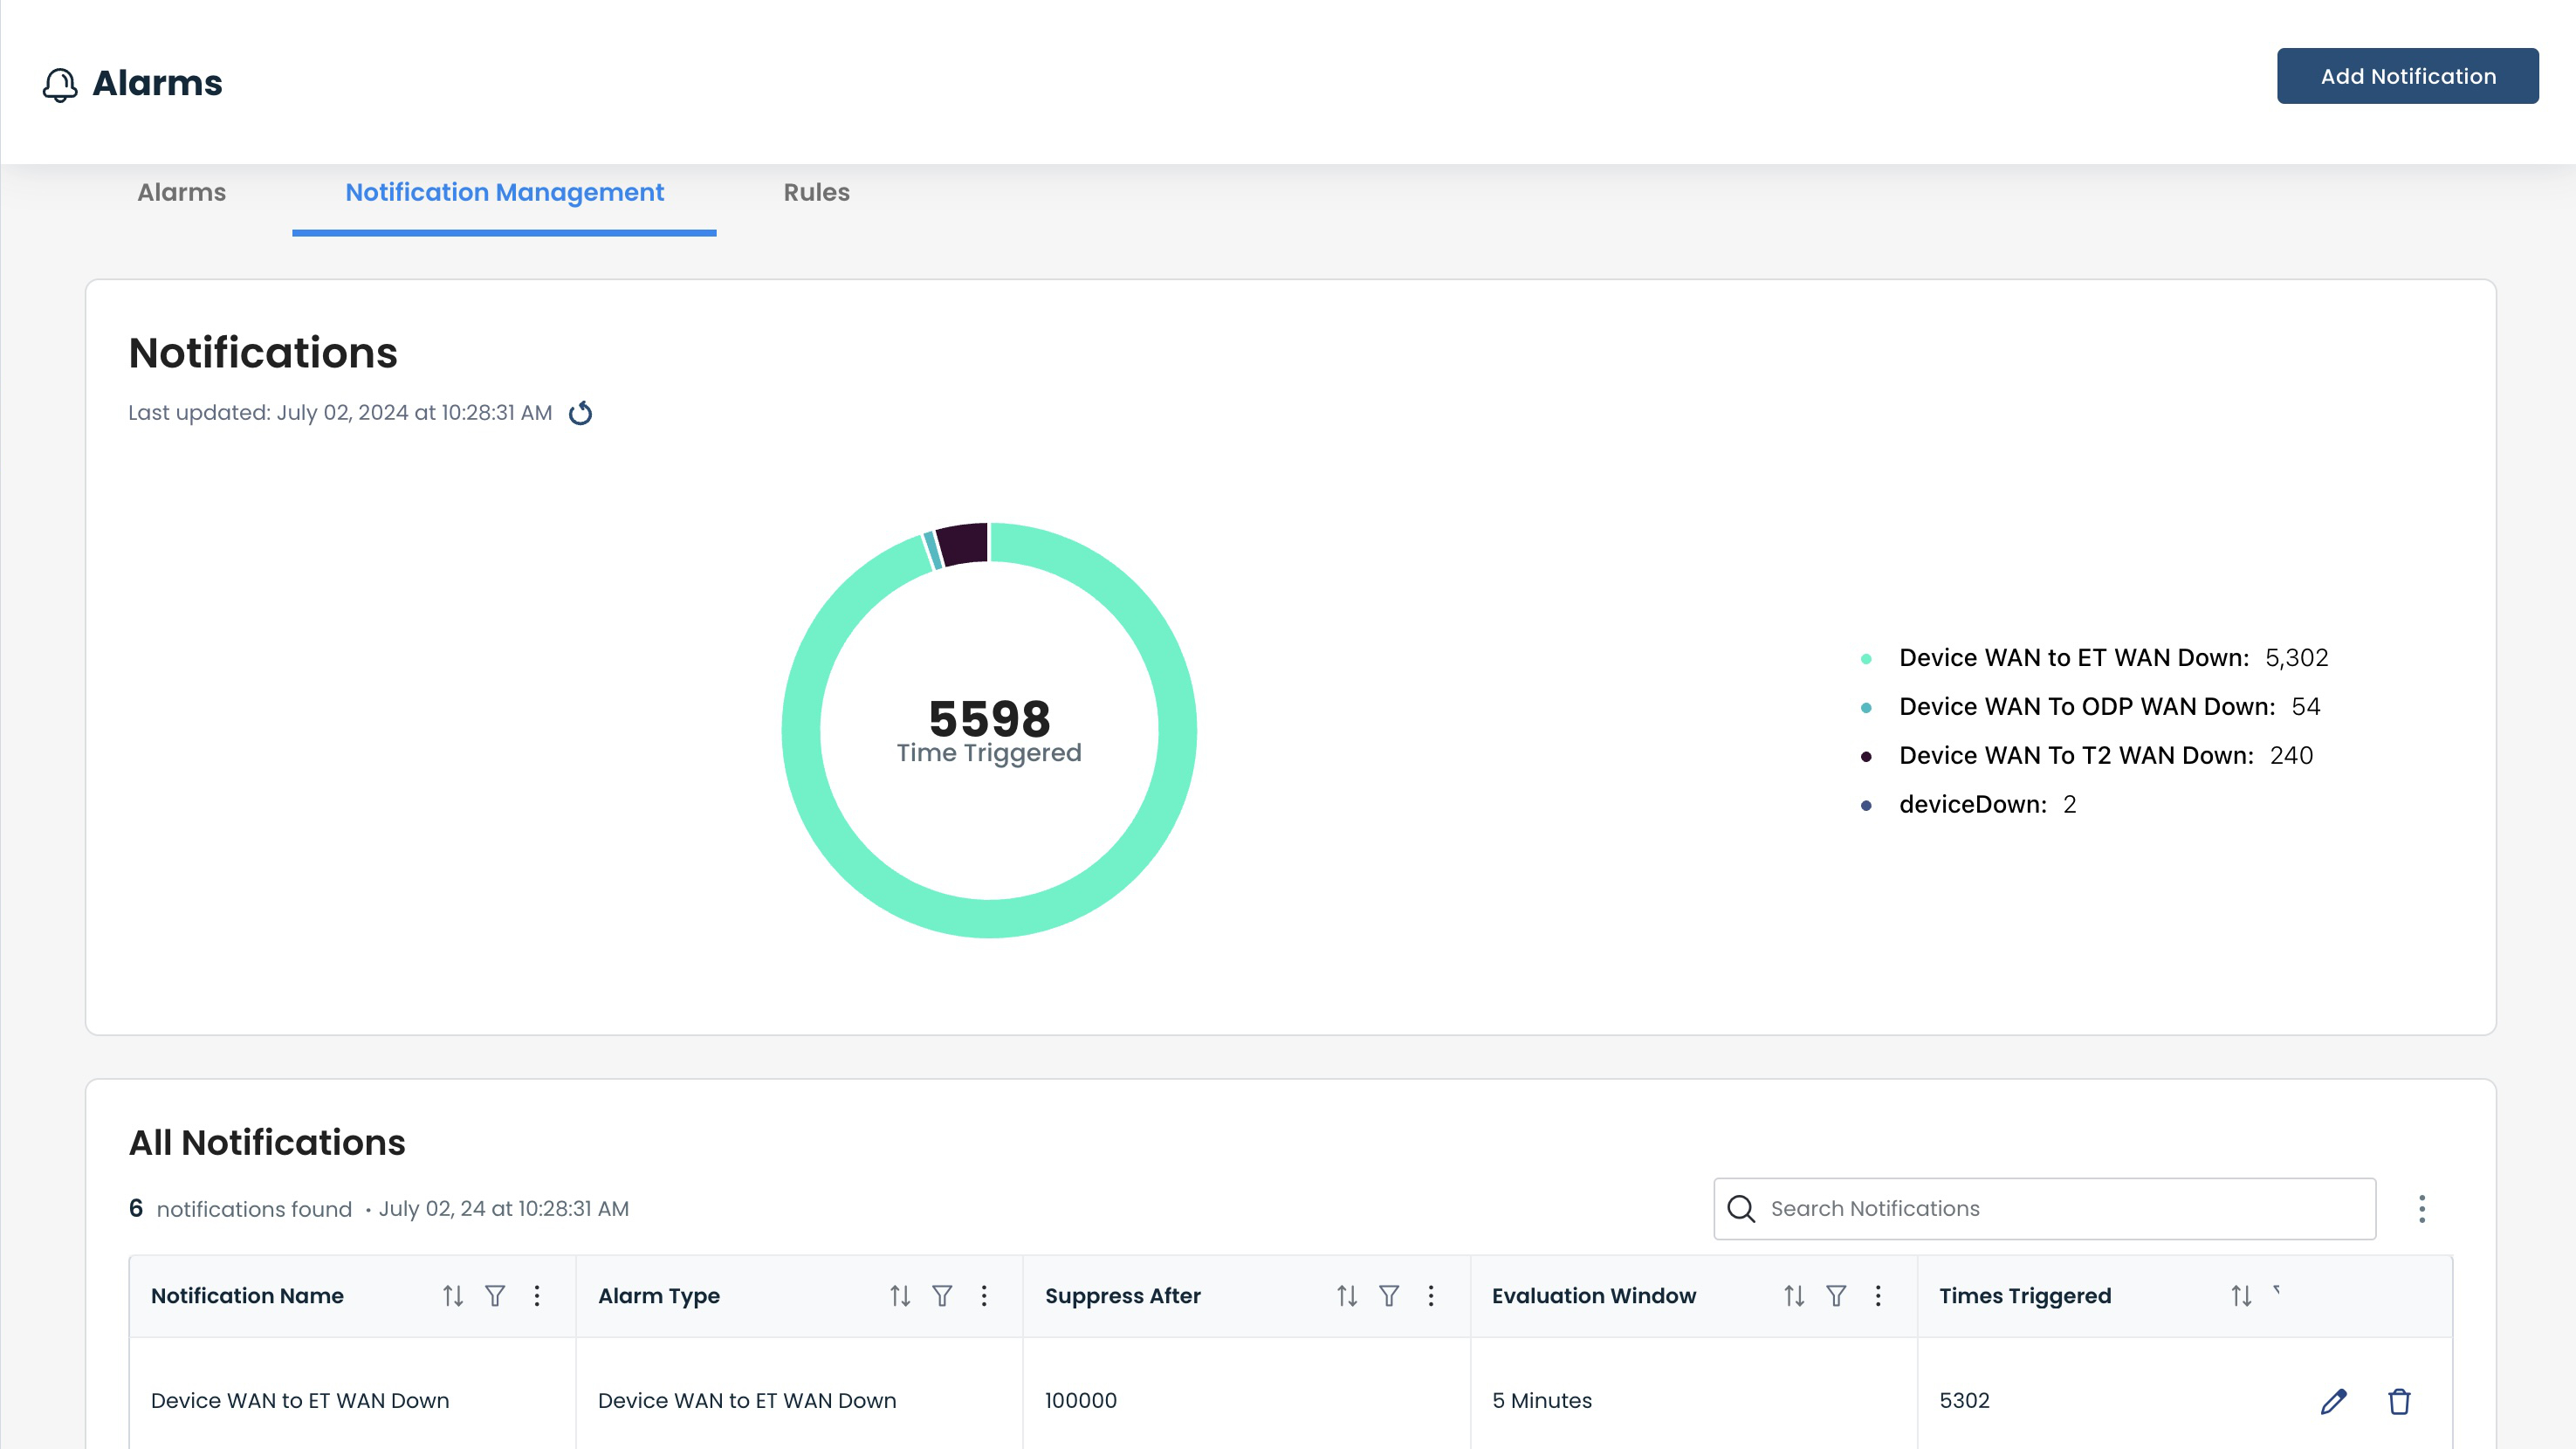
Notifications can be disabled/enabled by toggling the switch to the right of the desired notification.
.png)
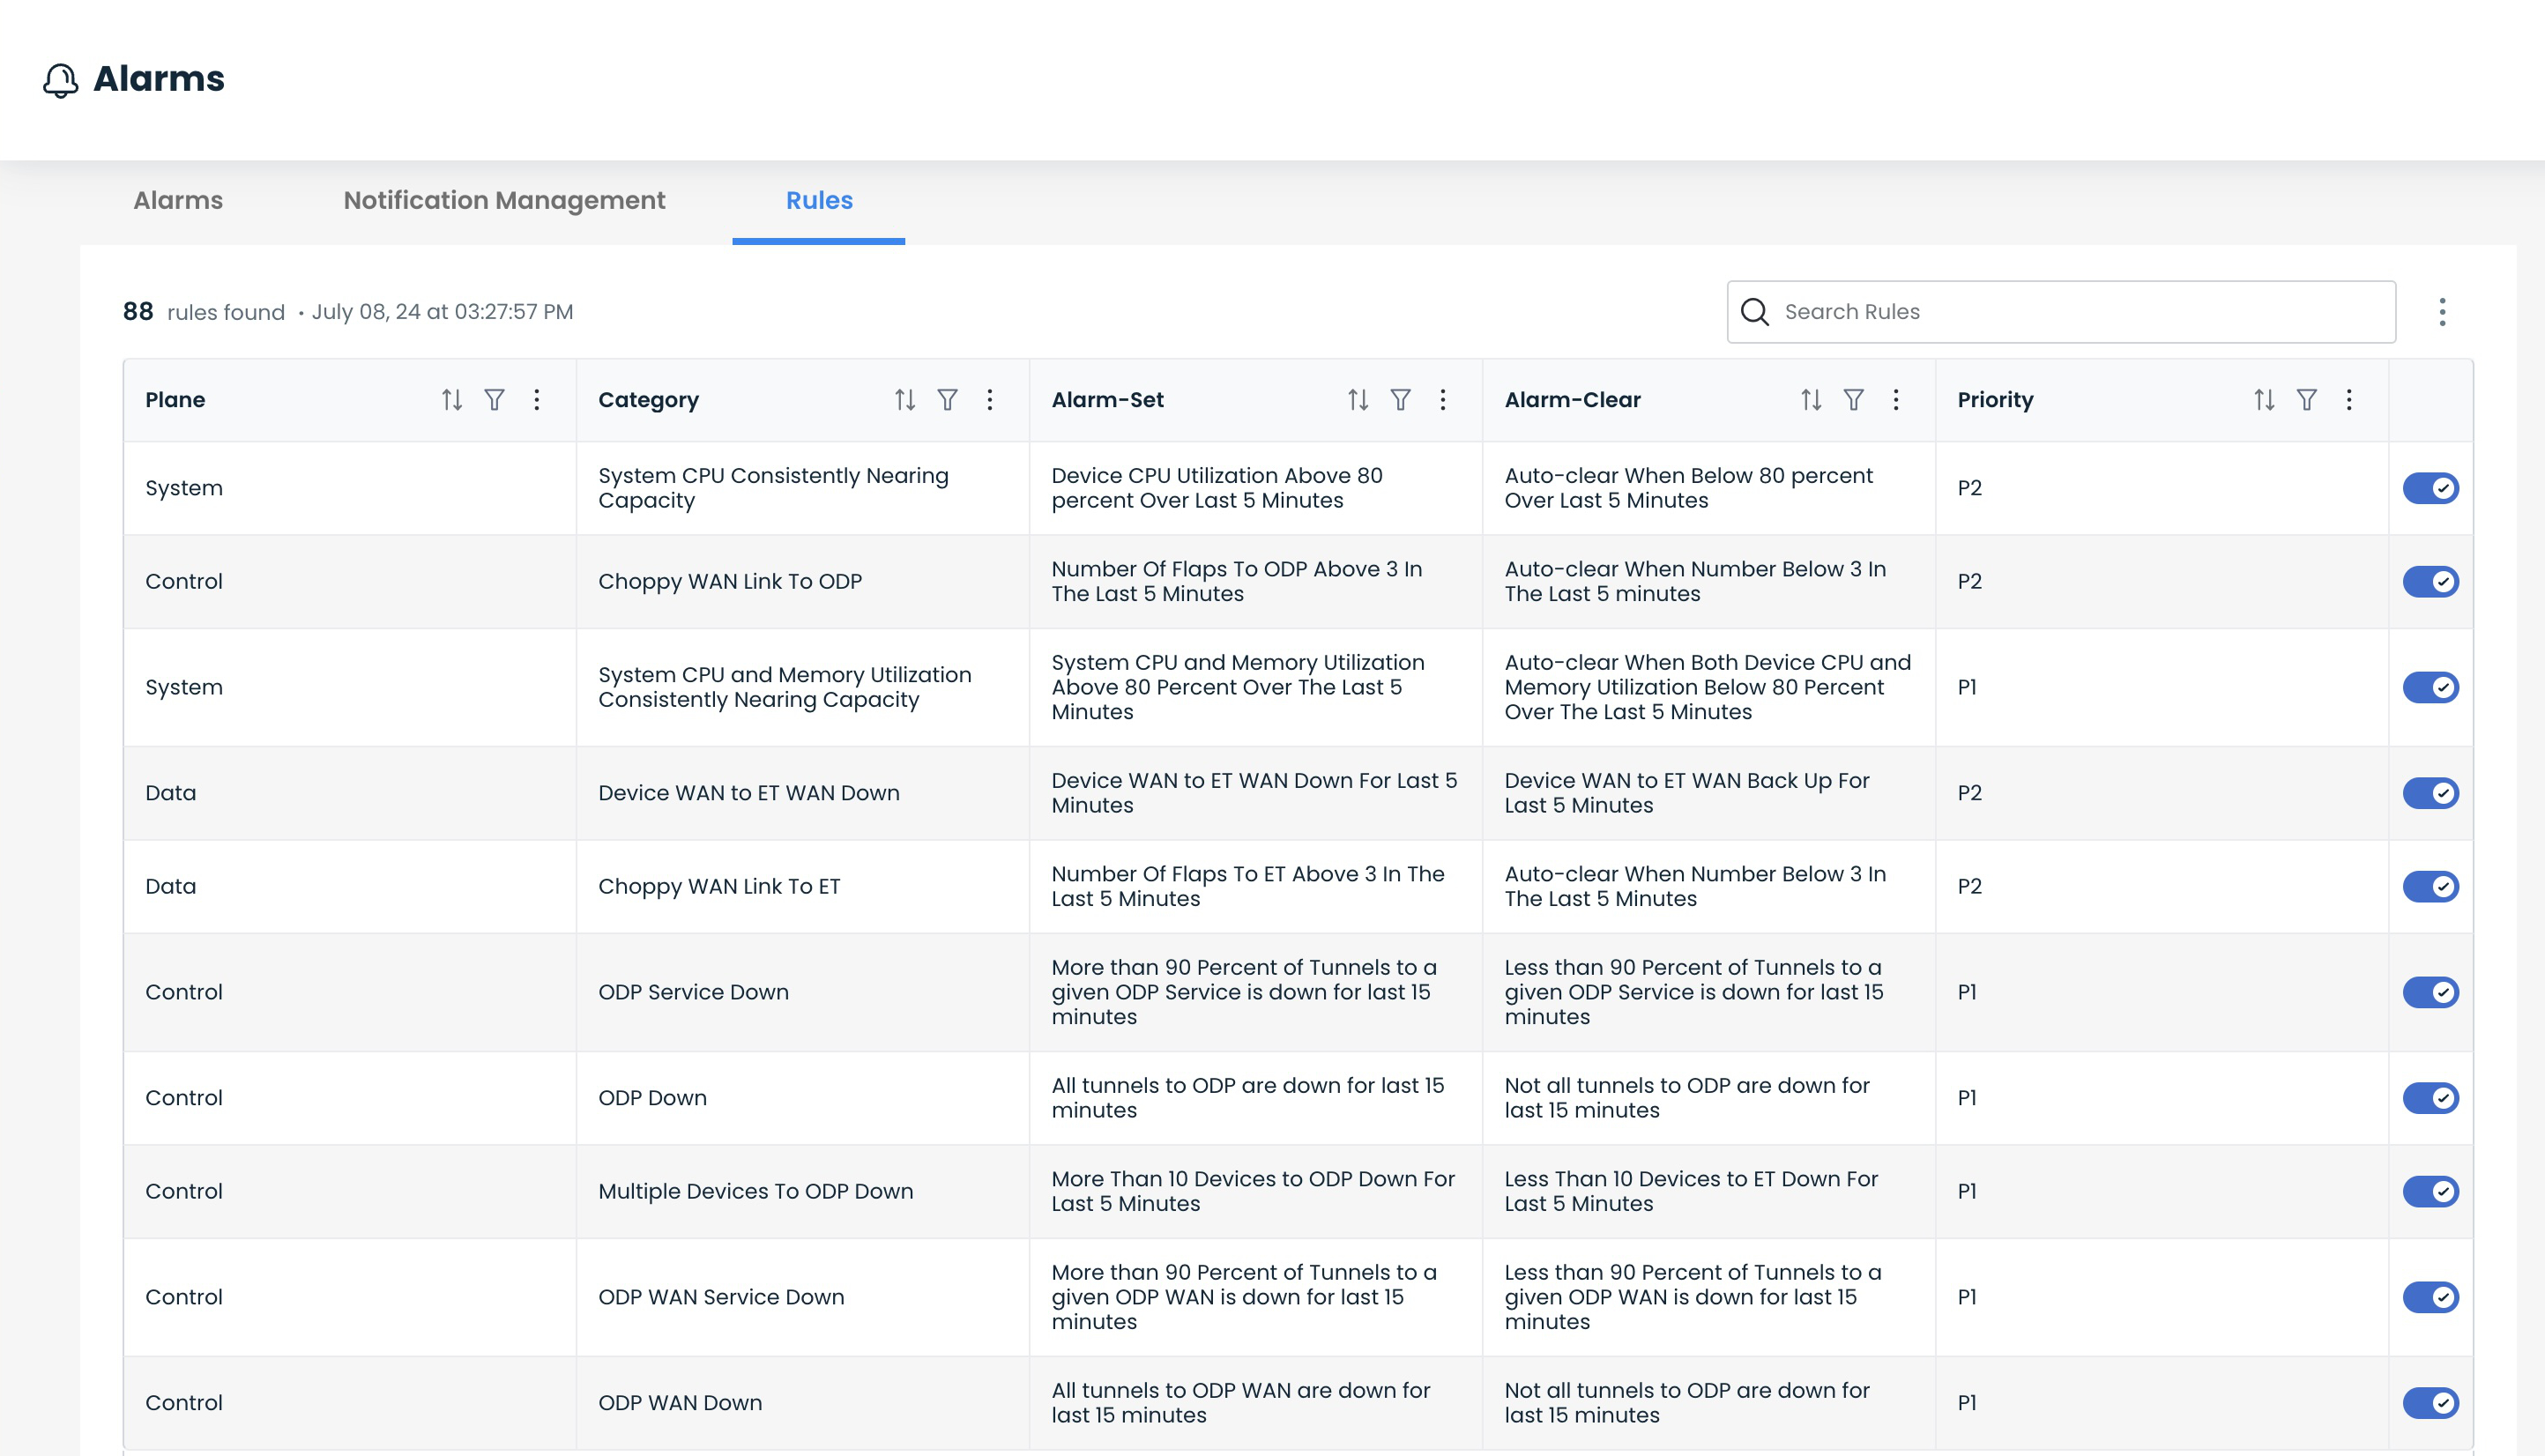
Rules
Each Alarm has a Rule that triggers it.
The information for, and ability to enable / disable, each Rule is in the Rule Table, located by clicking the 'Rules' tab.