The Problem:
Overlay networks do not provide control over the underlay path taken by your network traffic.
No visibility into the physical path
No ability to control the traffic path
Traffic can take unsecure and non-compliant paths
With Graphiant, you can:
Define the physical path based on geographical boundaries or compliance requirements
Use the Graphiant Portal to view the path taken by the network traffic
What is Data Assurance?
IPFIX records provide a wealth of information - albeit noisy information - that while advantageous for forensic troubleshooting, can overwhelm a network operator and become more of a forensic tool after the fact.
Graphiant is changing the paradigm.
Graphiant's Data Assurance provides a real-time dissection of flow records, along with recommendations on aggregation of applications into buckets to reduce information overload.
These records now become a preemptive security and assurance toolset, allowing you to study your network peacetime patterns, as well as any anti-patterns.
How Does Data Assurance Work?
Simply due to the sheer scale of the number of flow records, users today have little idea of what's running in transit through their network. They need to be able to focus on what needs attention, and what patterns are forming.
Graphiant auto-classifies application into buckets on which users can then operate.
Users can see what is being analyzed in real time, along with the number of recommendations the Data Assurance system is making.
Note:
Any application that Graphiant does not recognize or has not been previously classified by the user, will need to be classified into its appropriate bucket. Click here for further information.
Graphiant Data Assurance Buckets
Graphiant has eight primary buckets into which the applications can be placed (any subcategories are listed below their main bucket):
Graphiant Assured:
Custom Topology
General Assured
Data Exchange:
Custom Topology
General Assured
Enterprise SaaS
Public Internet:
AI
General
DNS & Proxy
Unsecure DIA:
Private
Unsecure
Dropped
Blocked
The buckets are defined as follows:
Graphiant Assured: Applications that are going over the Graphiant global backbone topology. The assurance Graphiant provides is Five 9's Availability for the middle mile, and End-to-End Encryption at the Public Internet networking boundary.
There are two categories contained within Graphiant Assured:
Custom Topology: All applications that you have named and classified.
General Assured: Applications running over the Graphiant network from your private domain.
Data Exchange: Applications that are running across your Data Exchange Service.
There are two categories contained within Data Exchange:
Custom Topology: All applications that you have named and classified.
General Assured: Applications running over the Graphiant network from your private domain.
Enterprise SaaS: Well-known Enterprise-grade applications such as O365, SalesForce, Dropbox, Zscaler, Teams, Slack, and more.
Public Internet: Well known public apps such as YouTube, Facebook, Reddit etc.
There are two categories contained within Public Internet:
AI: Applications originating from any public AI server.
General: Any applications that are not AI or Enterprise SaaS.
DNS & Proxy: URLs that were attempted to be reached.
Unsecure DIA: These are the primary applications of interest. They are going over the public internet to endpoints that have a high risk score and/or are not part of any of the previous Assurance Categories.
There are two categories contained within Unsecure DIA:
Private: Applications from apps that Graphiant doesn't recognize, going over the public internet.
Unsecure: Applications with either malicious intent, or of an undesirable category (gambling, etc)
Dropped: These are packets that were discarded before a session could be established.
Blocked: These are all software or applications that have been moved from any section due to being restricted or prohibited.
Locating Data Assurance in the Graphiant Portal
From the Graphiant Portal home screen, you can access Data Assurance by either clicking ‘Monitor’, and selecting 'Data Assurance' in the sidebar, or by clicking 'View Data Assurance' at the bottom of the page beneath the GAP Score.
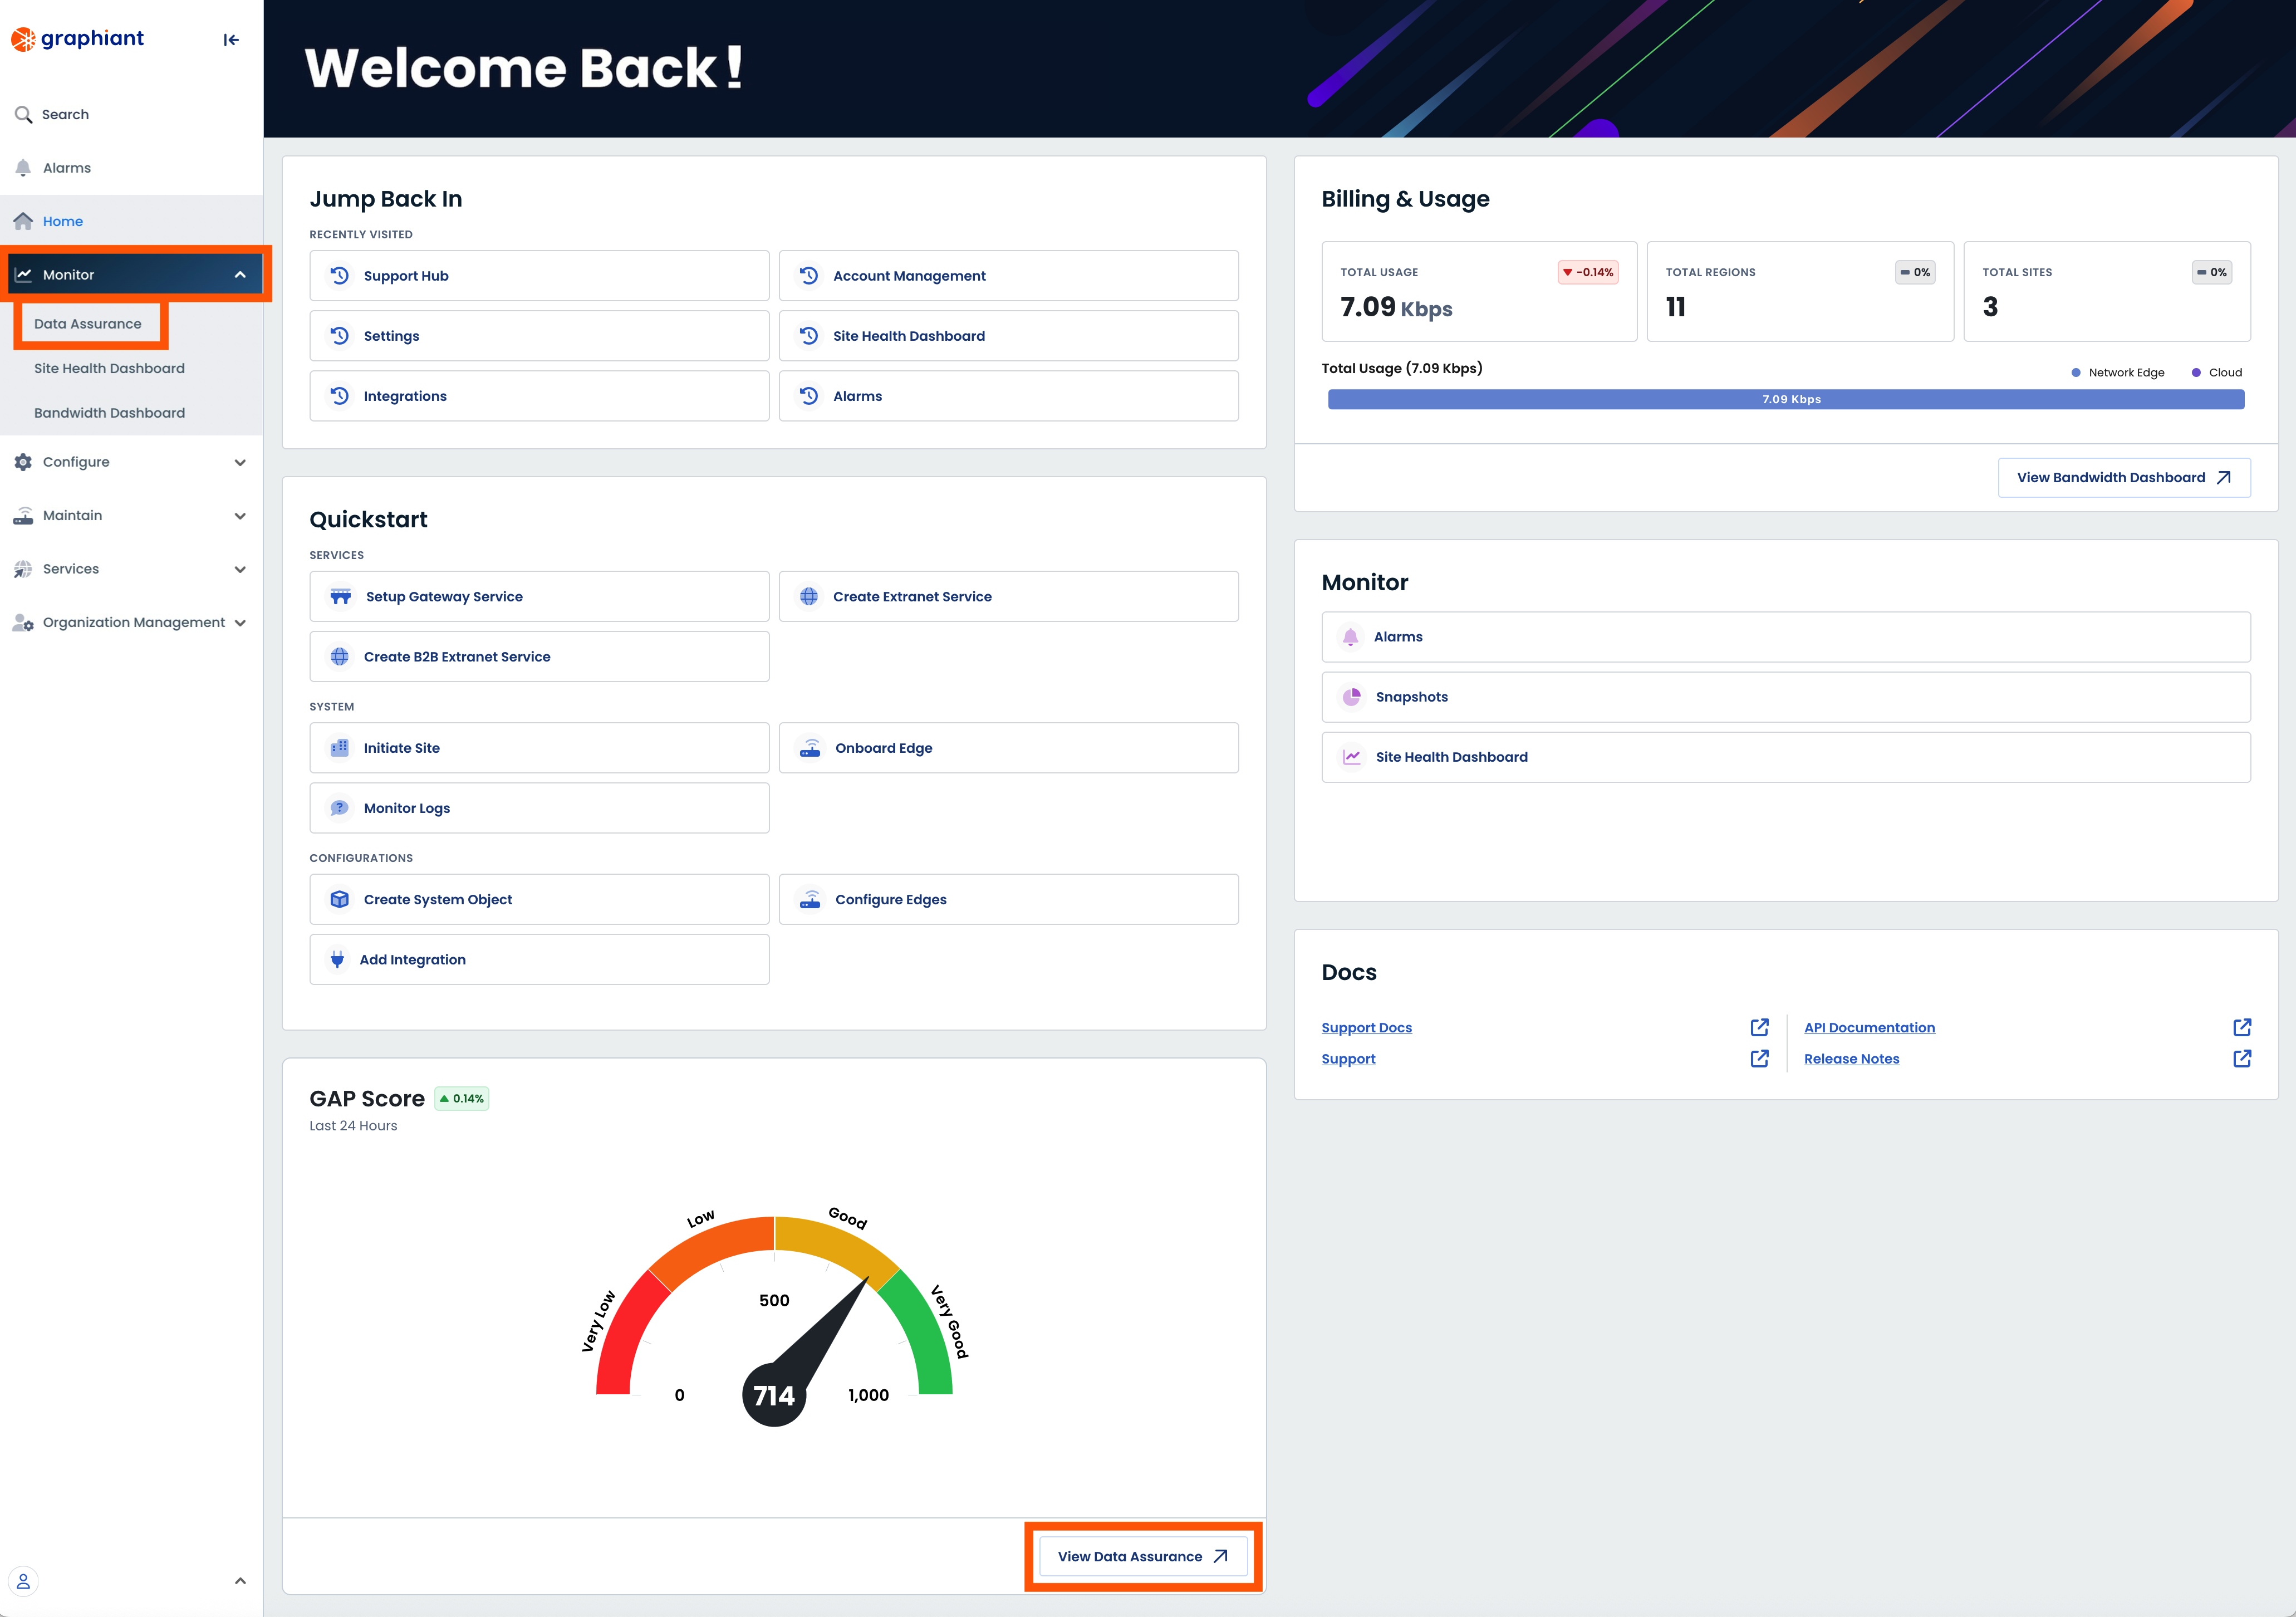
This opens the area of the Portal for Data Assurance.
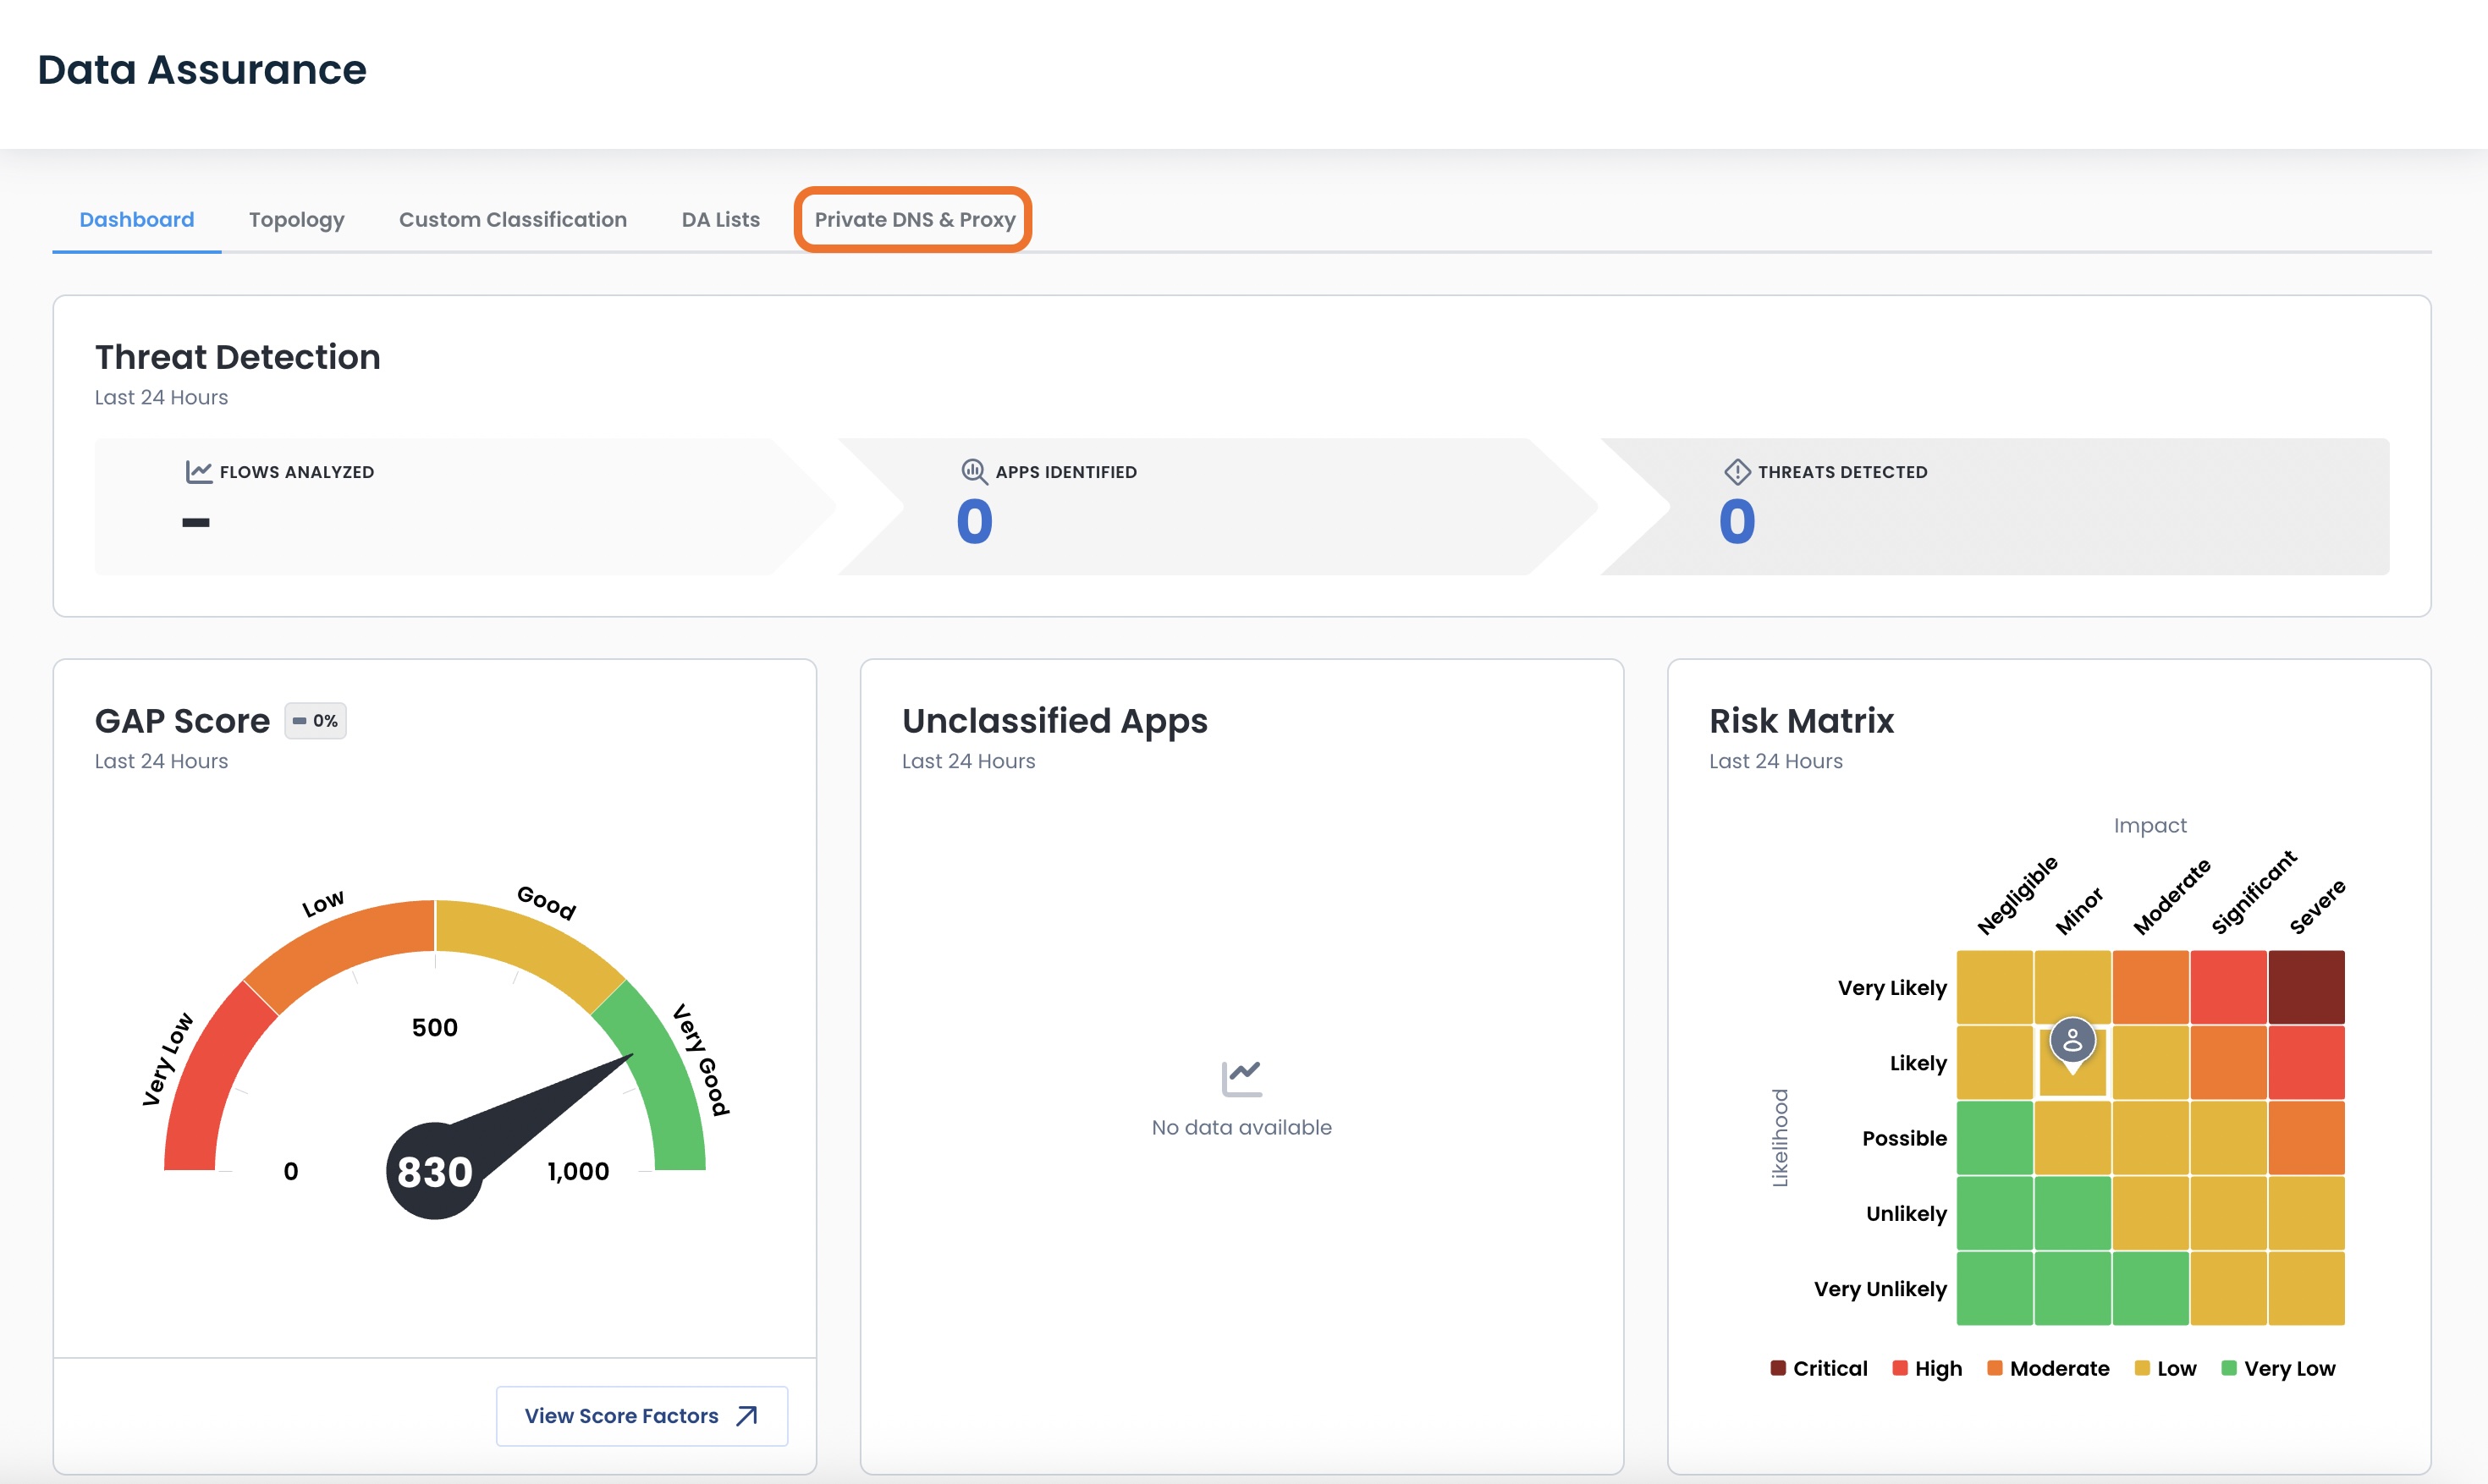
The landing page for Data Assurance is the Data Assurance Dashboard Tab.
.png)
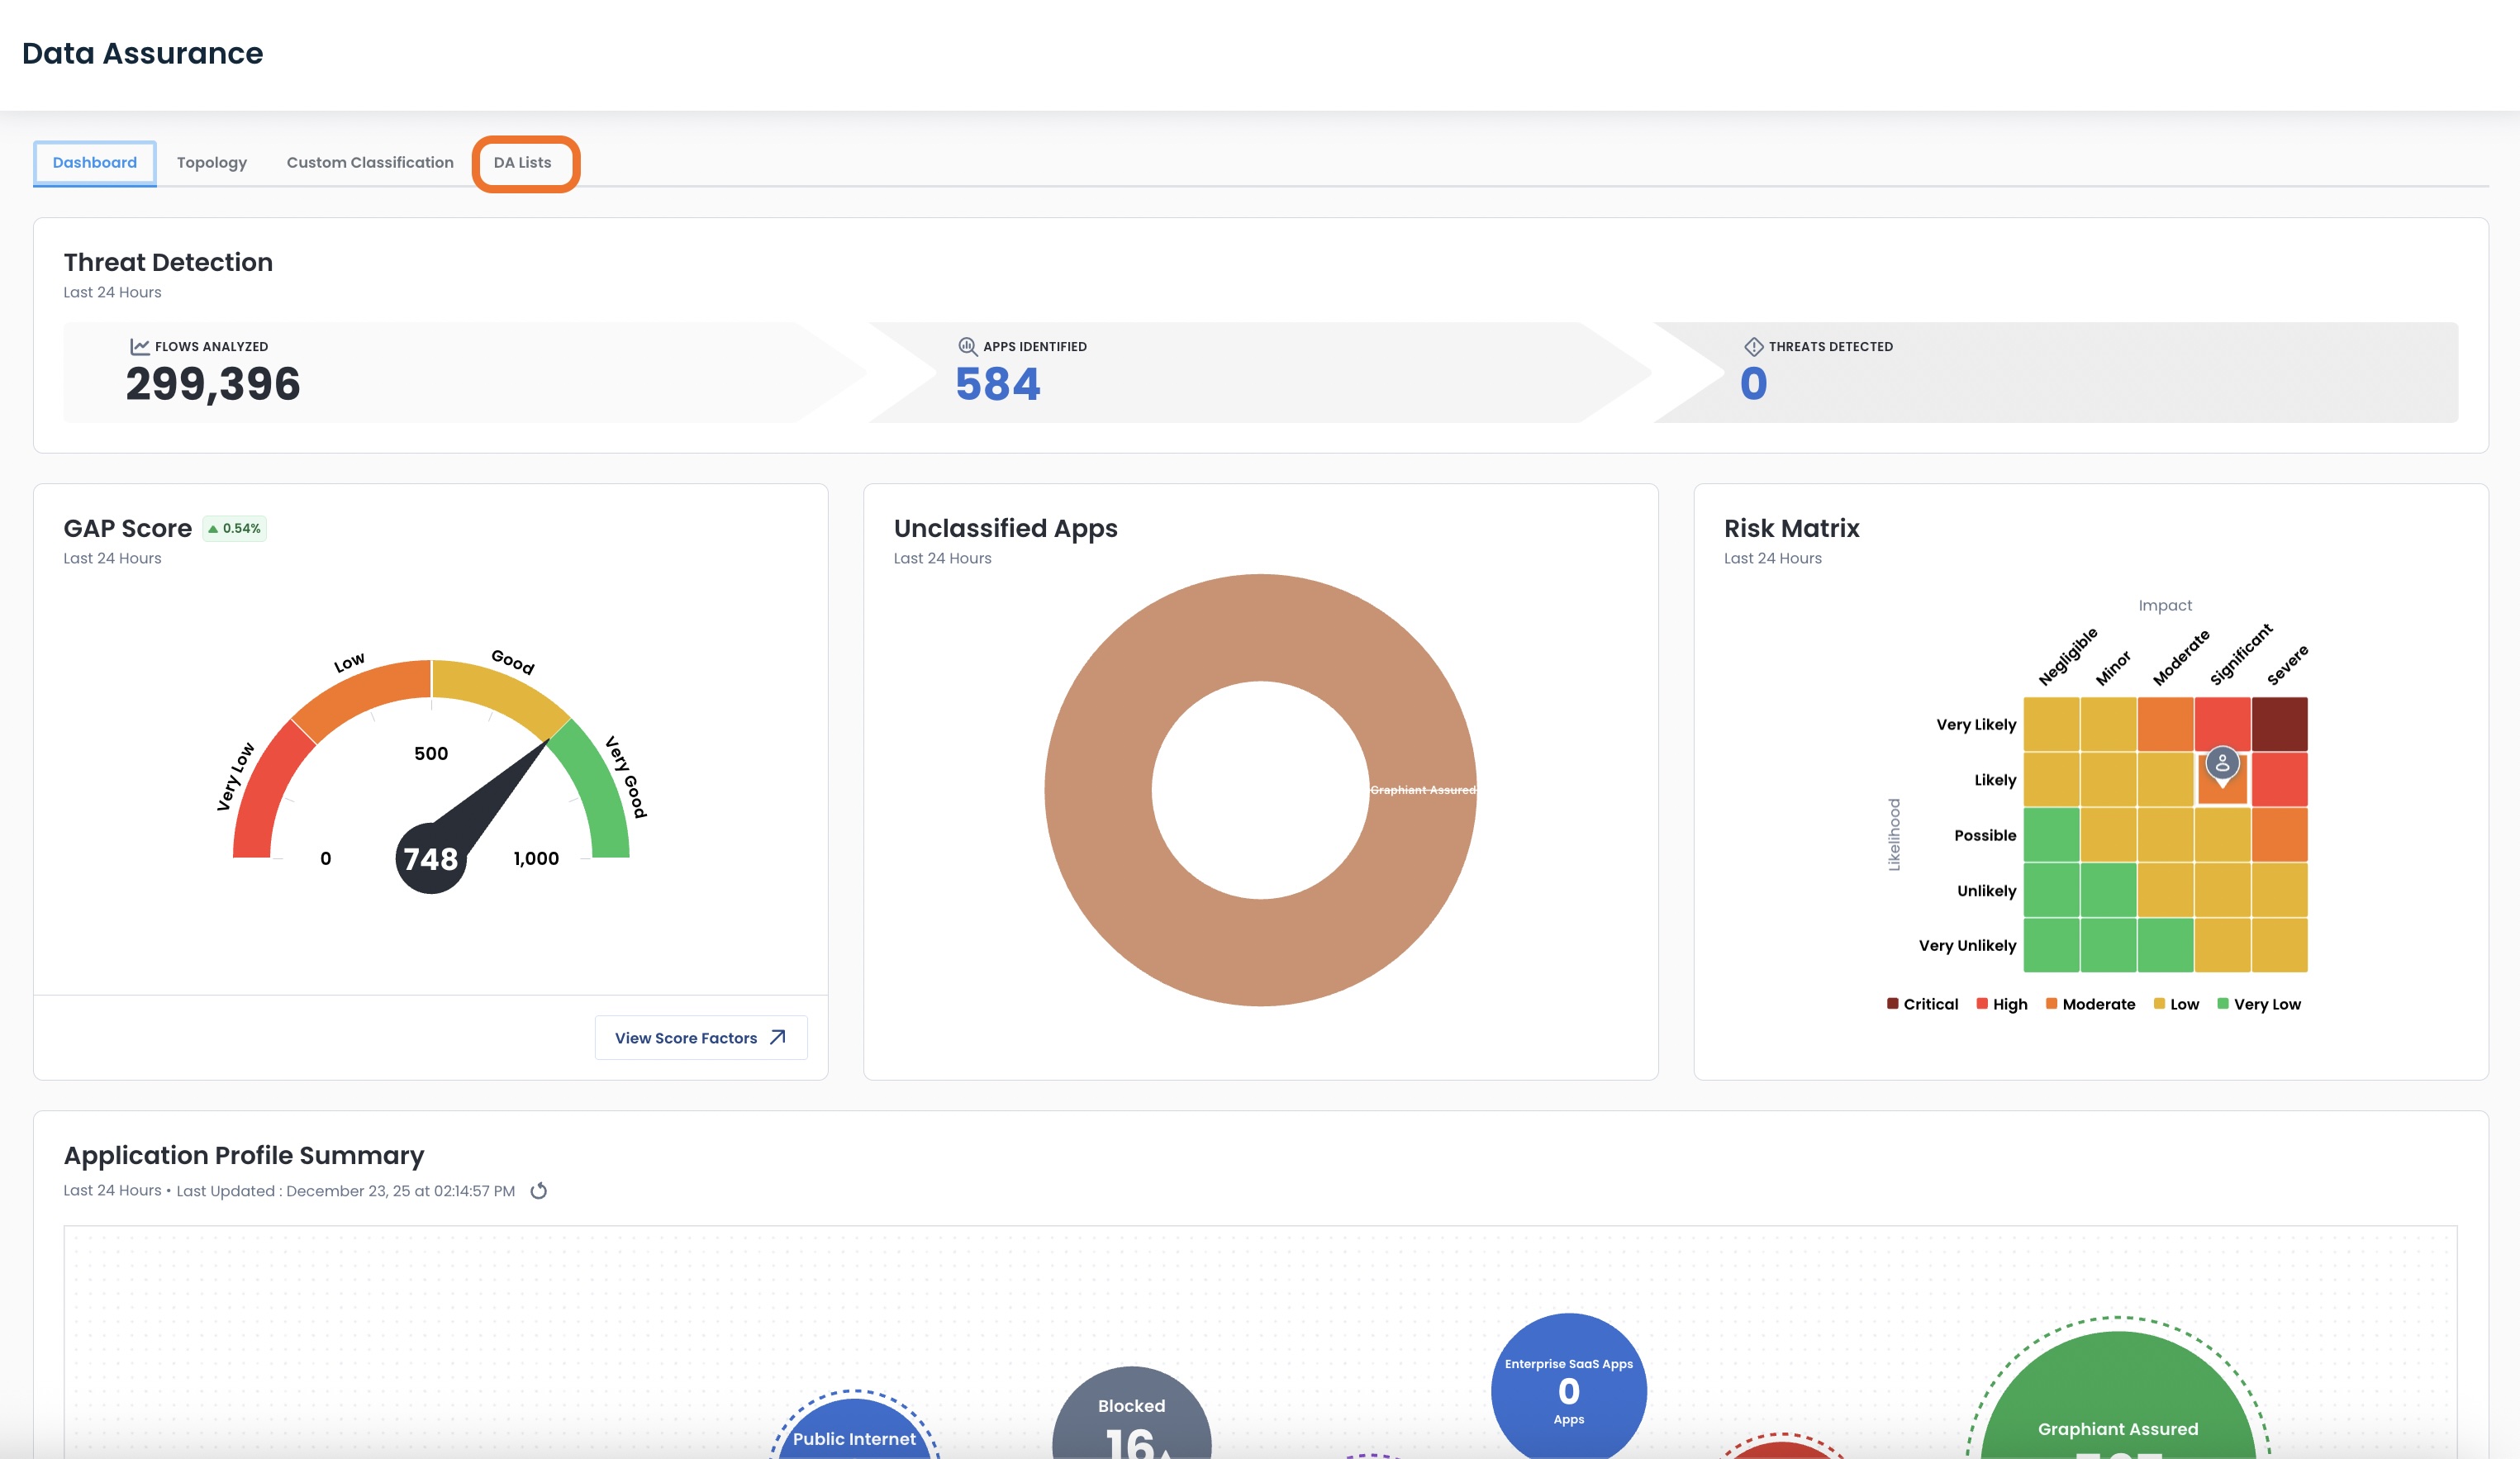
Data Assurance Dashboard
The Data Assurance Dashboard is a birds-eye view of what is running in your network.
From here, you can see the health of every site in the network at a glance, customize your view to instantly get the data that you need, as well as have the ability to visualize the health overview of all of the Edges in a particular site with just one click.
The Data Assurance Dashboard is divided into 5 sections:
Threat Detection: Includes stats regarding the flows, applications, and threats that have been seen
GAP Score: Quick "assurance credit score" for your enterprise
Unclassified Apps Donut Chart: Representation of the type and number of apps that have been seen but not yet classified
Risk Matrix: High-level grid plot reflecting your current risk level due to incoming flows.
Application Profile Summary: Interactive drill-down visual of the Data Assurance buckets
.png)
Threat Detection
The stats here tell you the number of:
Flows analyzed
Applications identified
Threats Detected
.png)
GAP Score
The GAP score is an at-a-glance overall health metric of the security of the flows coming into your network.
.png)
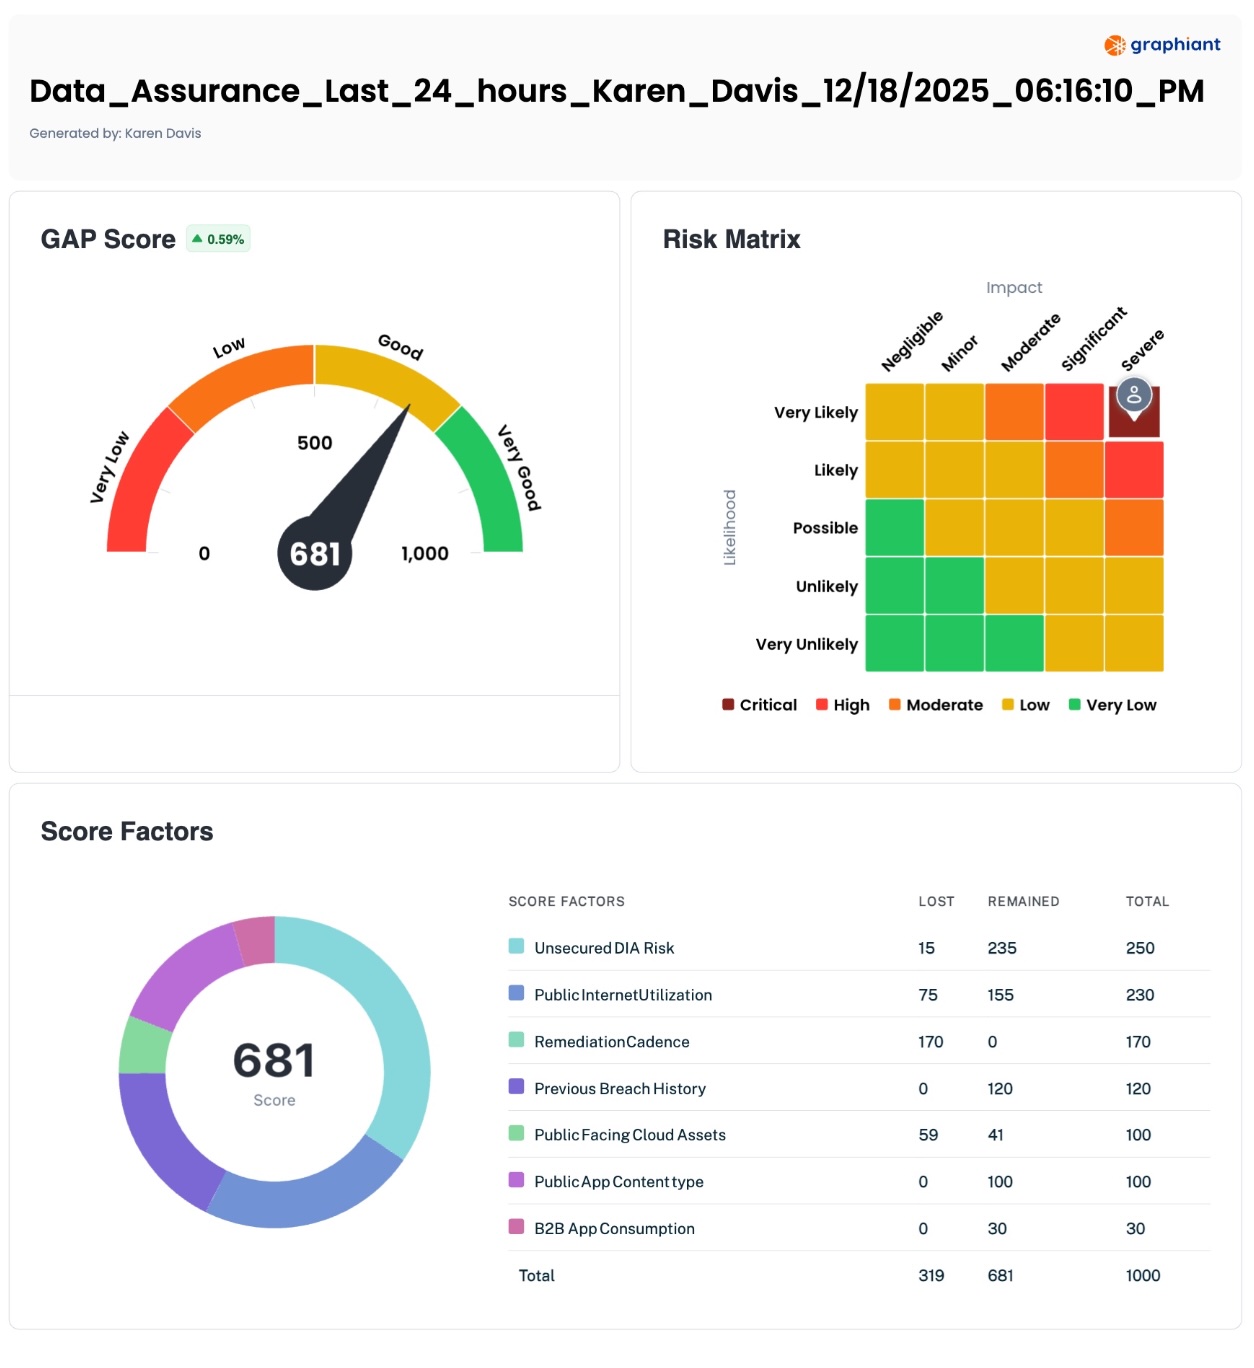
The GAP score is a quick "assurance credit score" for your enterprise from a risk perspective, with weighted elements that contribute to the aggregate score as follows:
Unsecure DIA Risk (25%): Percentage of flows in the Unsecure DIA bucket, compared to total flows
Public Internet Utilization (23%): Percentage of total bandwidth utilized over DIA that are not SaaS apps
Remediation Cadence (17%): Percentage of Recommended Actions Taken
Previous Breach History (12%): Percentage of Public IPs accessed that have a Threat Score greater than 6
Public Facing Cloud Assets (10%): Percentage of IP addresses that are public
Public App Content Type (10%): Percentage of Public Apps that belong to Unsafe Categories [such as gambling, adult content, weapons, violence/hate/racism, hacking, malware, phishing, alcohol, drugs, Unknown, and more]
B2B App Consumption (3%): Percentage of Bandwidth consumed by B2B partners
The highest possible score value starts at 1,000; the above factors will deduct from this beginning total based on the weights assigned to each factor.
To see the breakdown of your factors, click 'View Score Factors'.
.png)
This will open a modal with the detailed point itemization for each factor.
The columns are defined as follows:
Total: Highest available value for the factor
Lost: Number of points deducted due to data analyzed for that factor
Remained: End value for the factor
Total - Lost = Remained
The sum at the bottom of the Remained column is the end GAP score.
.png)
Unclassified Apps Donut Chart
Unclassified Applications are represented in this chart, in their corresponding buckets.
These are apps that Graphiant has not detected as belonging to a known application.
From here you can see which apps your network is seeing that are unclassified.
.png)
Hovering over a section of the donut chart will show the number of unclassified apps in that category, in this case, Unsecure DIA.
To see which sub-category of the bucket contains the unclassified apps, click the desired bucket.
.png)
This will reveal a new chart with the sub-category in the ring around the bucket, in this case "Private".
To see the Unclassified apps within this category, click that category's ring.
.png)
This opens the Applications Detail Table, where you can take actions on the apps and see data regarding them.
For more information on this page, click here.
Risk Matrix
The Risk Matrix is a high-level grid chart that tells you your level of risk with regards to the likelihood of a threat occurring, and the severity of the impact should a threat occur.
.png)
The likelihood of an event (Y-axis):
Risk Assured: Very unlikely
Graphiant Assured: Unlikely
SaaS Apps: Possible
Public Apps: Likely
Unsecure DIA: Very Likely
The level of impact (X-axis):
Risk Assured: Negligible
Graphiant Assured: Minor
SaaS Apps: Moderate
Public Apps: Significant
Unsecure DIA: Severe
The location of the plot is influenced by both the categories of applications moving through your network, along with the risk associated with those applications. The higher a risk belonging to any application, the more likely of an event to take place within your network that could result in a severe impact.
Application Profile Summary
The Application Profile Summary is a responsive representation of the Assurance buckets and number of apps within them, allowing you to drill down and interact with each one to see details with regards to the apps within.
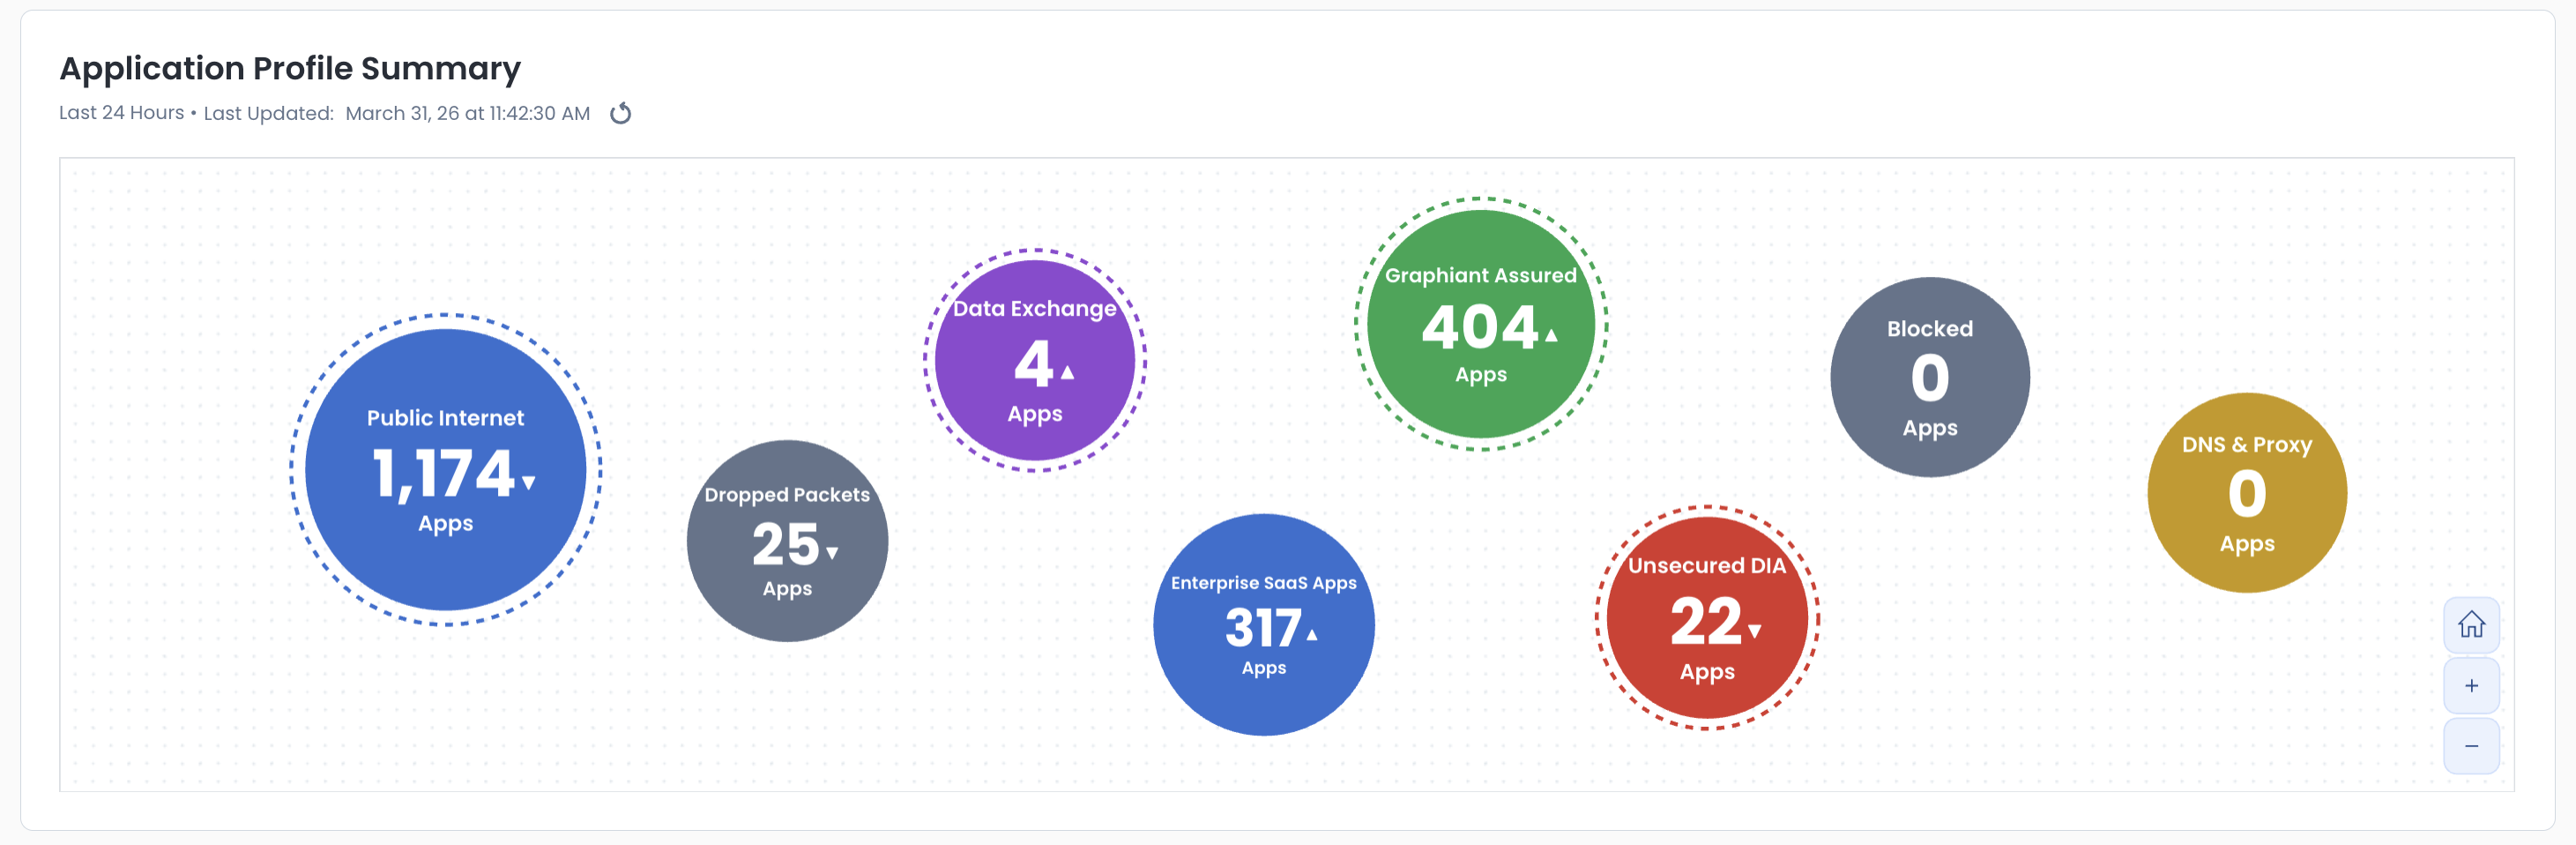
Clicking on any of the buckets will show you the bucket levels contained inside that category.
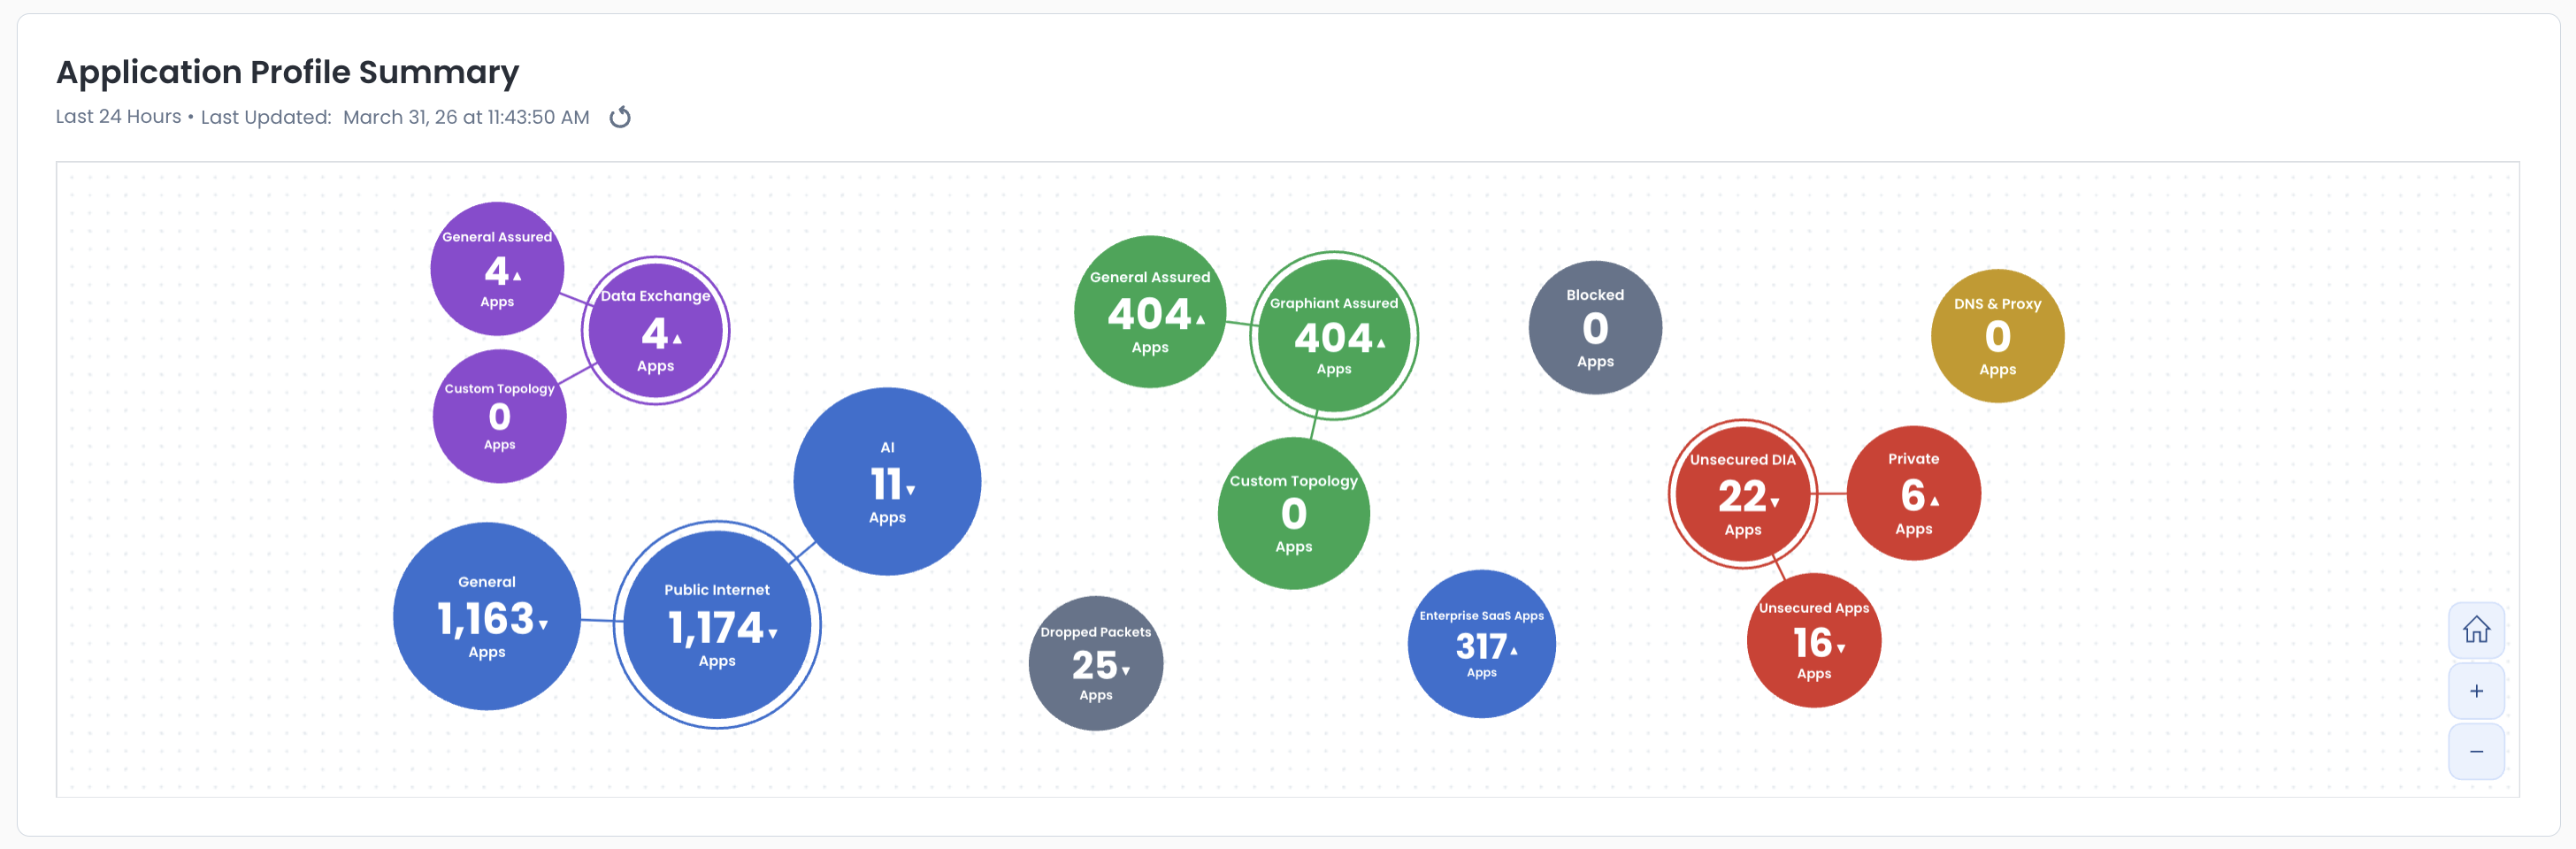
Clicking on any of the nested buckets within a category will open the Application Details Table with the information regarding the applications within that bucket.

Note:
The "Blocked" and "Enterprise Saas" buckets do not have subcategories; clicking on those buckets will take you directly to the Application Details Table.
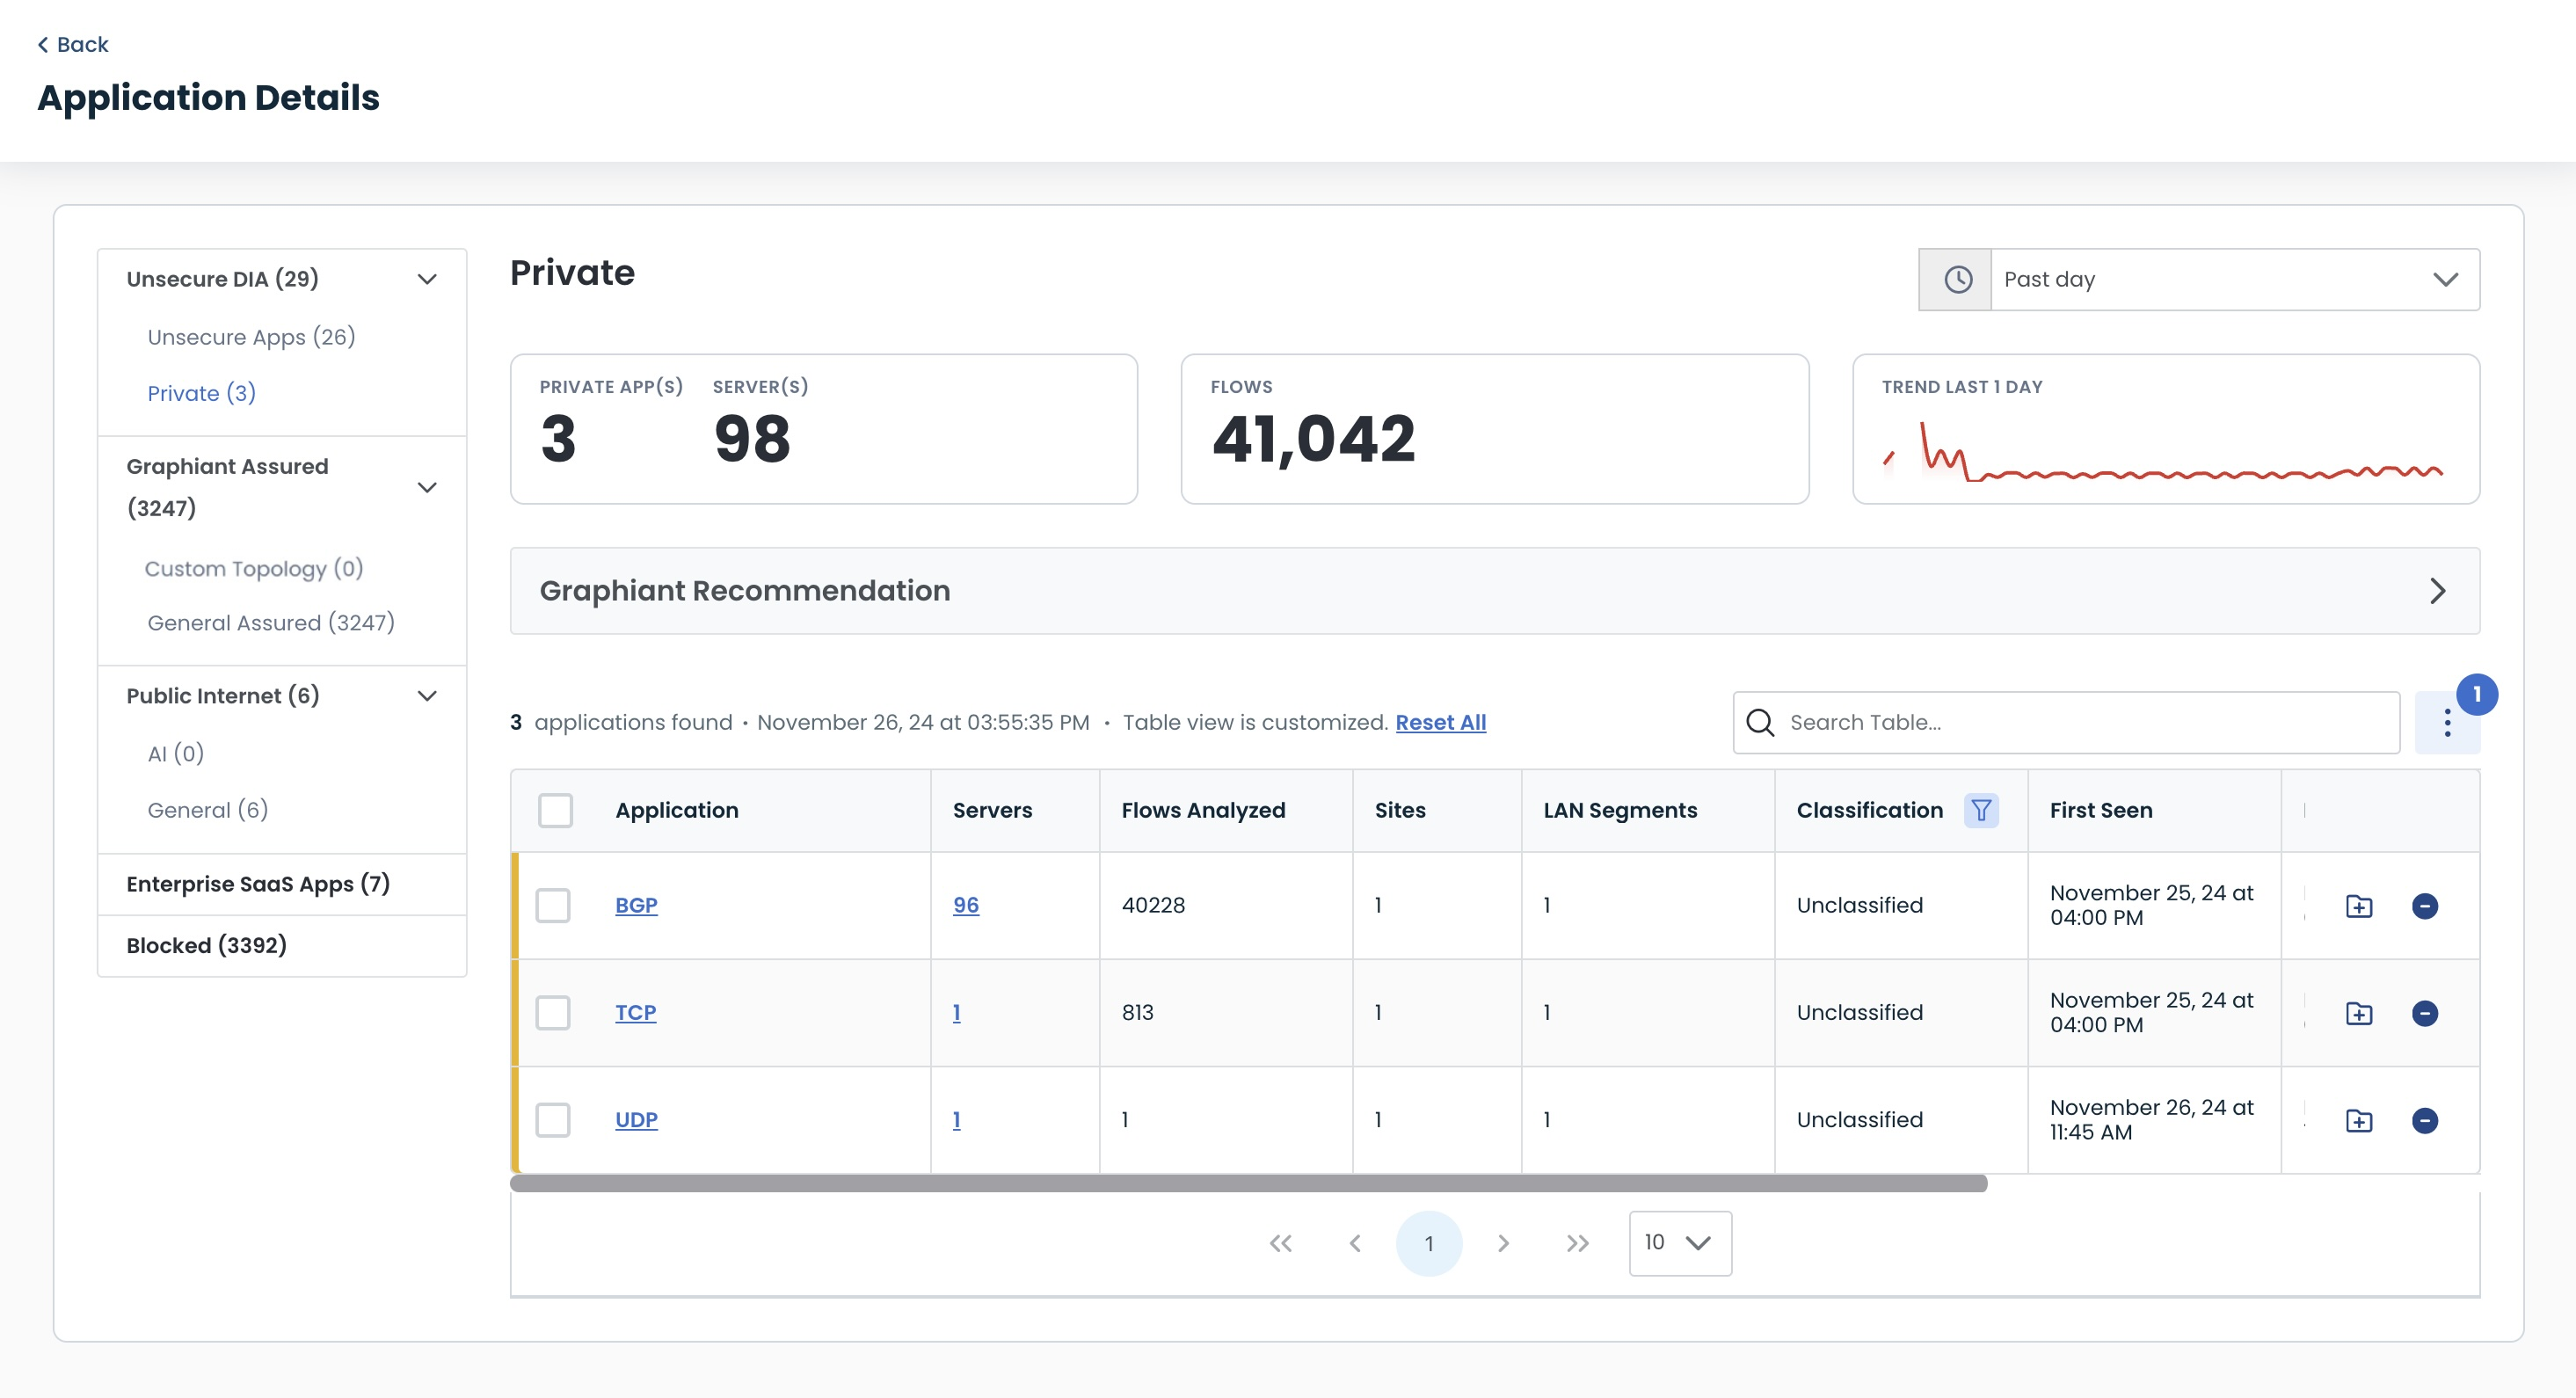
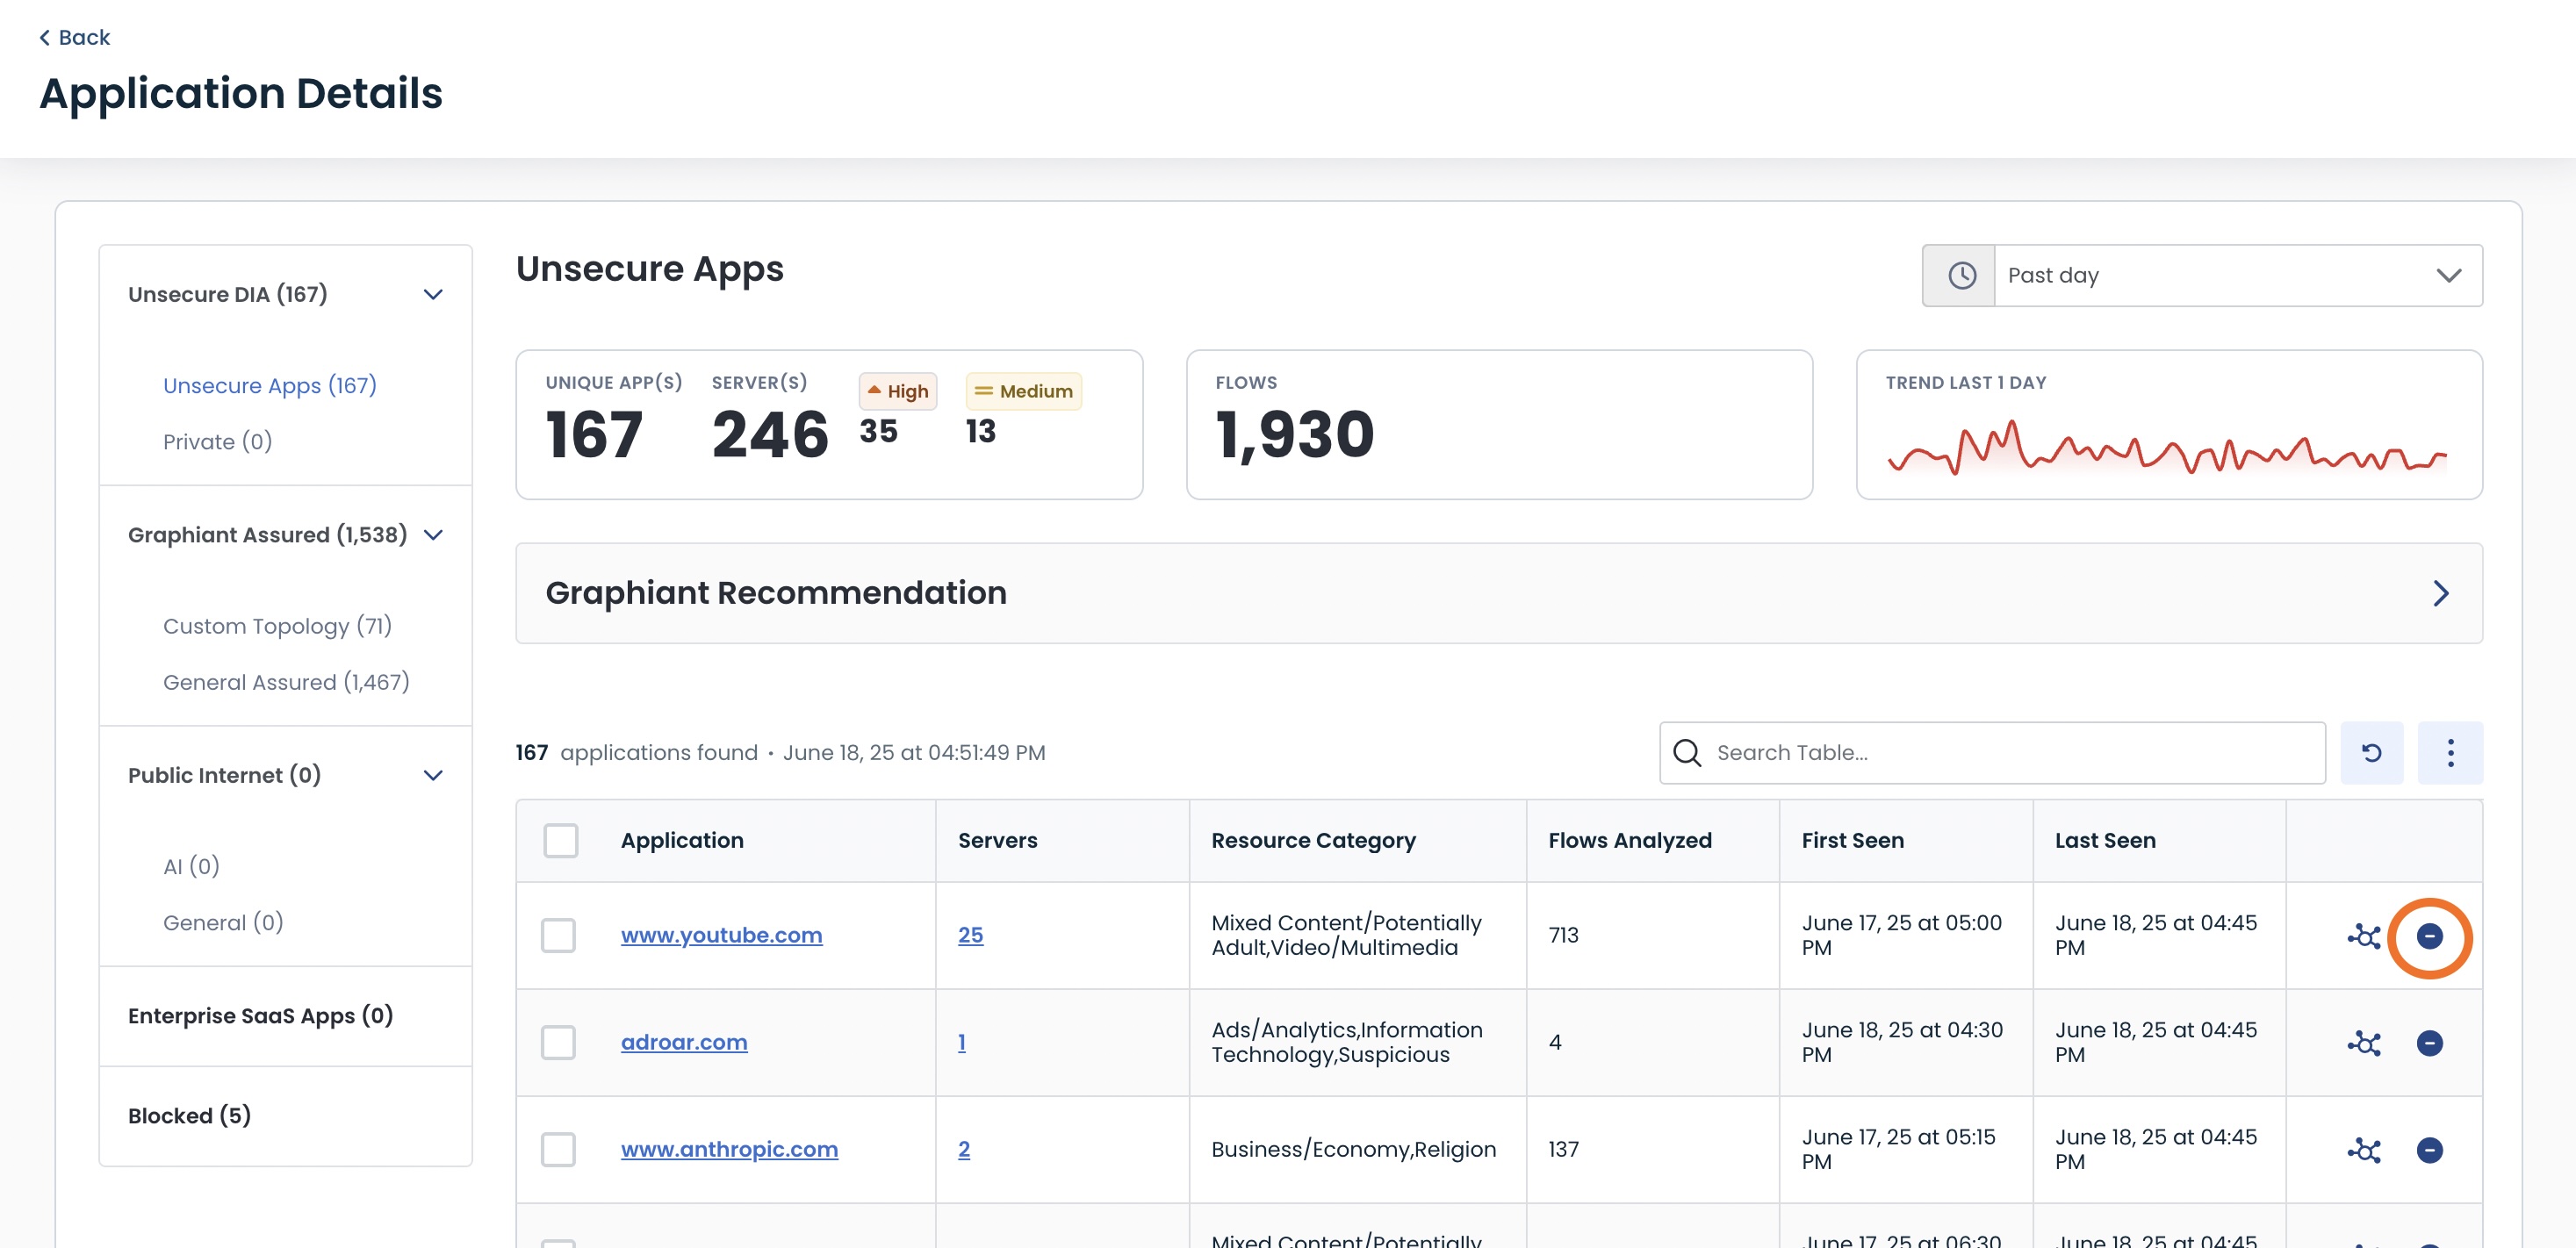
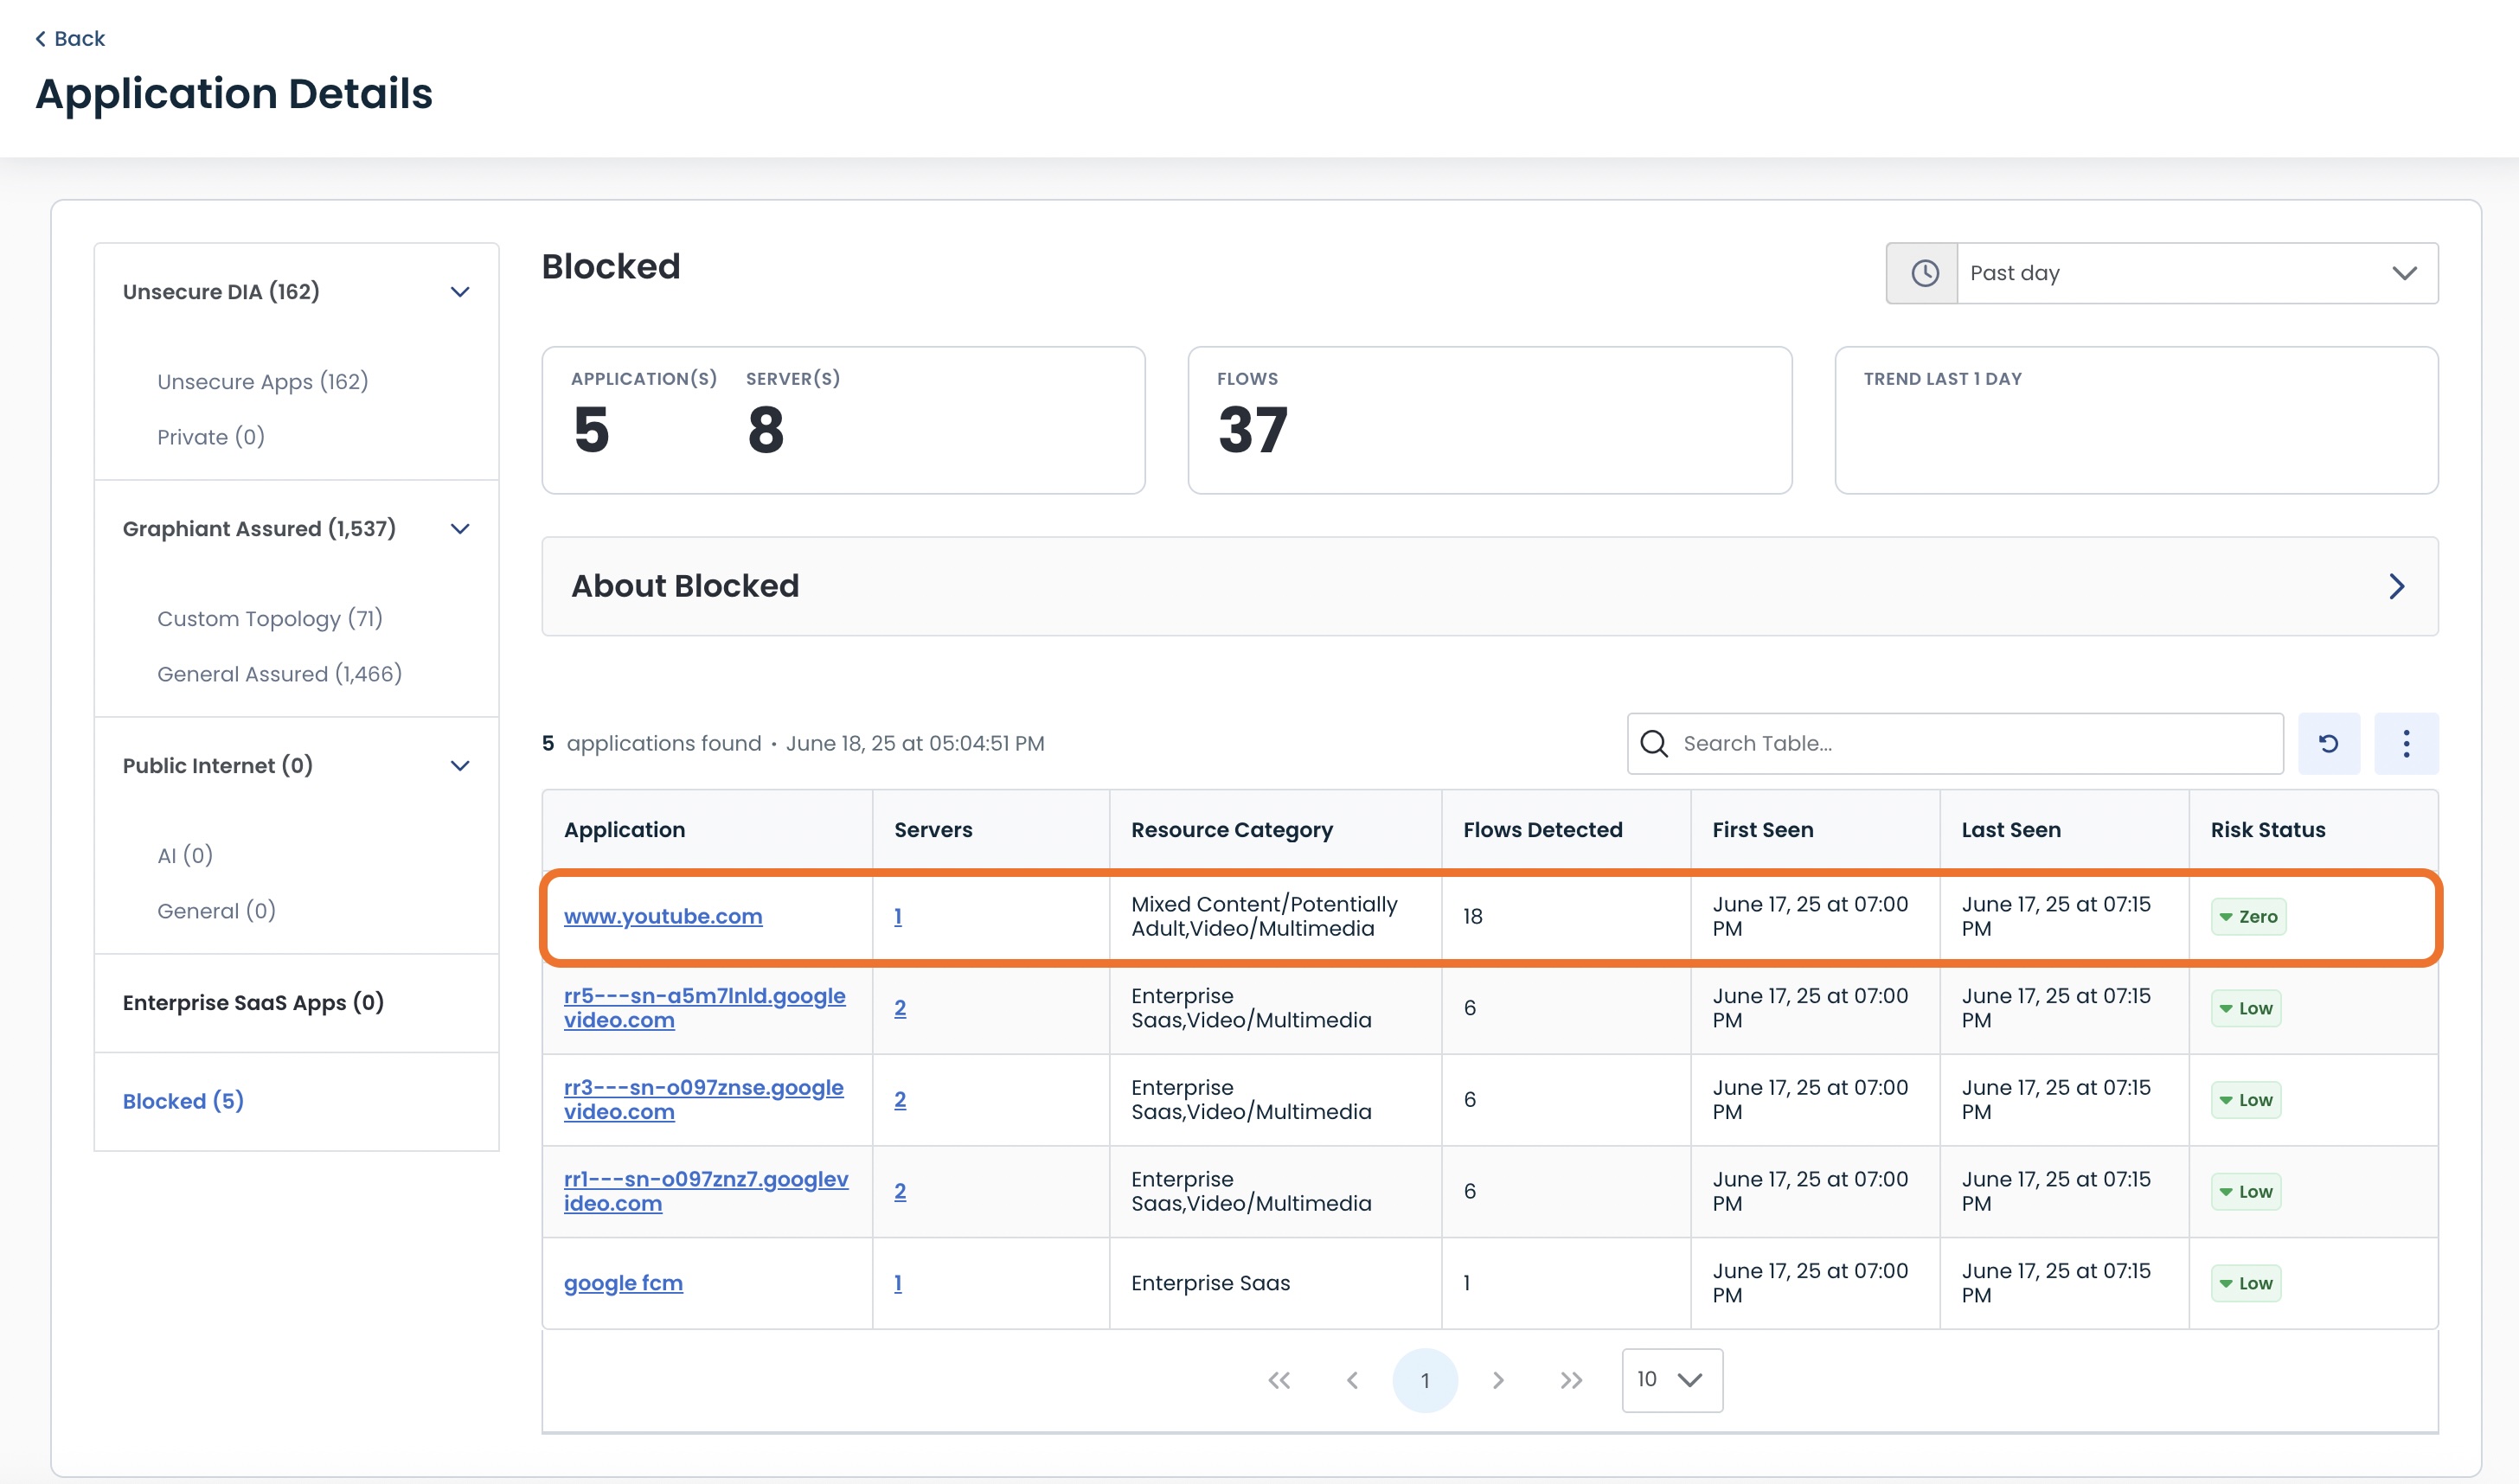
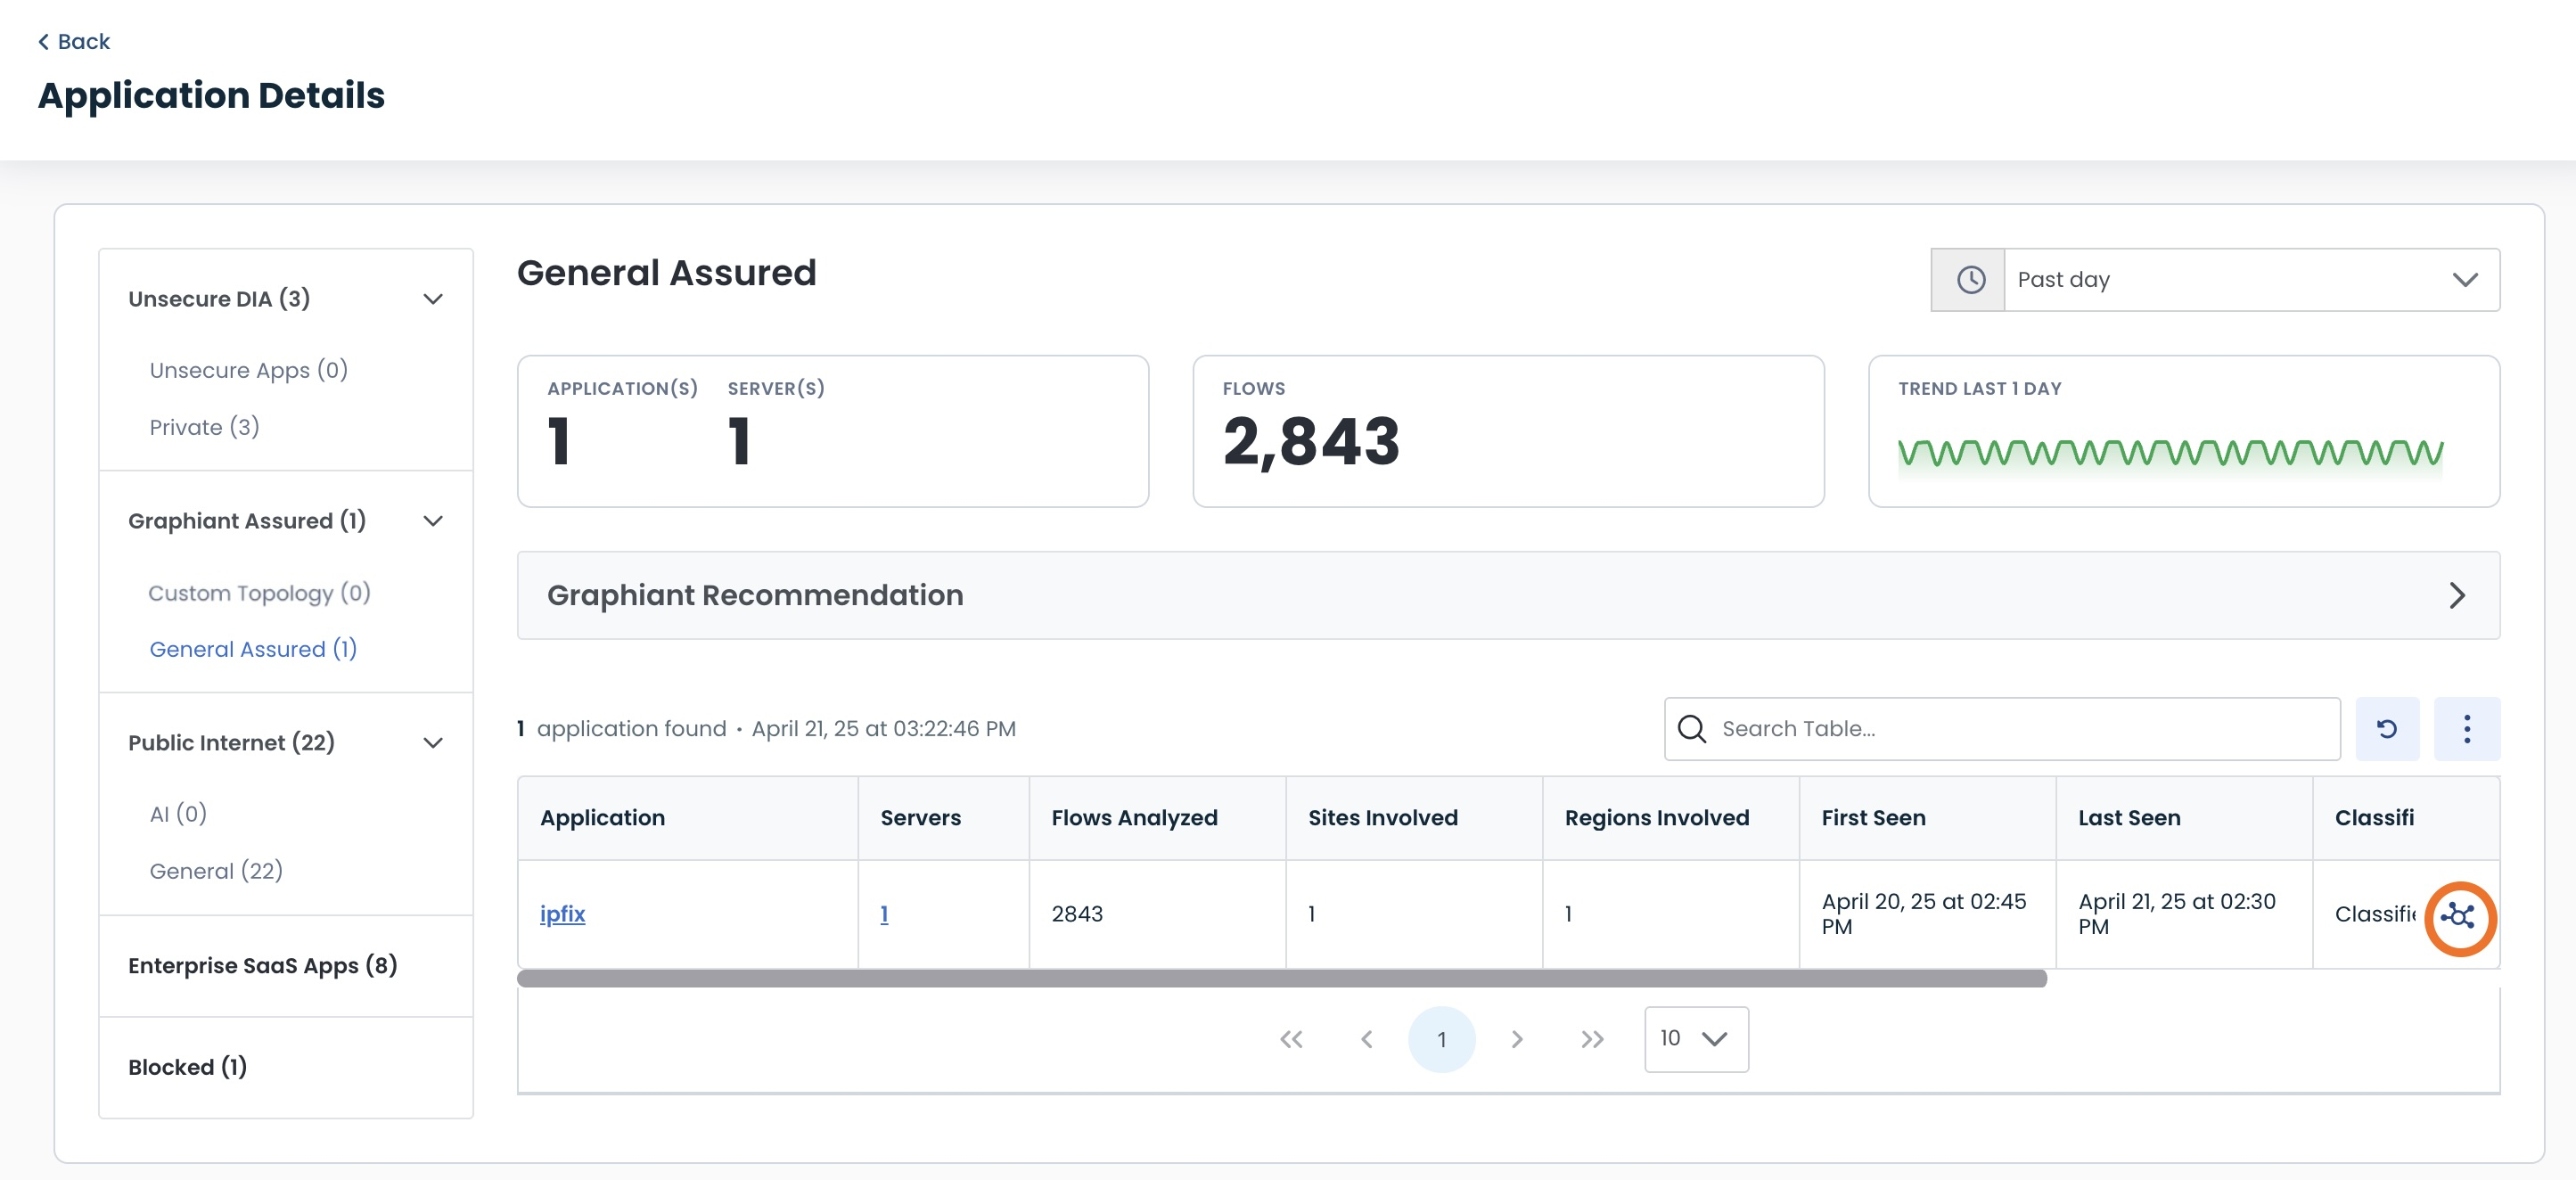
Application Details Table
This table will give you the following information in regards to the applications that are in a specified bucket:
Application: The name of the application discovered
Servers: Number of servers from which the application was sent
Flows Analyzed: Number of sessions for the application
Sites Involved: Number of sites the application is flowing through
Regions Involved: Number of regions the application is flowing through
First Seen: First occurrence of the application discovered in your network
Last Seen: Latest occurrence of the application discovered in your network
Classification: Whether the application is classified (the application is known and named) or unclassified (the application is unknown and not named)
Recommendation (Coming soon): Action that Graphiant recommends you take regarding that application to protect your network
The total numbers of applications, servers involved, and flows will be tallied at the top of the page.
Here you will also see the trend of the apps in that bucket over the last day.
.jpg)
Any application within the Application Details Table that has a yellow bar next to it, no matter which bucket, is unclassified and needs your attention.
Click the folder with the (+) to begin the classification process.
.jpg)
Filtering Private Internal Infrastructure Traffic
Before Data Assurance analyzes and categorizes flow records, you can define internal DNS and proxy servers that you would like to be excluded from analysis.
Excluding these sources prevents your data from being inundated with internal high-volume and operational traffic — allowing dashboards, risk metrics, and recommendations to focus on meaningful application behavior.
Note:
These exclusions do not block traffic; they only control which data is analyzed and reported within Data Assurance.
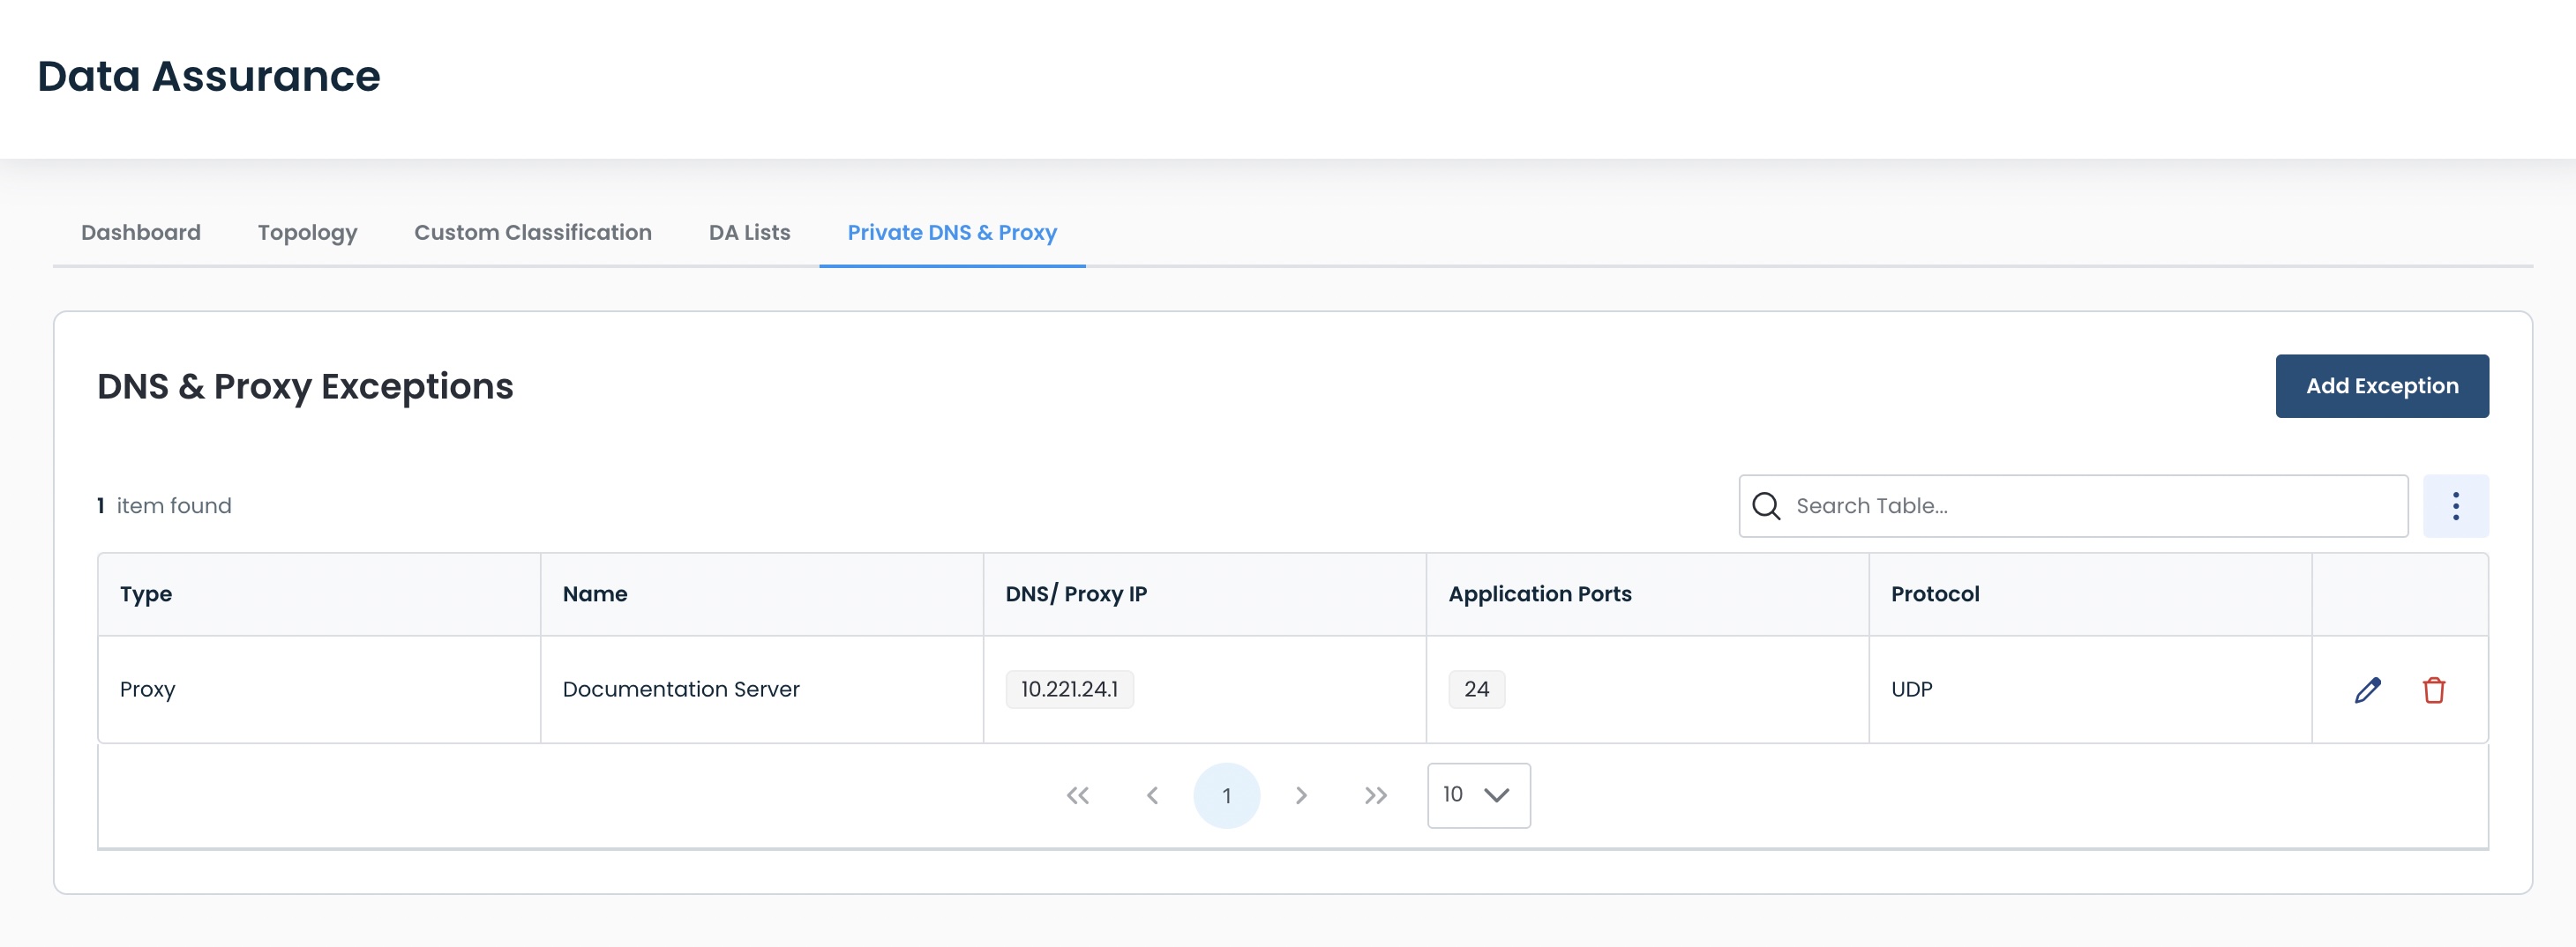
From the Data Assurance landing page, select the ‘Private DNS & Proxy’ tab.
Click ‘Add Exception’.
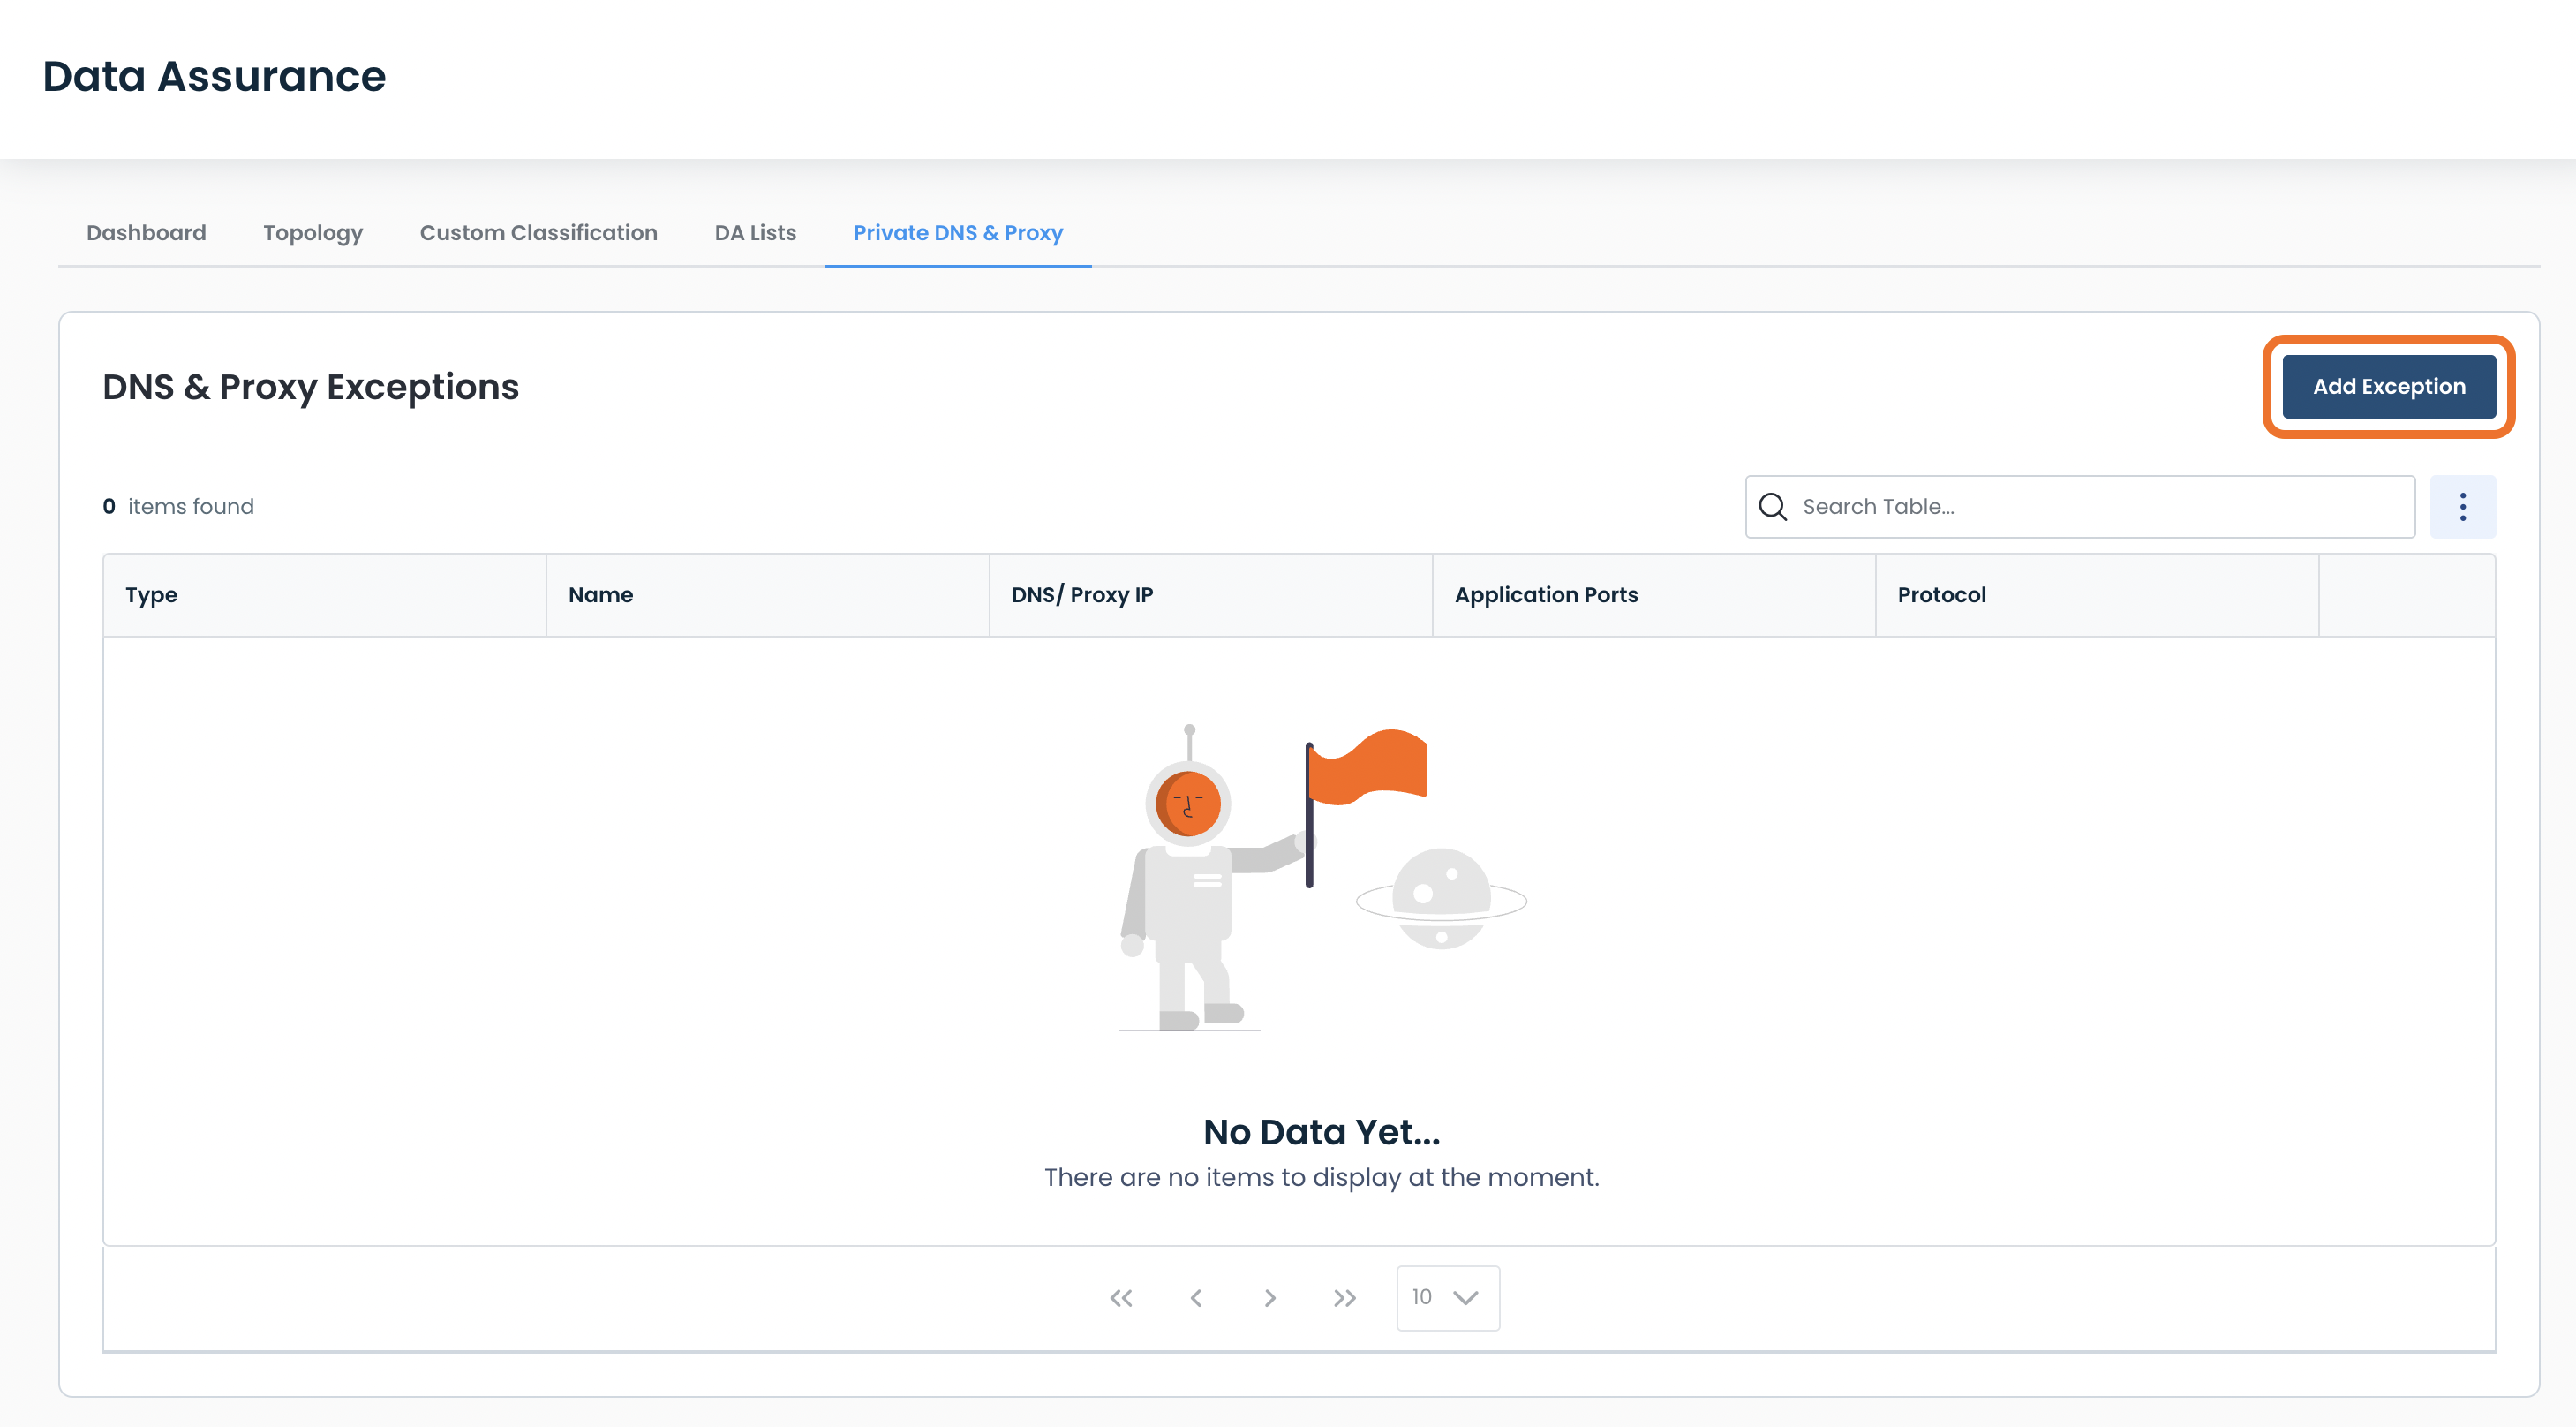
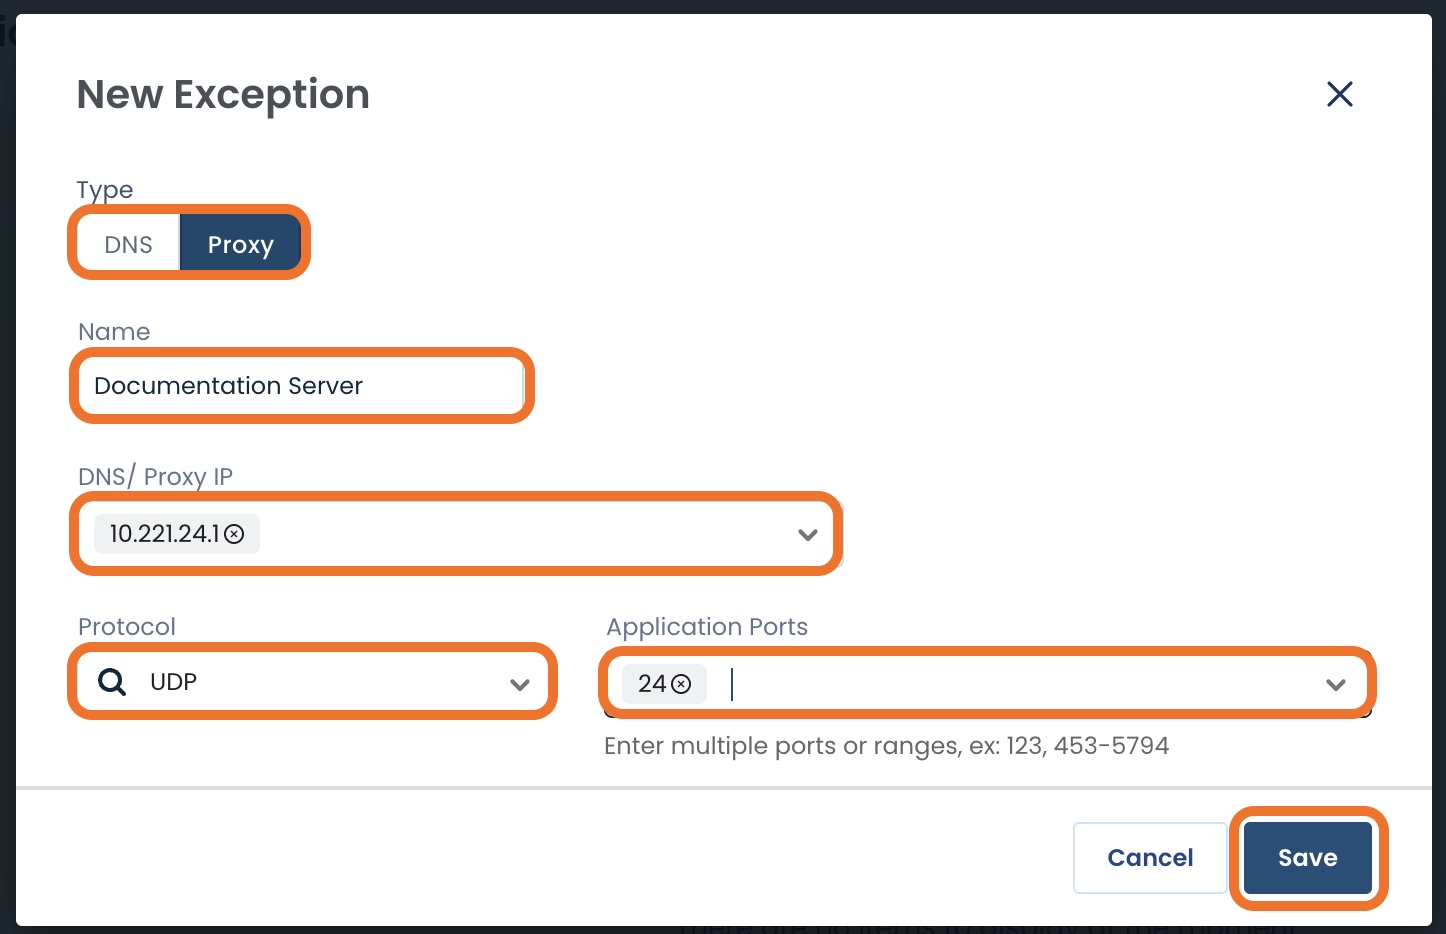
A modal will open to add an exception.
Fill out the following fields:
Type: Choose whether you are excepting a proxy or DNS server
Name: Assign a name to the excepted server
DNS/Proxy IP: The IP address of the server
Protocol: From the drop-down, select the needed protocol
Application Ports: Type / select from the drop-down the appropriate port (s)
Click ‘Save’.
The exception has been created and is now in the table.
Their internal traffic will no longer be included in the Data Assurance information.
Classifying Applications within Data Assurance
Classified v/s Unclassified Applications
Applications that go through your network may be instantly recognized by Graphiant; for example if they are well-known public applications like YouTube etc, or if they have been previously identified by you and are already in a Graphiant Data Assurance bucket. For information on the different Data Assurance buckets, click here.
These applications are automatically Classified, as their source is assured.
Applications that aren't recognized by Graphiant, such as private applications within your business or an unknown application coming to your network from the internet are listed as Unclassified.
How to Classify an Application
To classify (i.e. identify and name) an application, click the 'folder(+)' icon to the right of that application.
This opens a modal with information for this specific application:
Impacted Areas: Number of clients, regions, sites, and IP addresses through which the application traveled
Server details: IP address and Port number to which the application was consumed
Flows Analyzed: Number of sessions for the application
Clients Involved: Number of devices accessing the application
Sites Involved: The sites through which the application went
Regions Involved: The regions through which the application went
LAN Segments Involved: The LAN segments over which the application travelled
First Seen: First occurrence of the discovery of the application in your network
Last Seen: Last occurrence of the discovery of the application in your network
Click on the 'Folder(+)' icon to the right.
.png)
This will open a modal where you can identify or name the application.
You can identify the application in one of two ways:
If the application will be classified with a new name, click the 'Create New' button and name your application.
If the application will be named as a previously-identified classification, click the arrow and select the desired name from the dropdown.
.png)
The IP Prefix(es), Protocol, and Port(s) will be auto-filled.
'Save & Apply'.
.png)
Note:
Should you want to add other prefixes / ports to this Classification, you can click the (+) in the right of the "Classification List" box before 'Save & Apply'.
.png)
You will be directed back to the Application Details Table, where the newly-named Application will now show as classified.
 after HIPAA(2).jpg)
If you would like to see the topology the application traveled, click the ellipses, then select the ‘topology’ icon.
 after HIPAA(2).jpg)
This will open the Topology map where you can see the paths your data has travelled; for more information on the topology of applications within Data Assurance, click here.
.png)
Viewing Your Custom Classifications
You can easily view all of the applications that you have classified in one table by clicking the 'Custom Classification' tab from the Data Assurance landing page.
.png)
This will bring up the Custom Classifications Table, which includes the following information:
Name: Name of the application you classified
Application IP Prefixes: Any prefixes that the application utilizes
Application Ports: Any ports that the application utilizes
Protocol: Protocol the application utilizes
.png)
Should any of the aspects of the application information change, you can edit any of the classifications by clicking the edit symbol to the right of the application.
.png)
Edit any field desired, and click 'Save'.
.png)
Note:
Only one entry per field is accepted. To add entries, see below.
Should you need to add additional prefixes, protocols, or ports, simply click the '(+)' symbol.
.png)
You can enter a completely new set of prefix, protocol, and port; or you can add a new prefix, protocol, or part for an existing set by entering the new item in it's appropriate field, and then duplicate the information in all remaining fields.
Click 'Save'.
.png)
Note:
When multiple values are entered, the 1st value of each field are a set, then the 2nd values, etc.
.png)
Using Graphiant’s Data Assurance to Protect Your Network
With Graphiant Data Assurance, you are able to control what applications are allowed in, or blocked from, your network.
You can create policies for both:
Assuring that certain applications are safe across your network
Blocking unsecured applications from ever entering your network
These policies are called Data Assurance Lists.
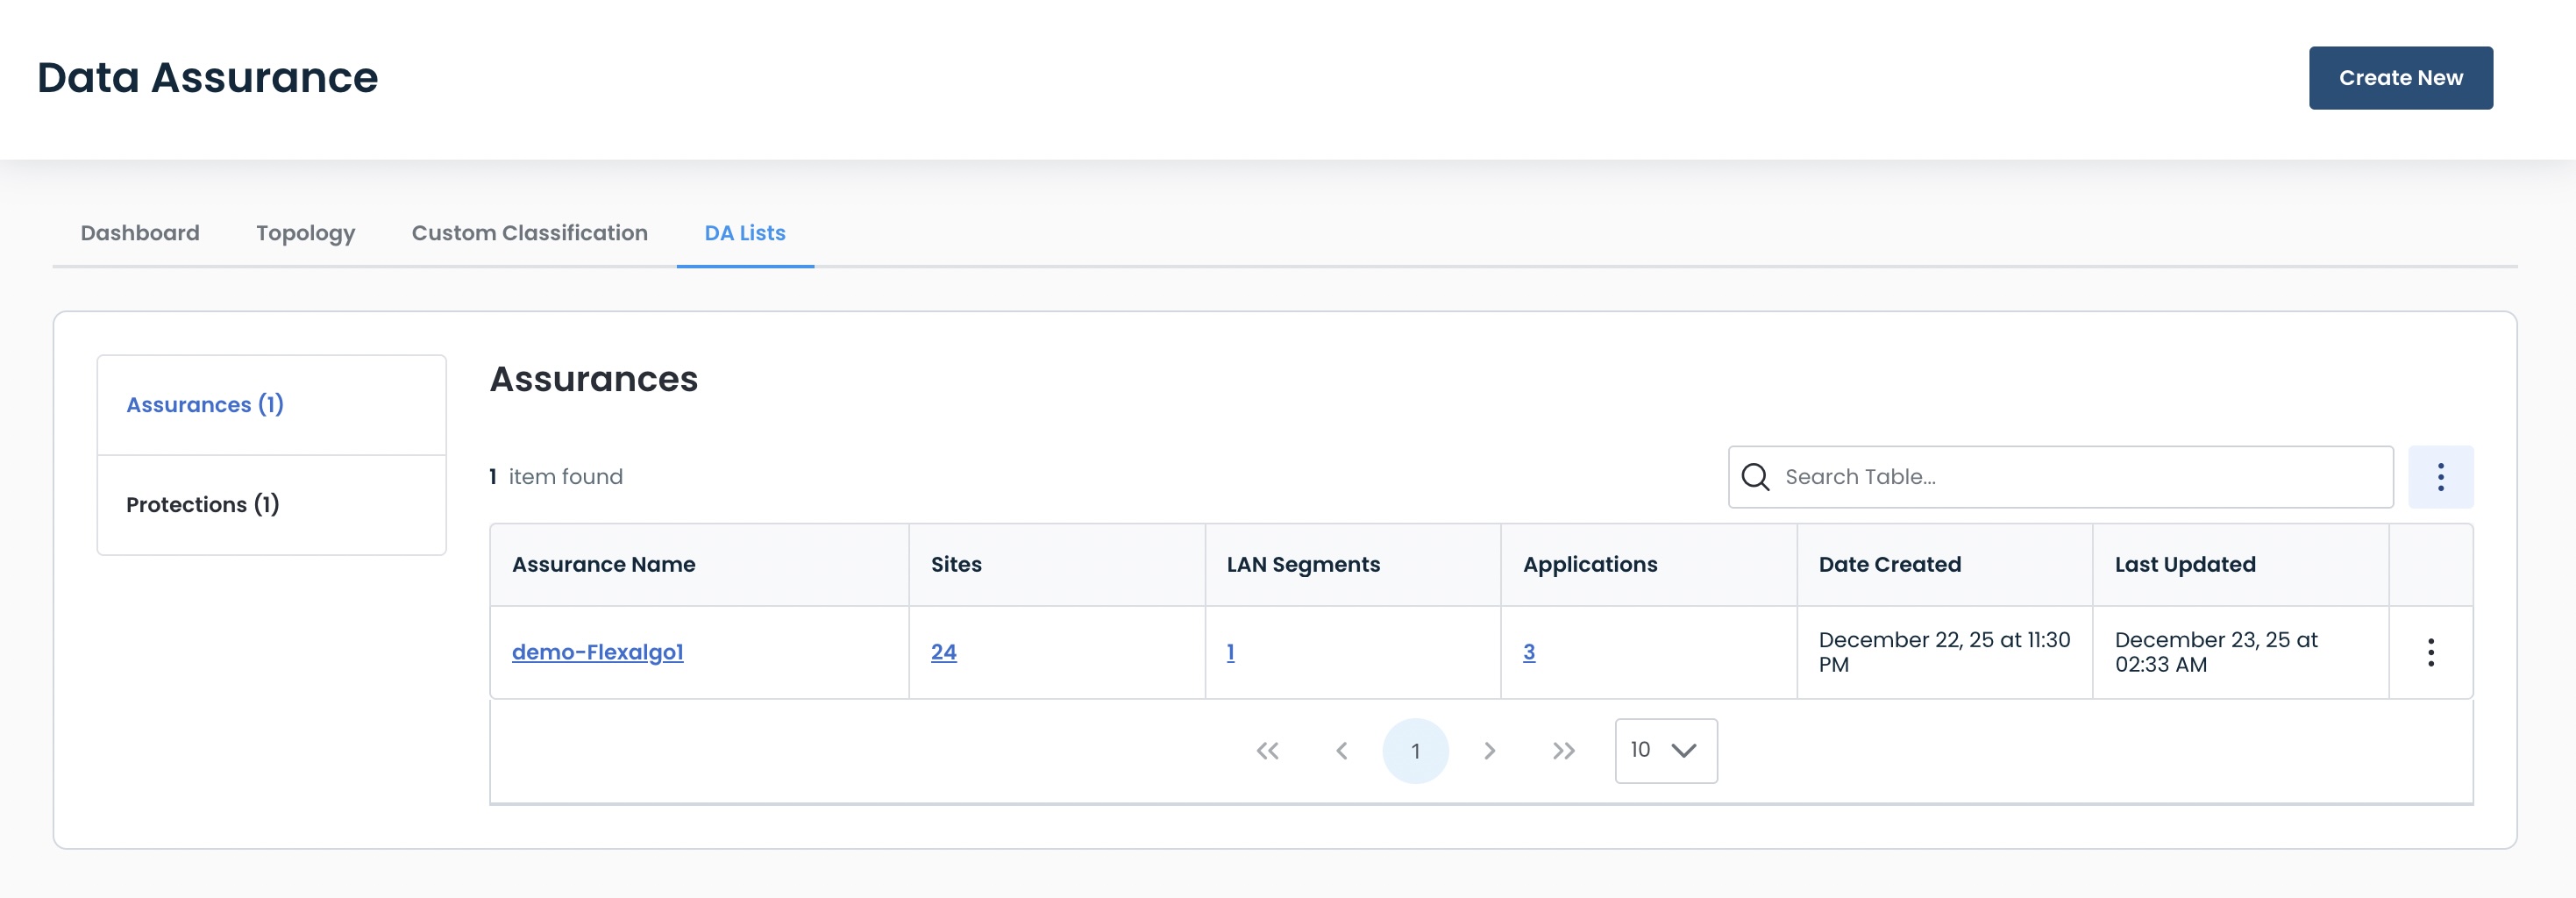
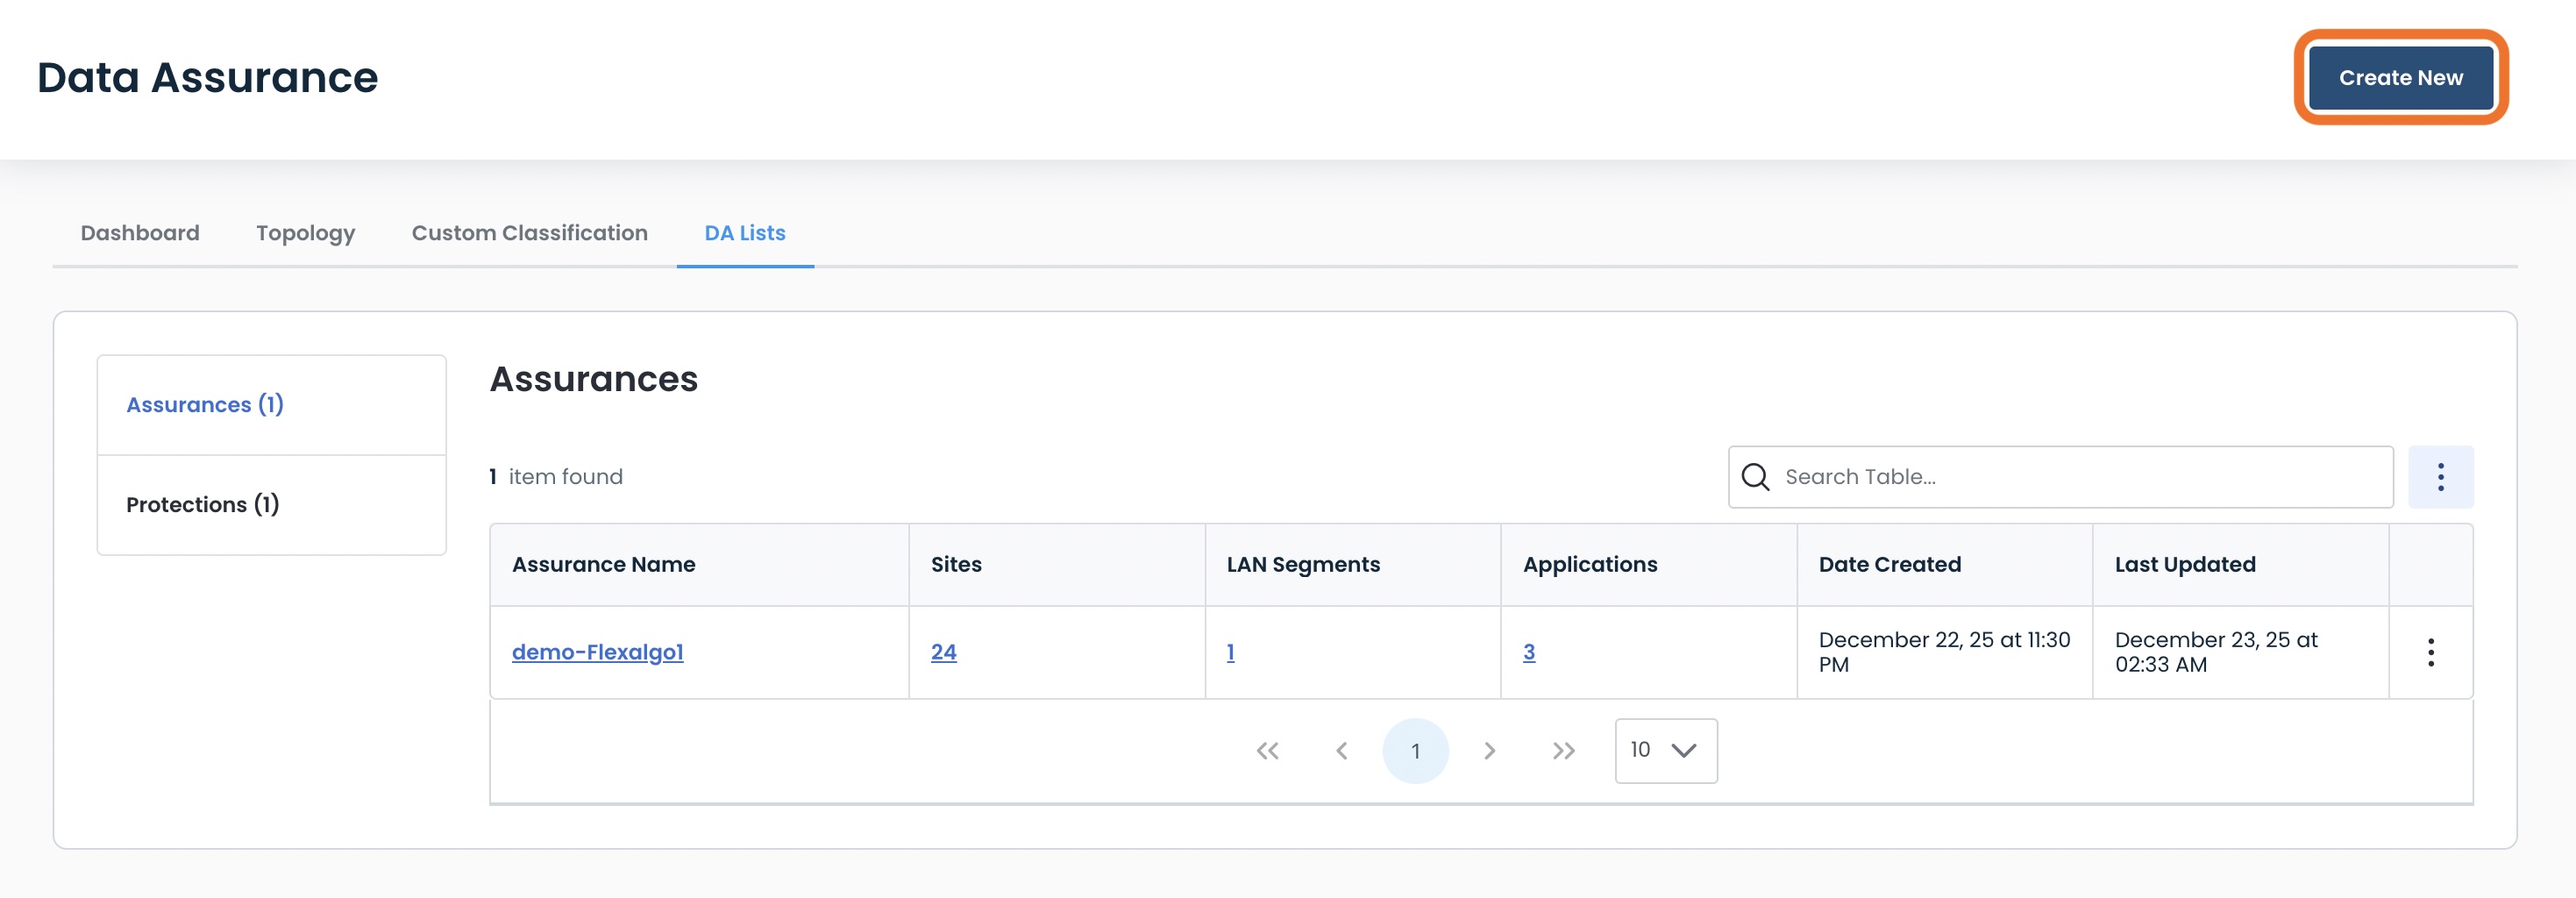
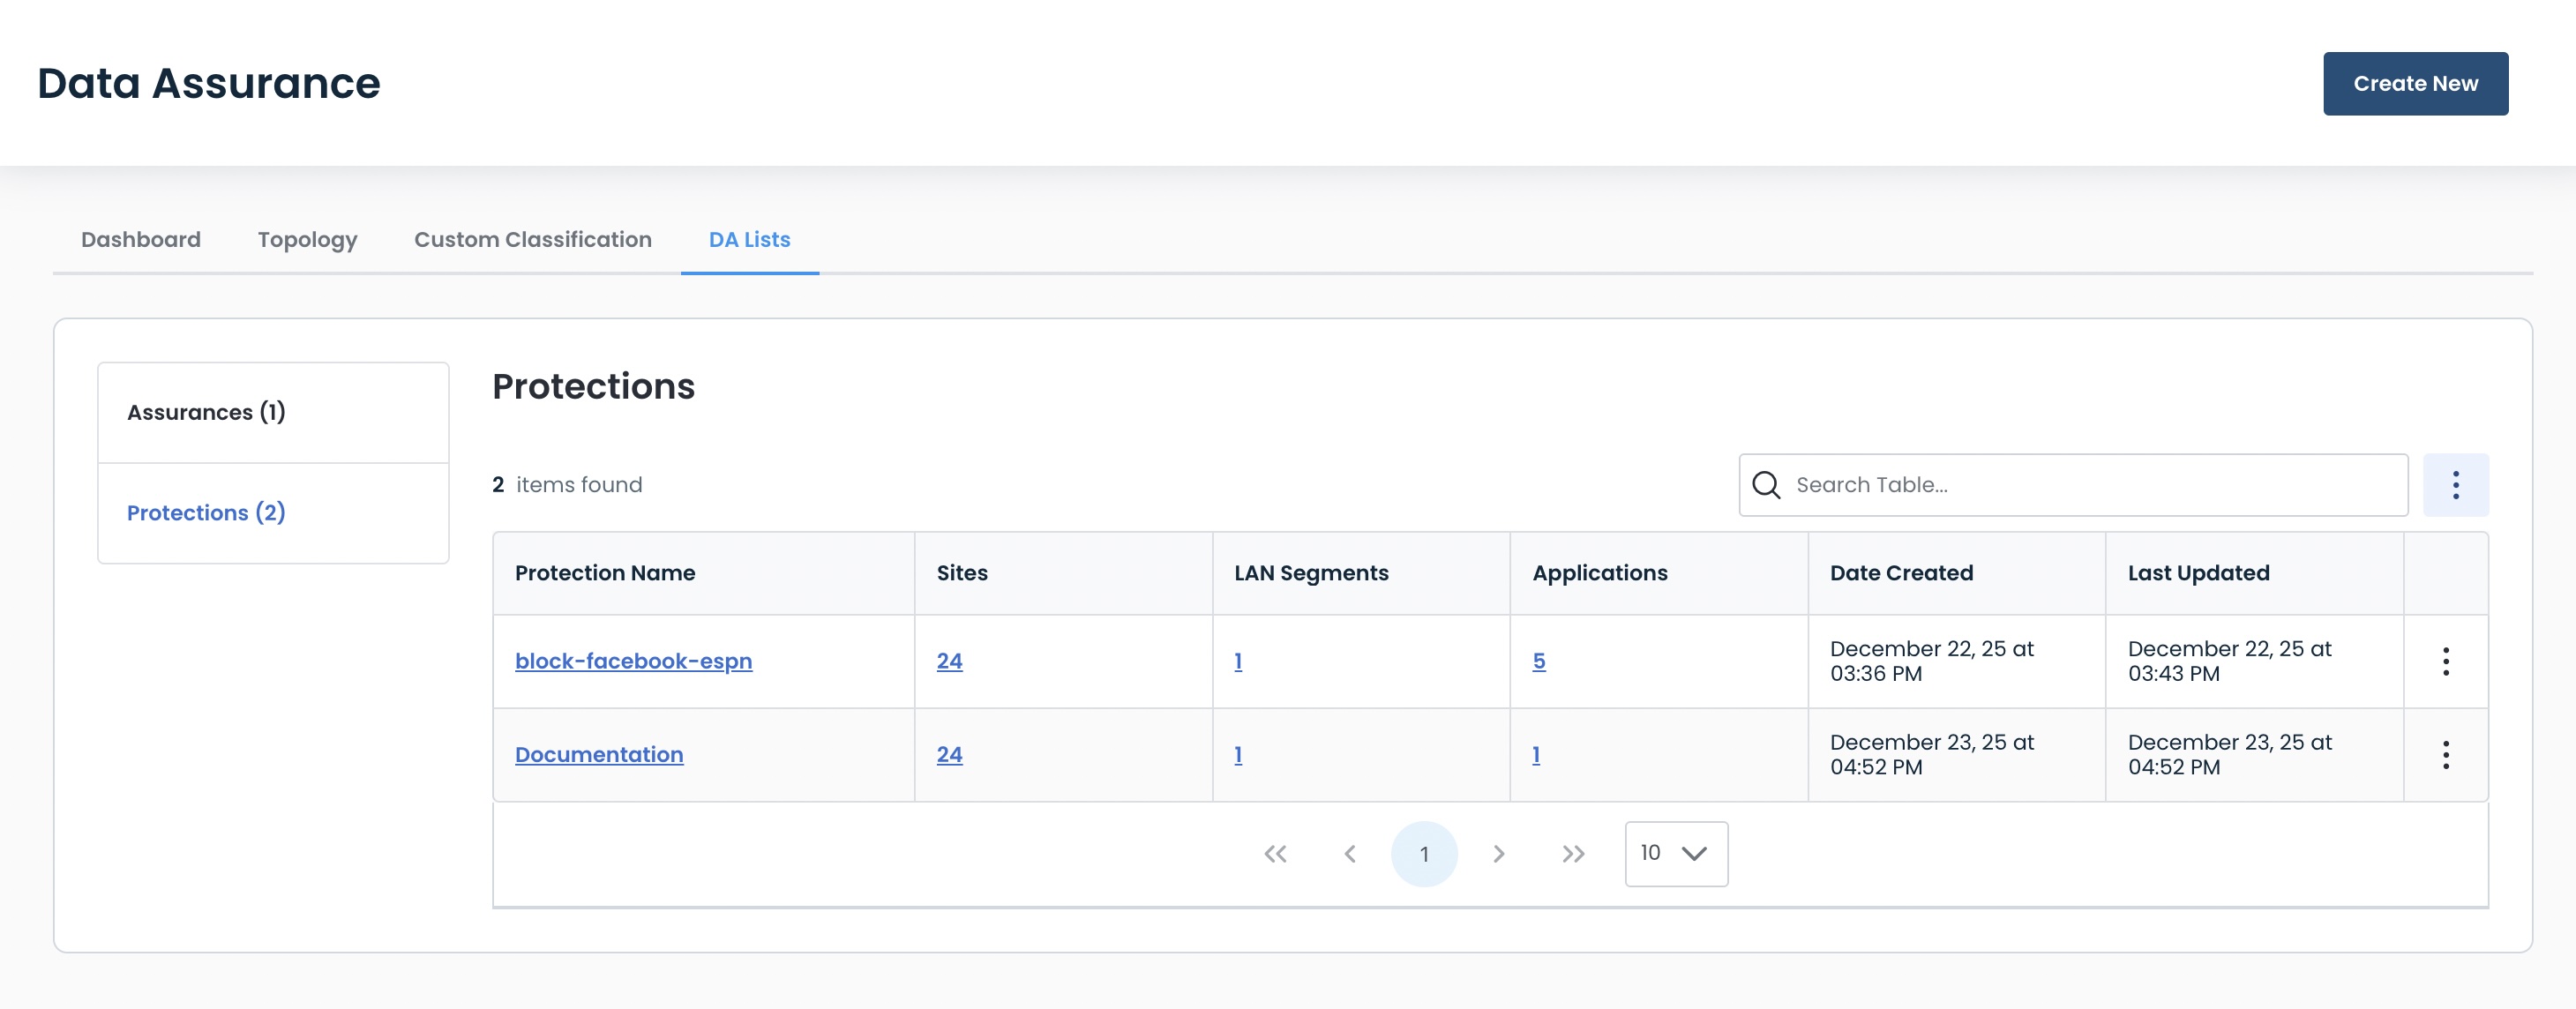
From the Data Assurance Dashboard, click the ‘DA Lists’ tab.
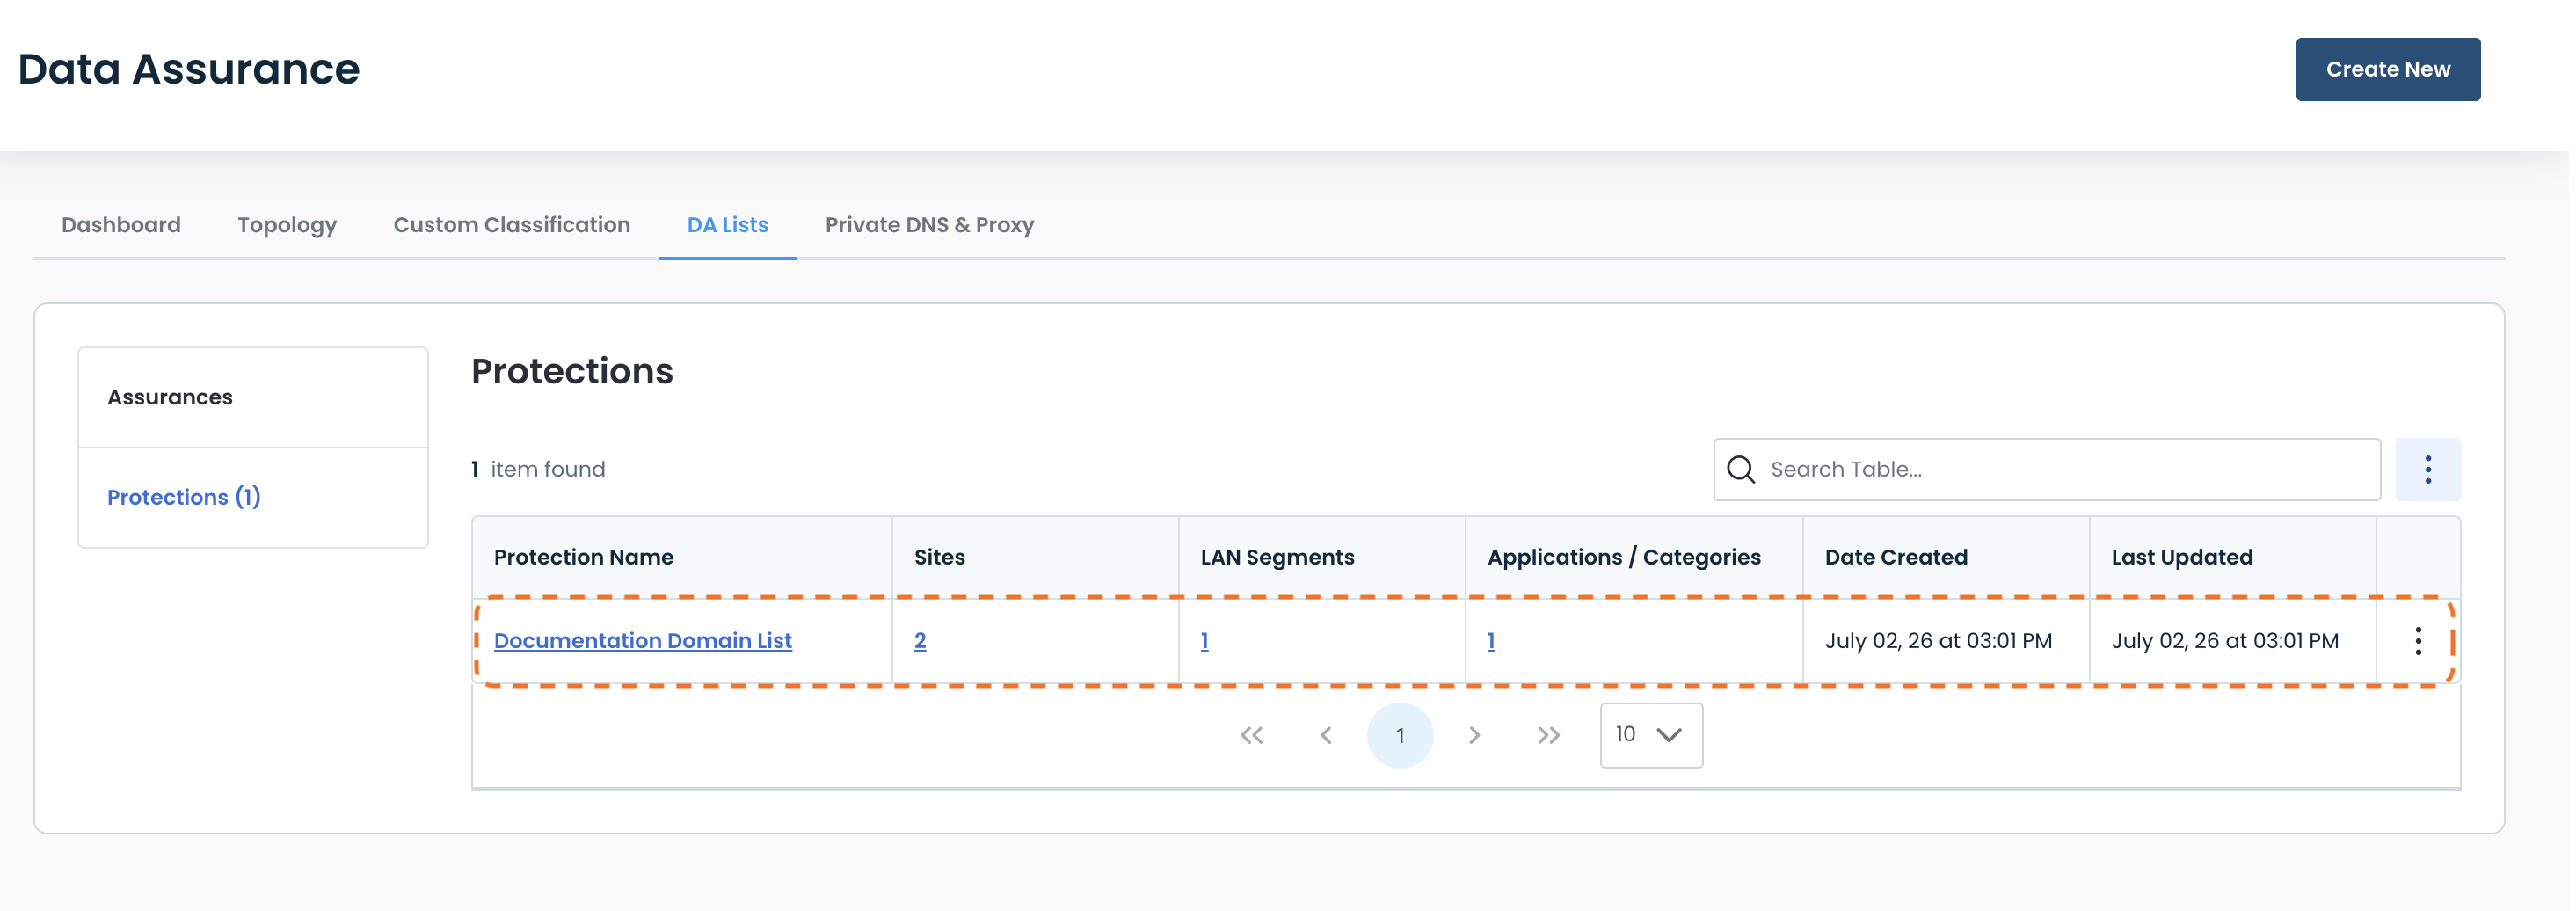
The Data Assurance Lists landing page shows you what Assurances and Protections you have.
Assurances: Contain applications that you have classified and confirmed are safe to enter your network
Protections: Contain applications that you have blocked due to being unsecured and dangerous to enter your network.
Both tables will show:
Name: Assigned to the list upon creation
Sites: Number of sites included in the list that will adhere to the admission / blocking of applications
Clicking the value will open a modal of the list of sites.
LAN Segments: Number of LAN Segments included in the list that will adhere to the admission / blocking of applications
Clicking the value will open a modal of the list of LAN Segments.
Applications: Number of Applications that are admitted / blocked
Clicking the value will open a modal of the list of applications.
Date Created: Date and time the list was created
Last Updated: Date and time of last edit to the list
Creating a Data Assurance List
To create a new Data Assurance List (for either an Assurance or Protection), click ‘Create New’.
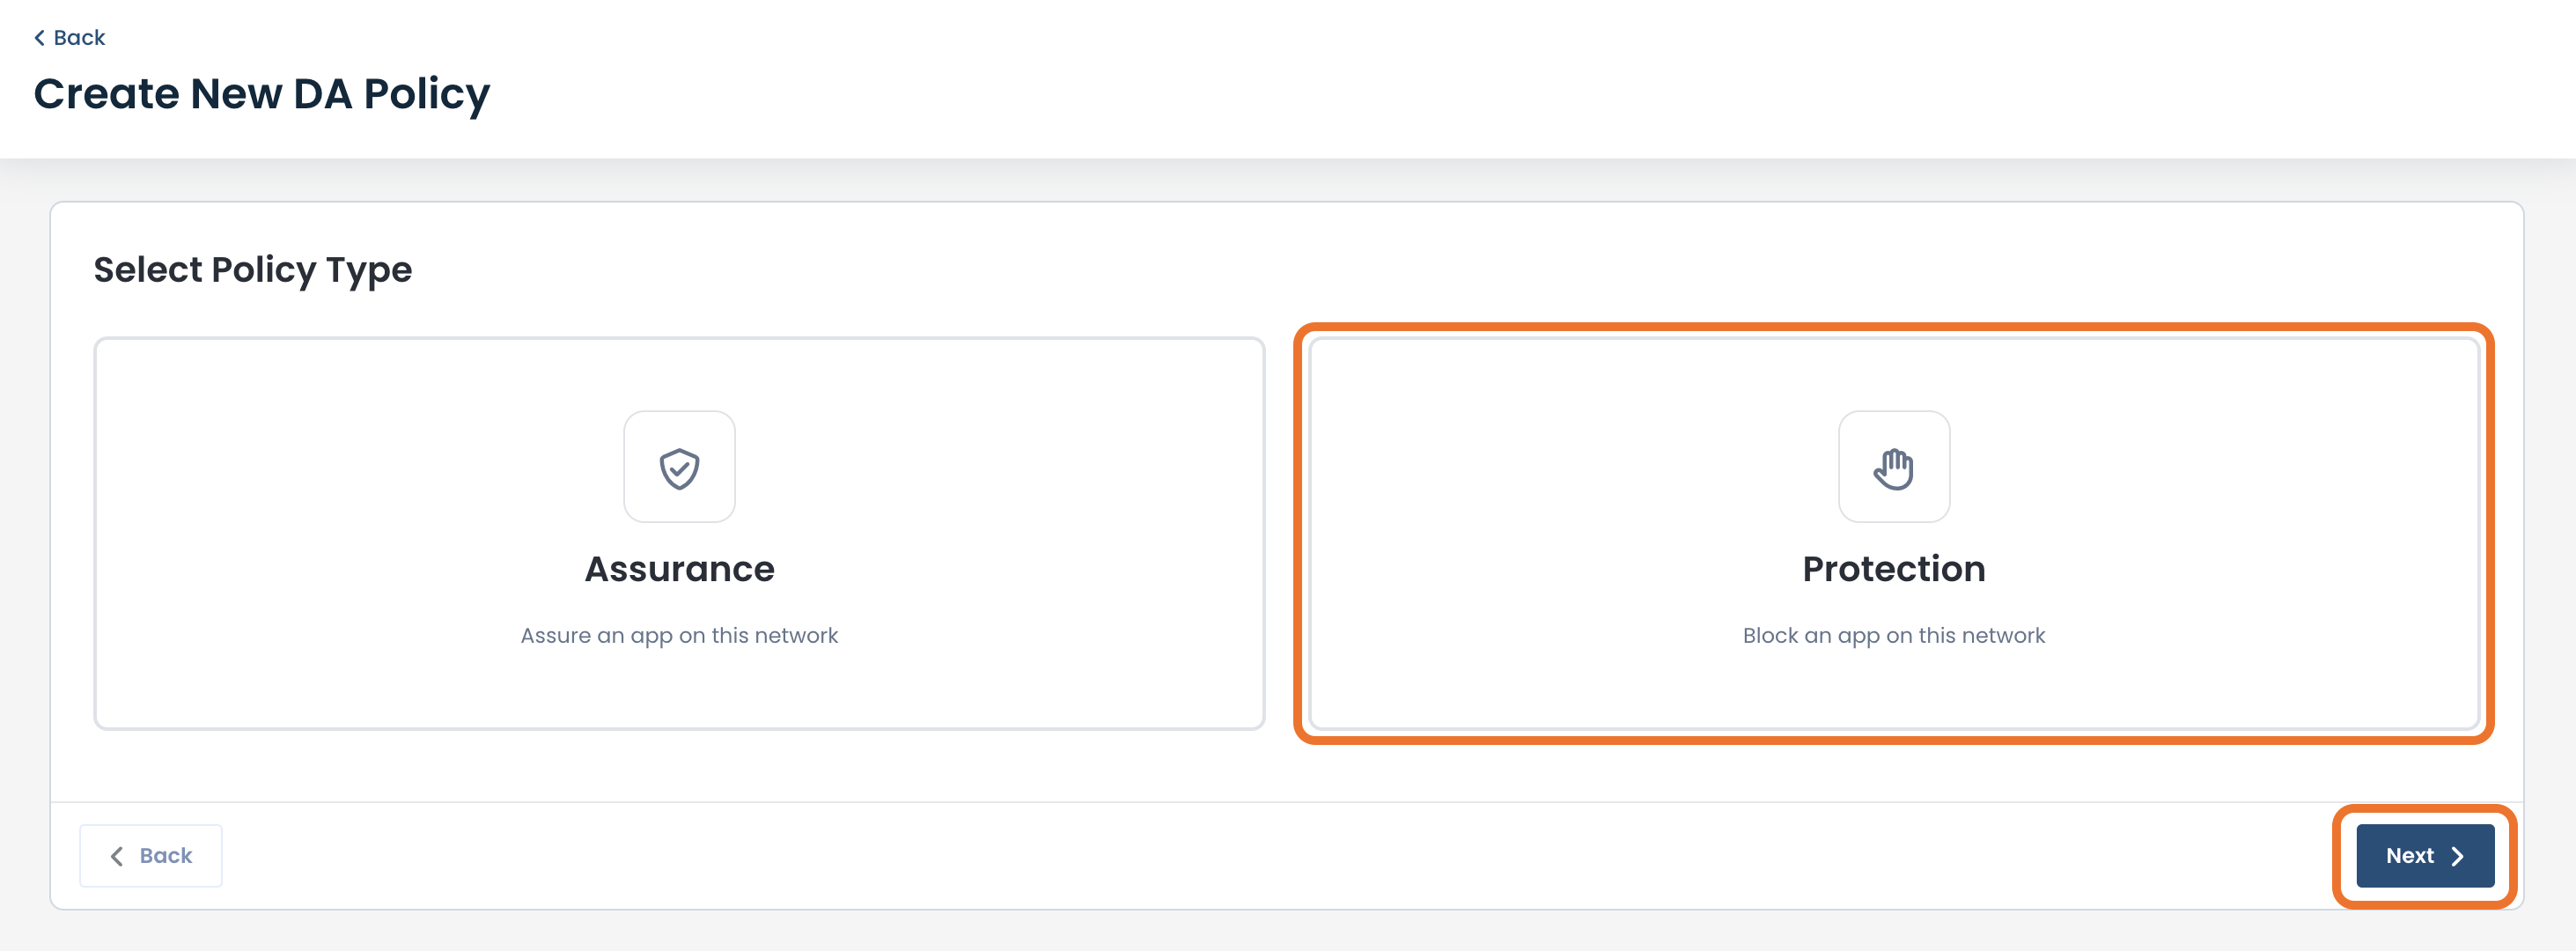
A page will open where you can create a new Data Assurance Policy for either an Assurance or Protection.
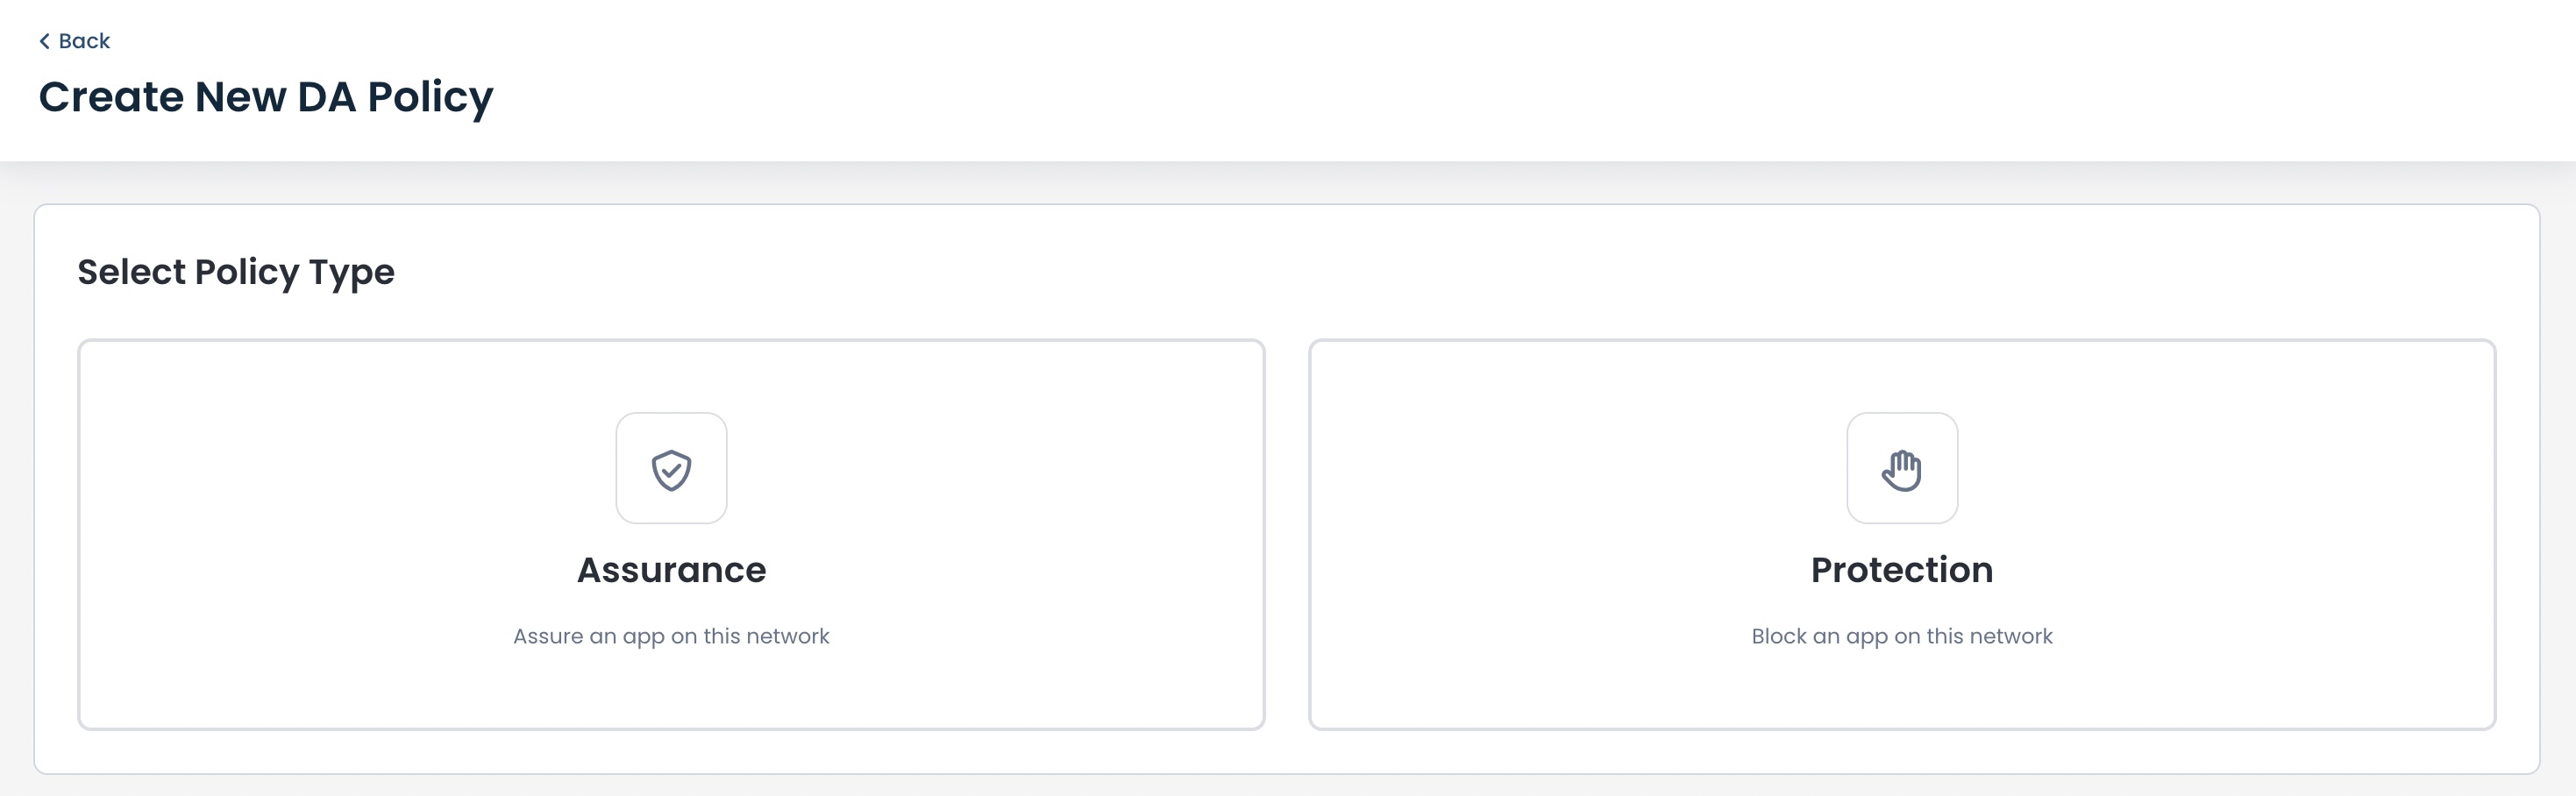
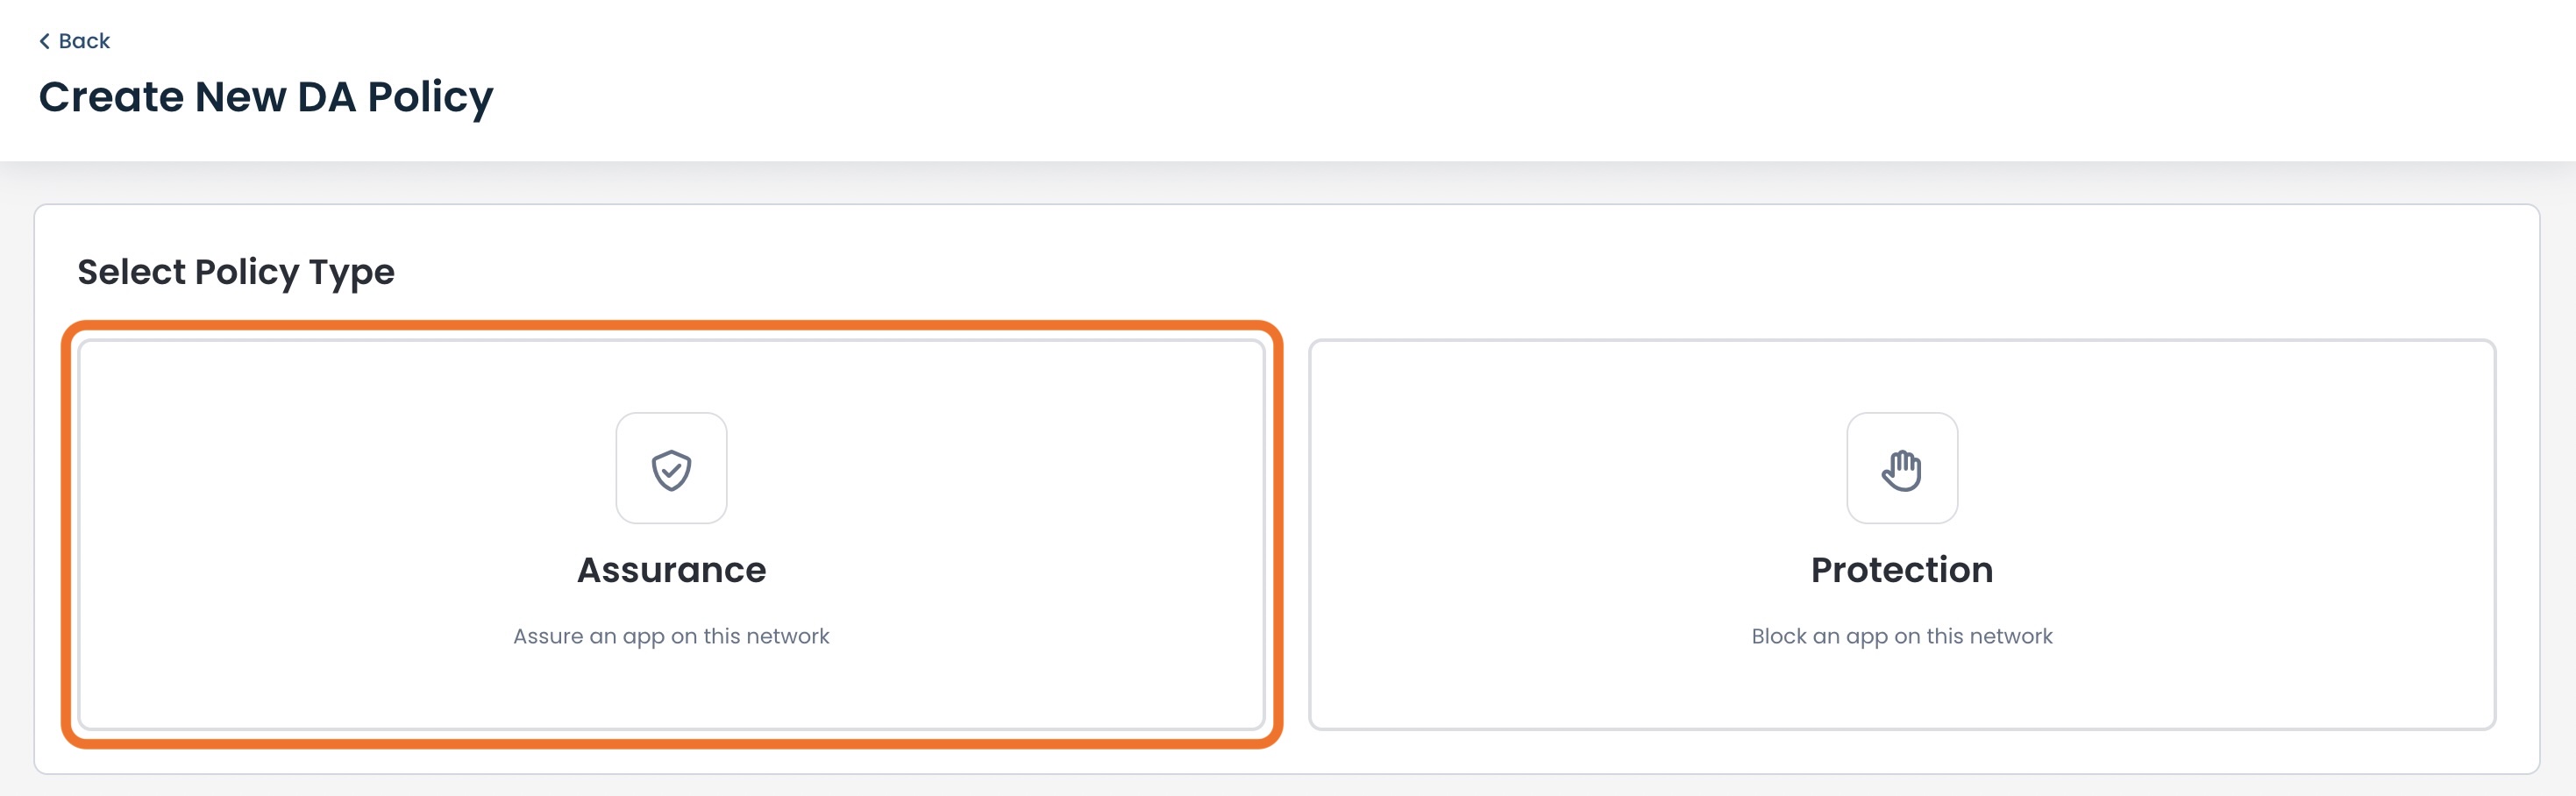
Creating a New Assurance Policy
To add applications to an Assurance Policy that will allow them to automatically enter your network, click ‘Assurance’.
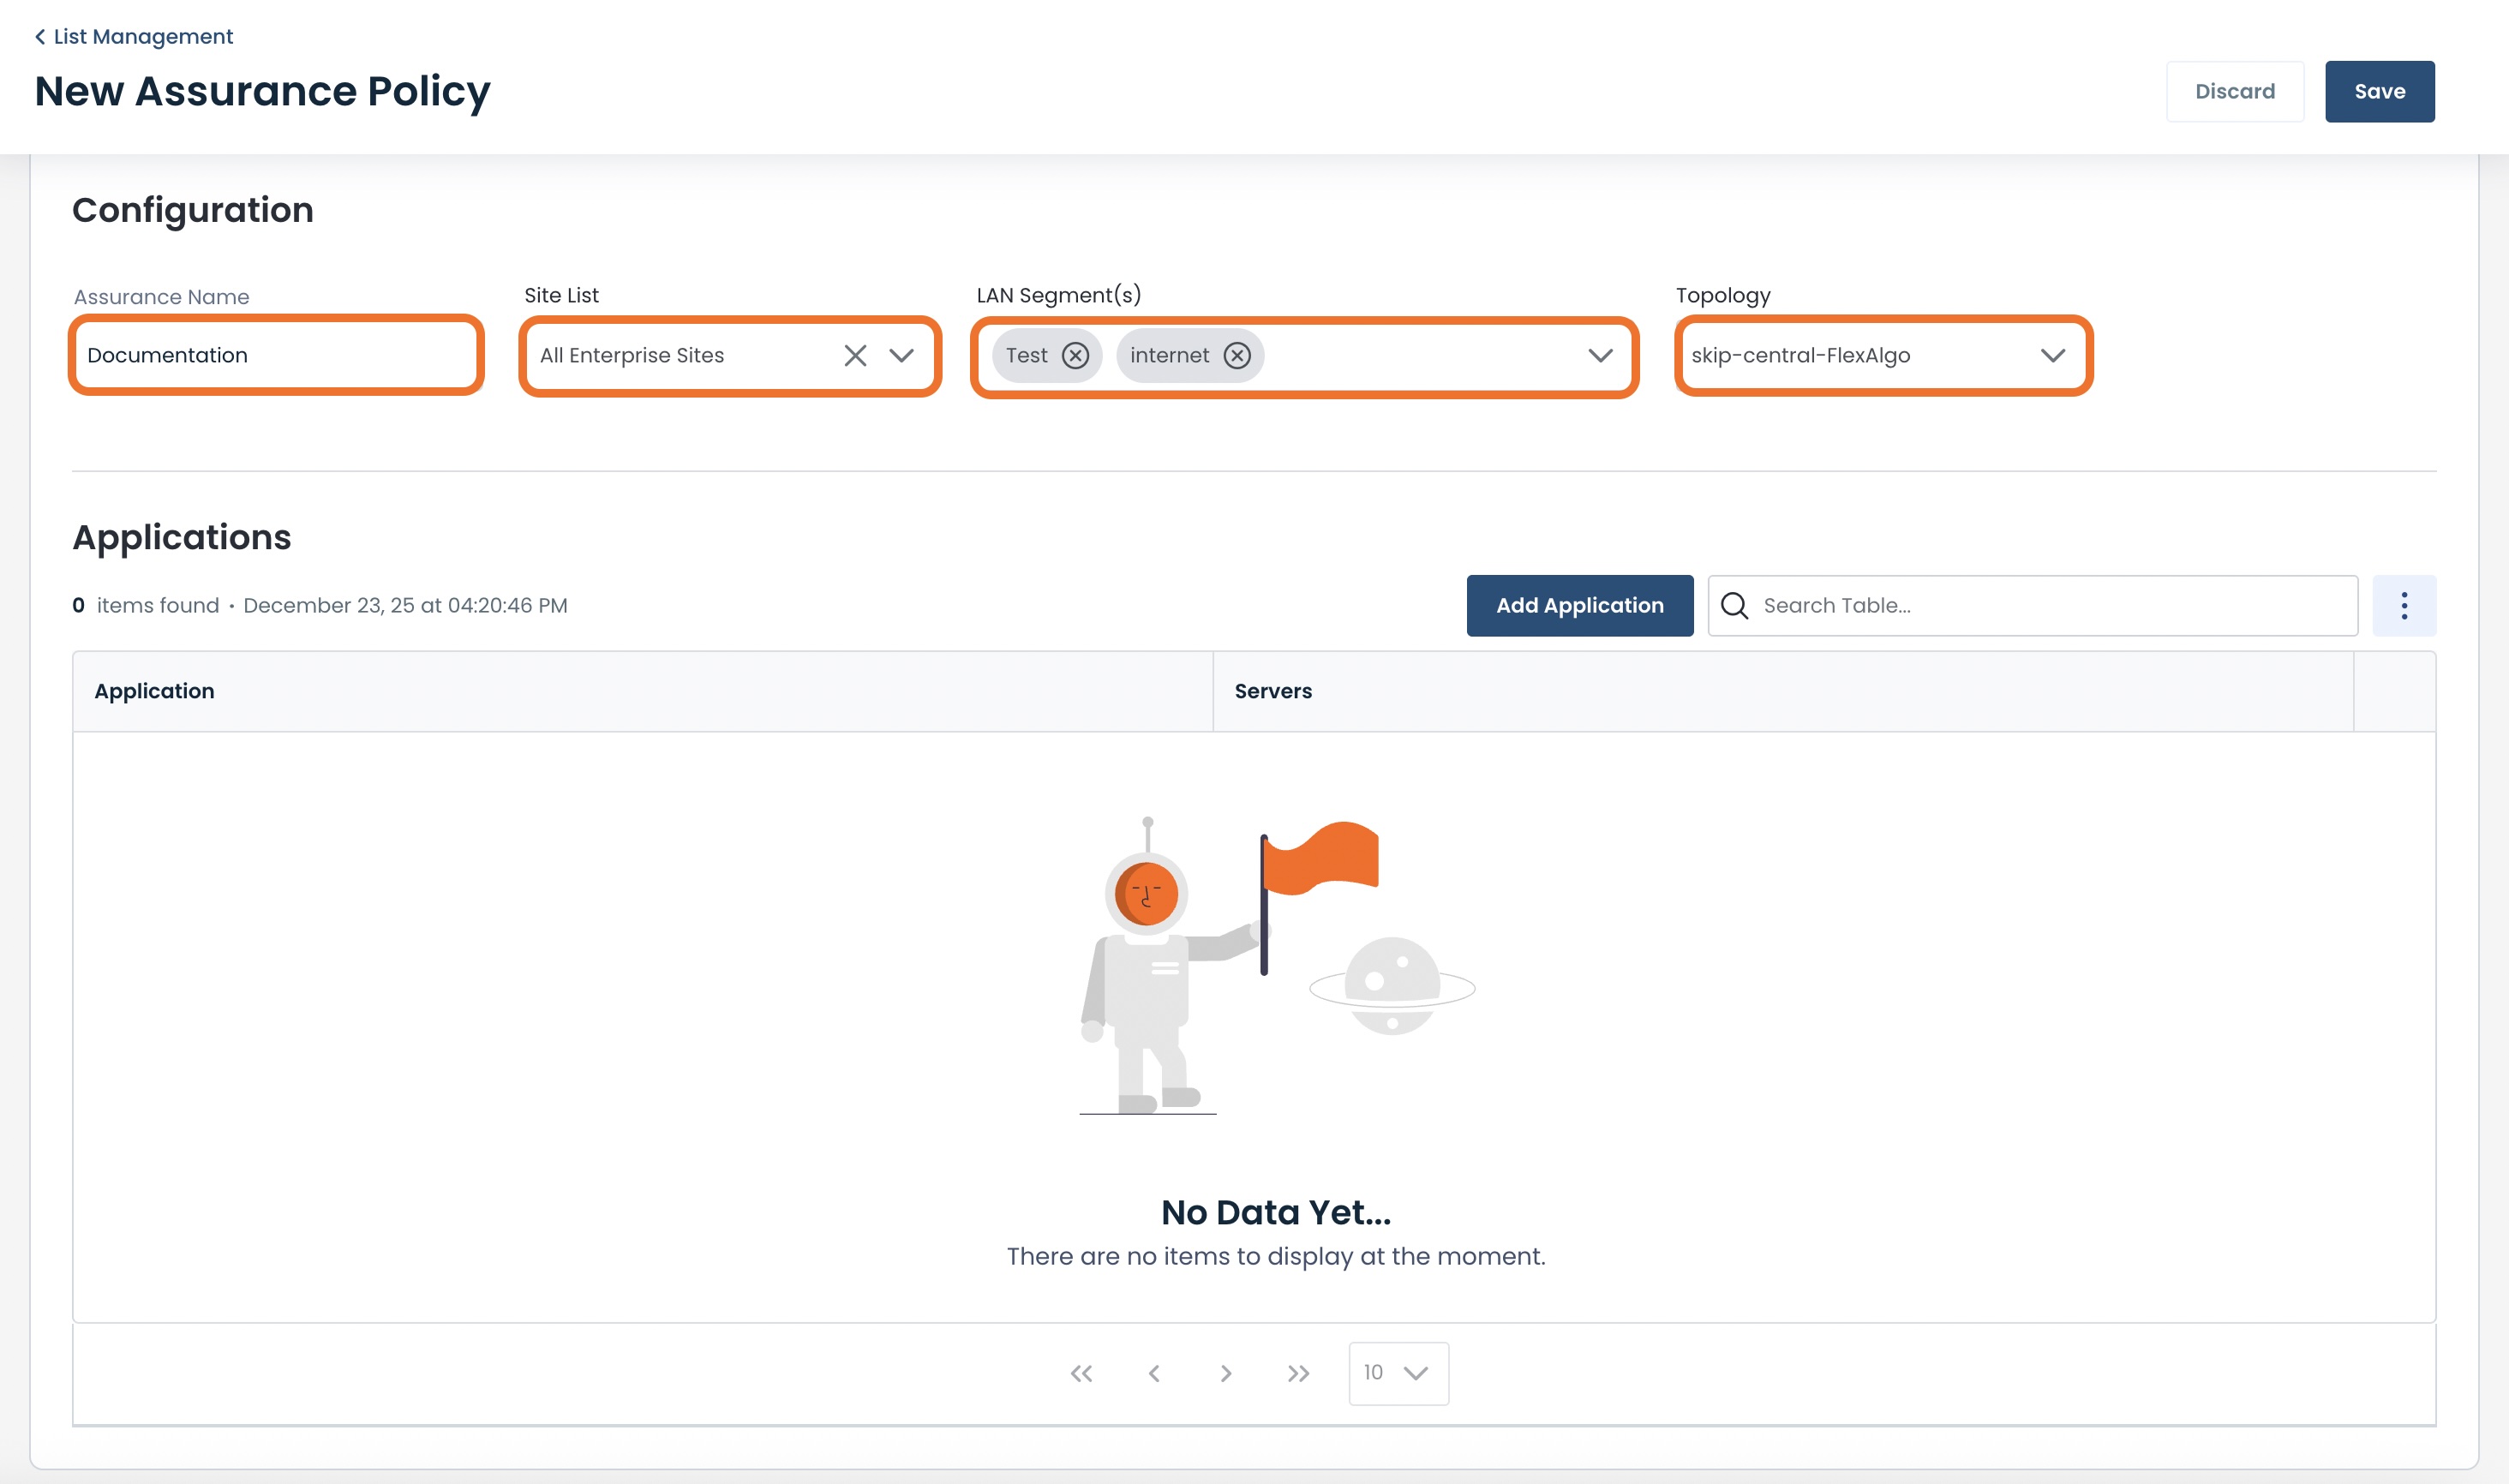
The Assurance Policy configuration page will open.
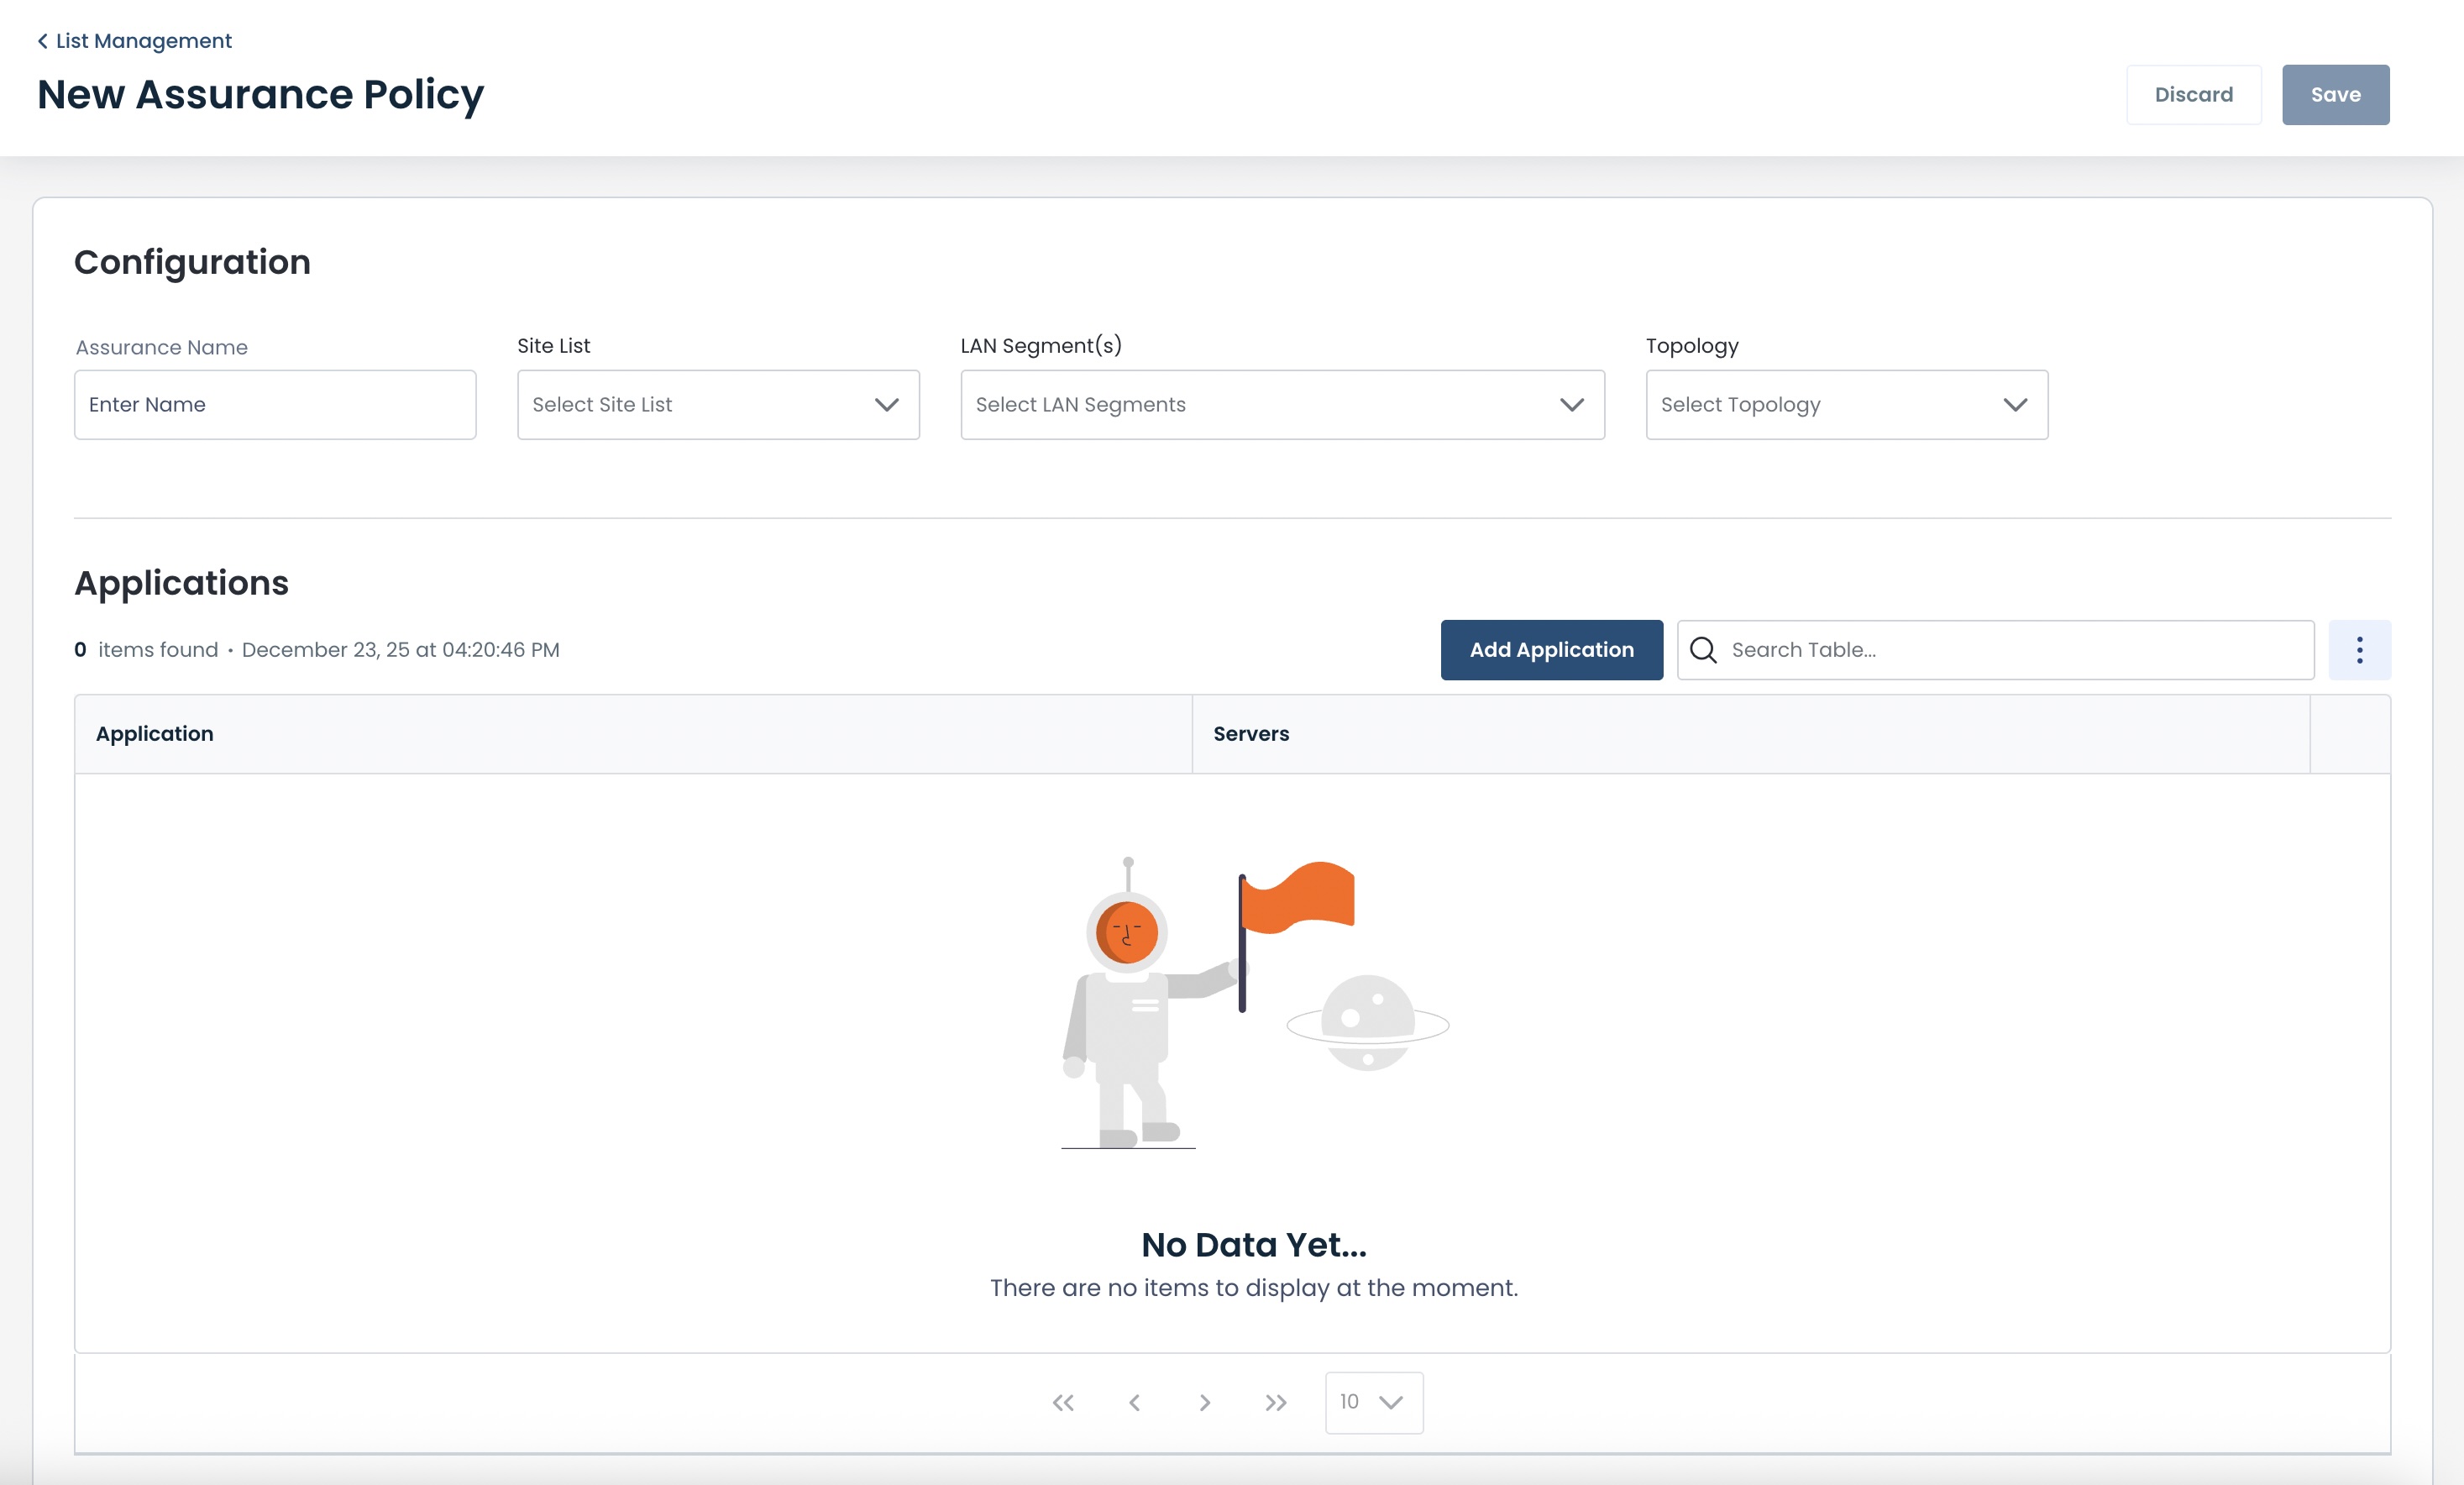
Complete the following fields:
Assurance Name: Type in the name of the new policy that you are creating
Site List: From the drop-down, select the Site List that will be using this policy
For more information on Site Lists, click here.
LAN Segment(s): From the drop-down, select the LAN Segment(s) that will be using this policy
Topology: From the drop-down, select the Topology that this policy will be using
To add an application to be cleared with this policy, click ‘Add Application’.
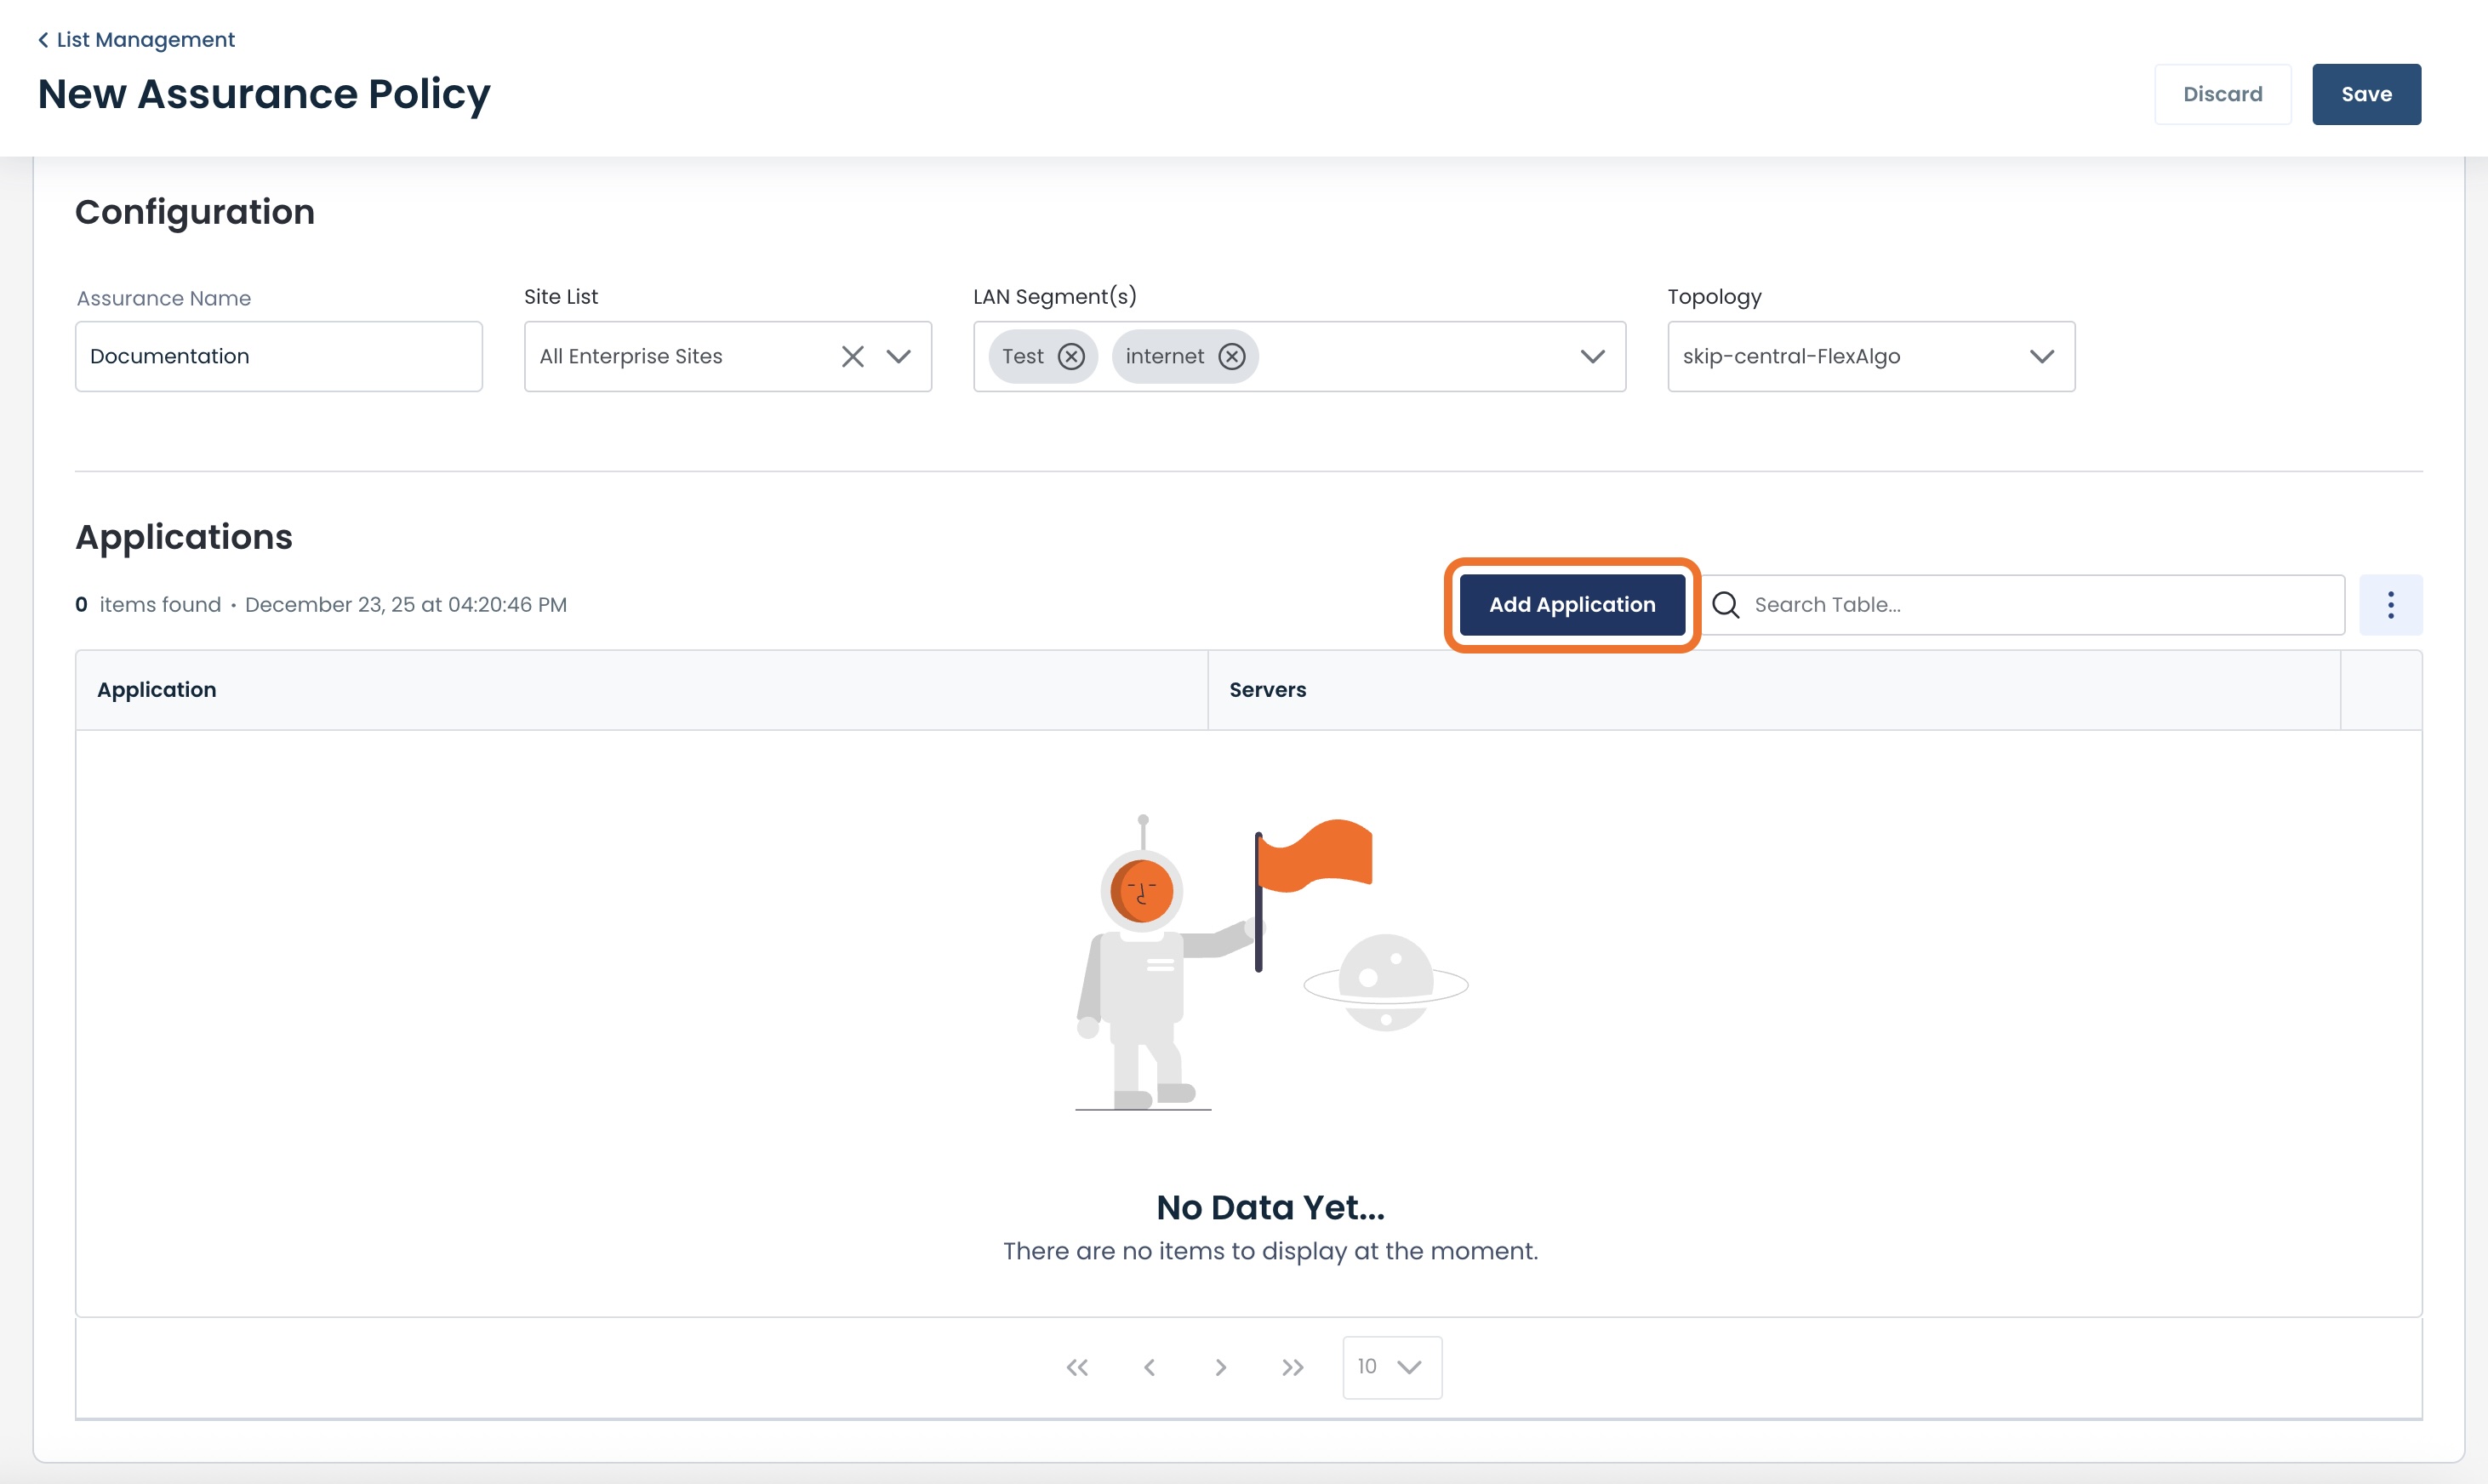
A modal will open to add an application.
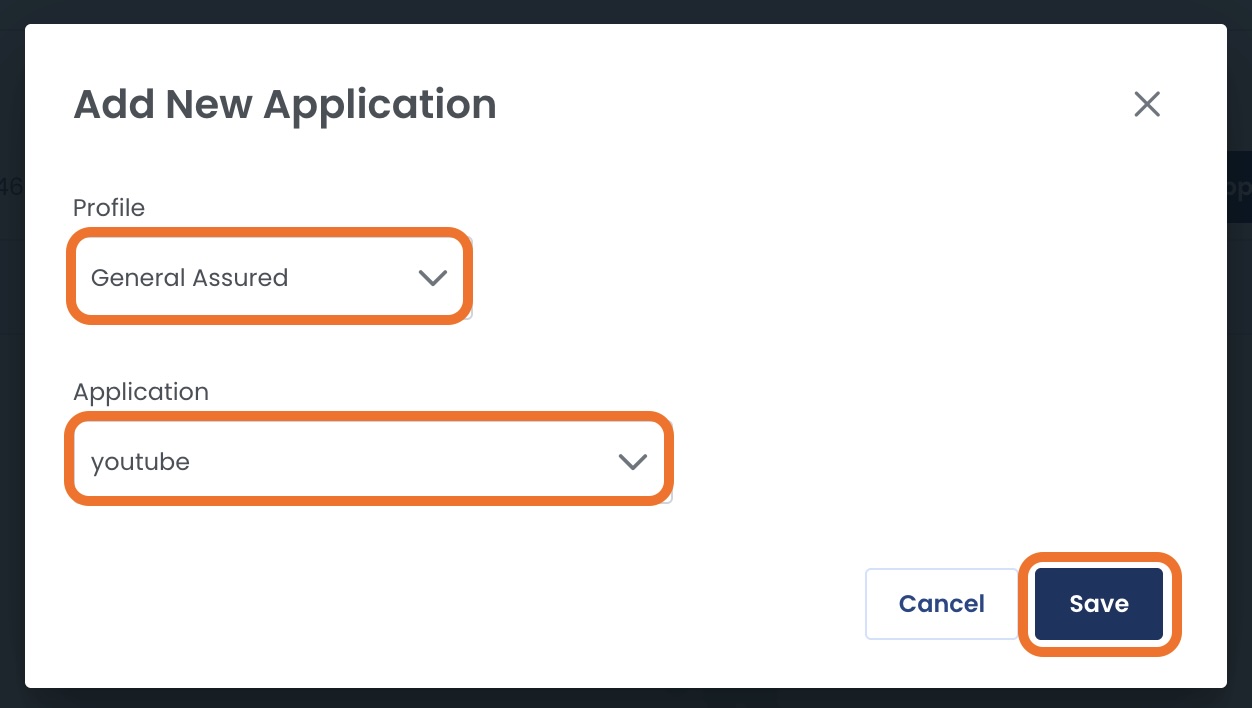
Fill out the following fields:
Profile: From the drop-down, select the Data Assurance bucket that houses this application
Application: From the drop-down, select the application you wish to include in the list
Click ‘Save’.
You will see the new application in the Applications list at the bottom of the page.
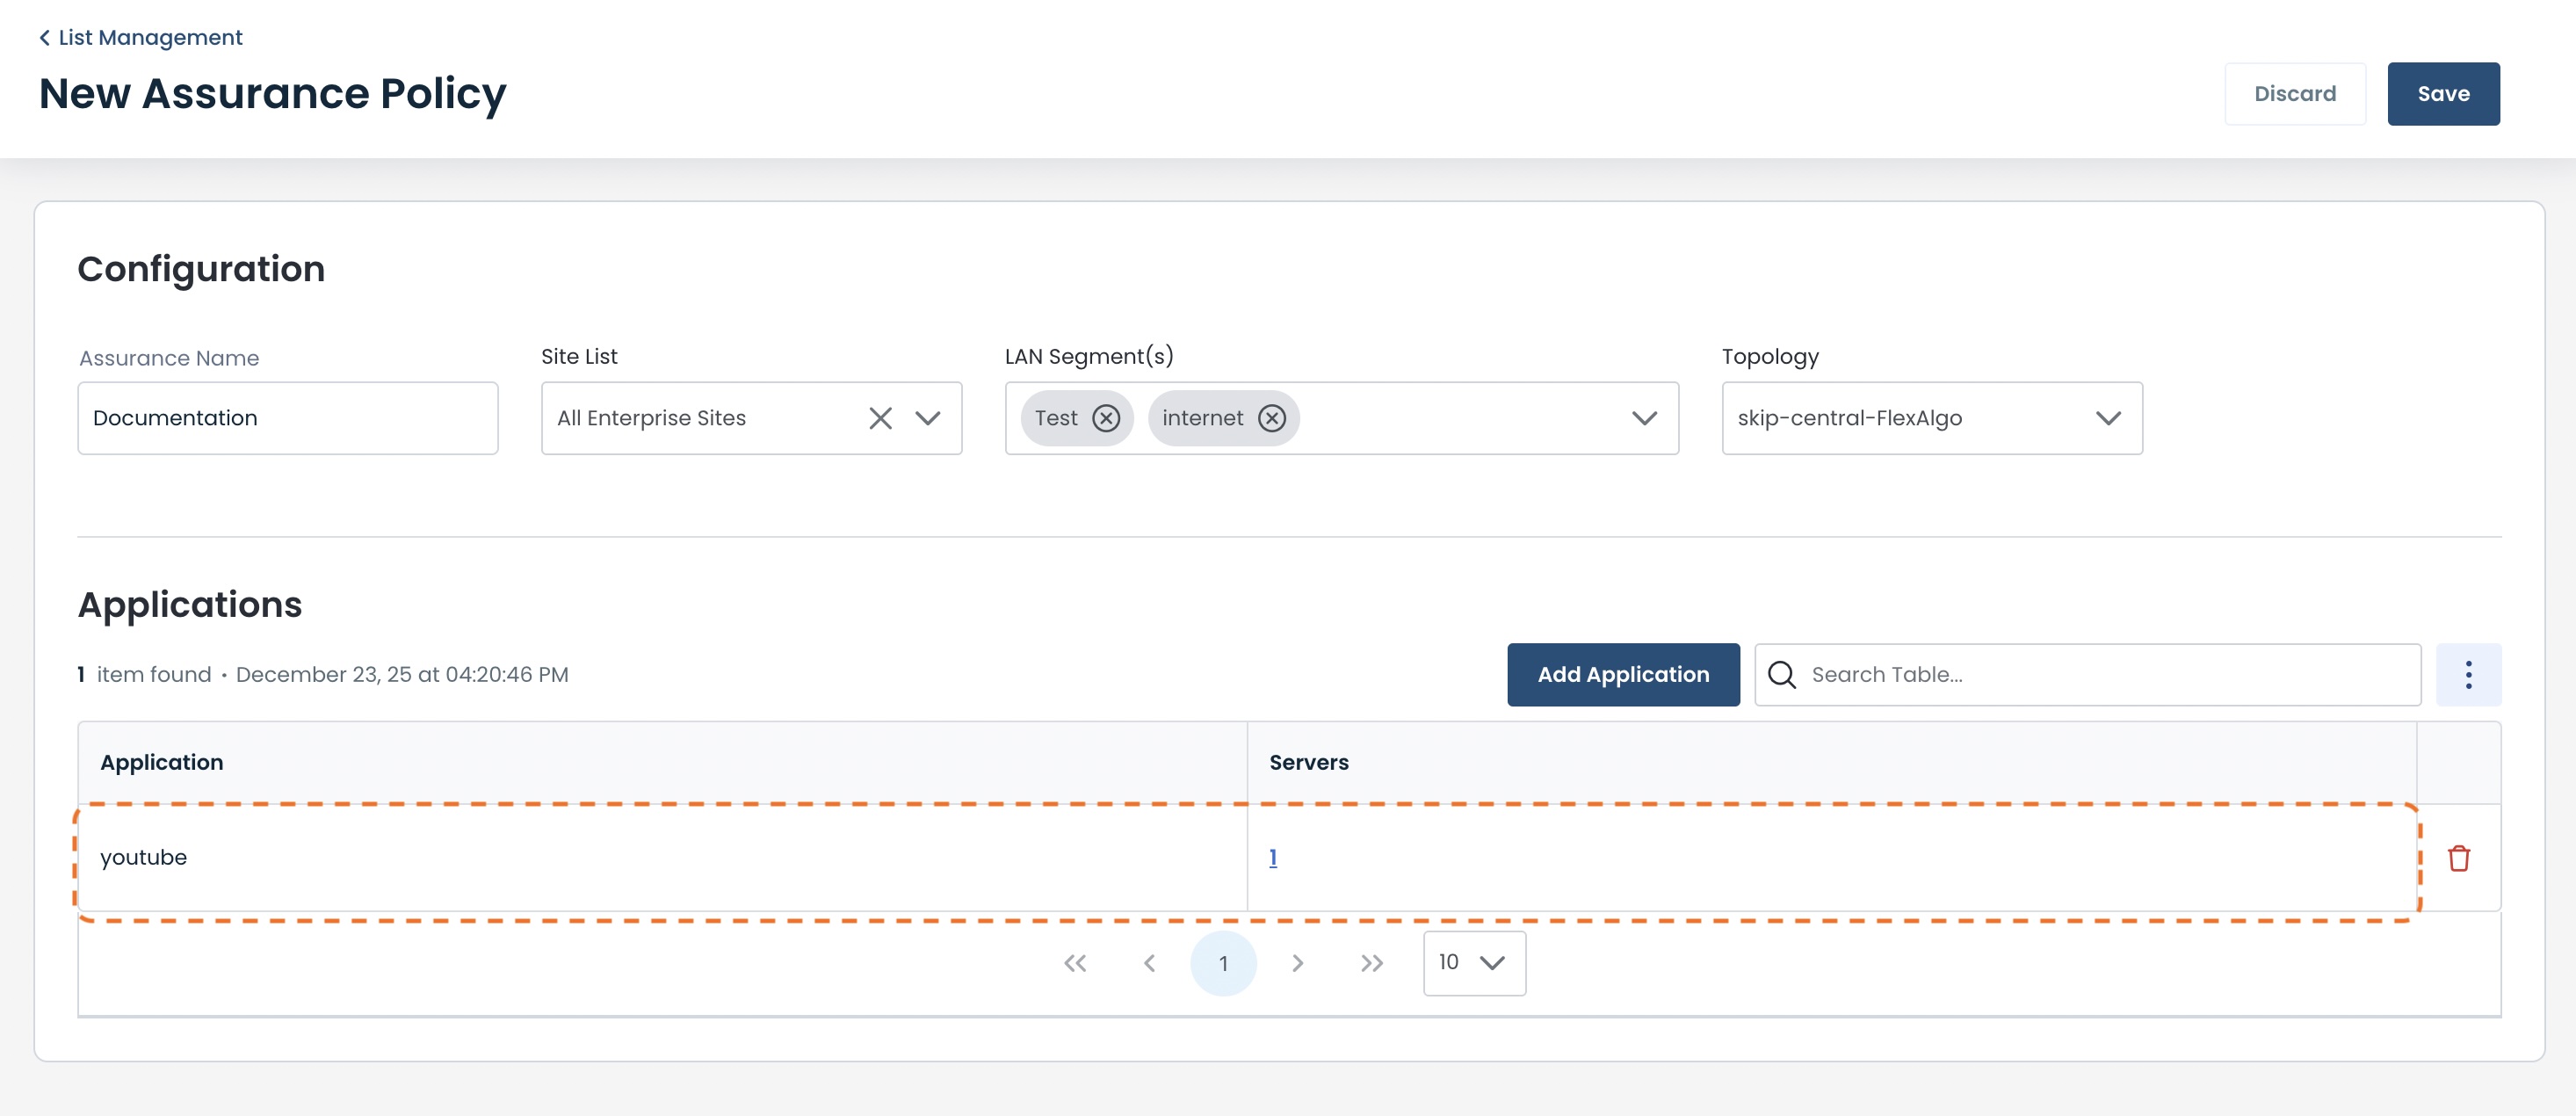
To add additional applications, simply click ‘Add Application’ for each one and repeat the process.
When you have added all applications that are to be included in the list, click ‘Save’ at the top right.
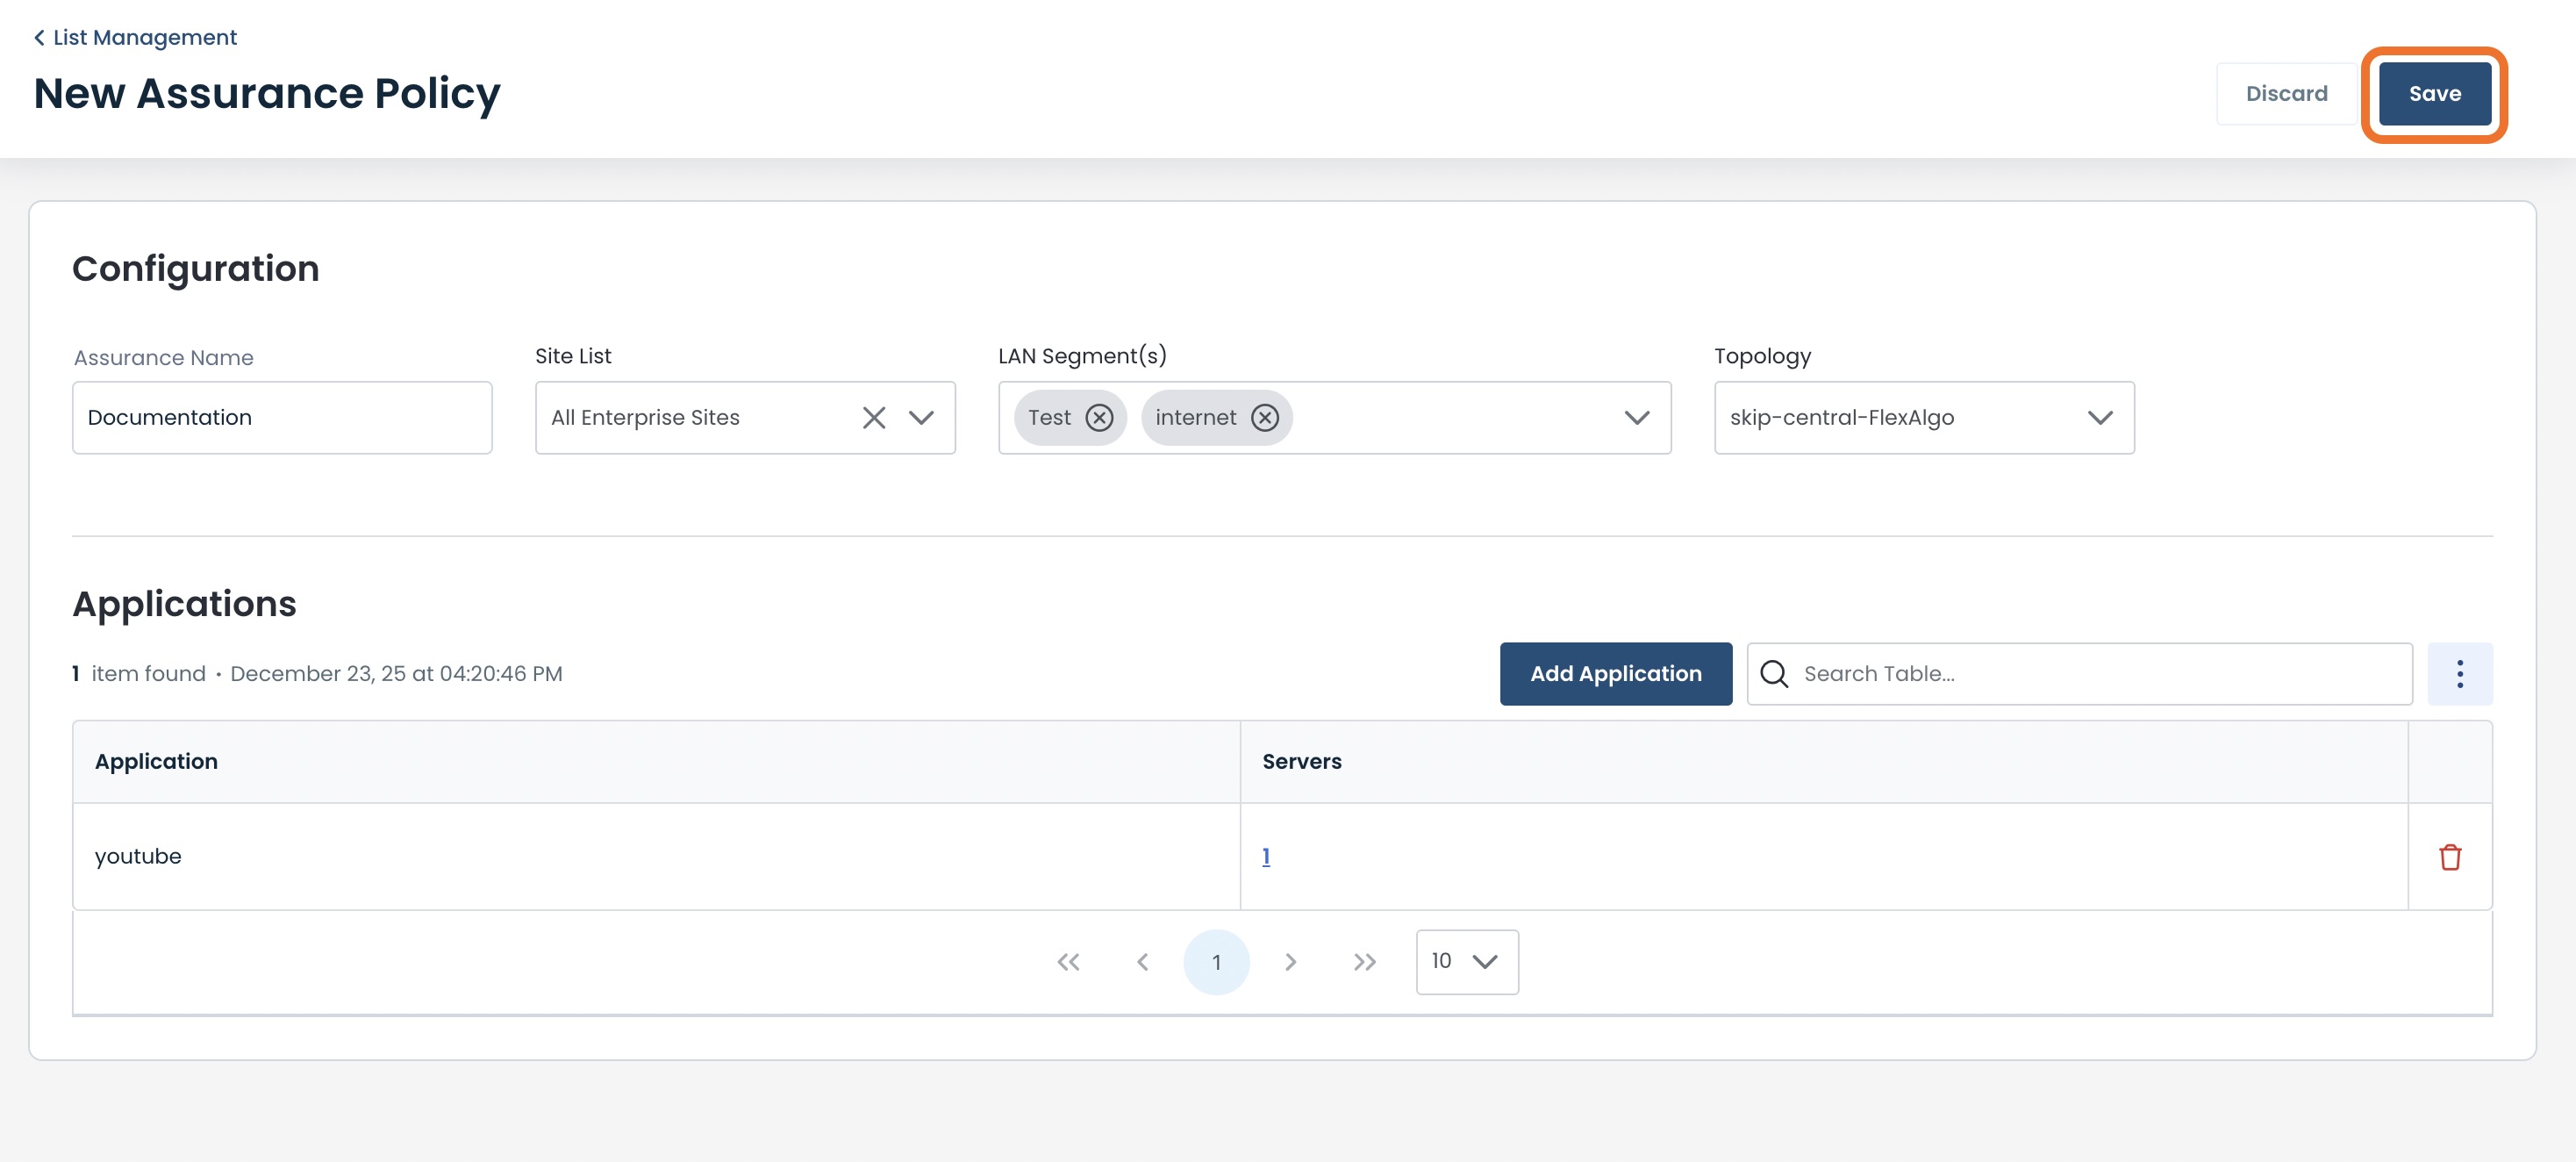
You will now see the new Assurance Policy in the Assurances List table.
Creating a New Protection Policy
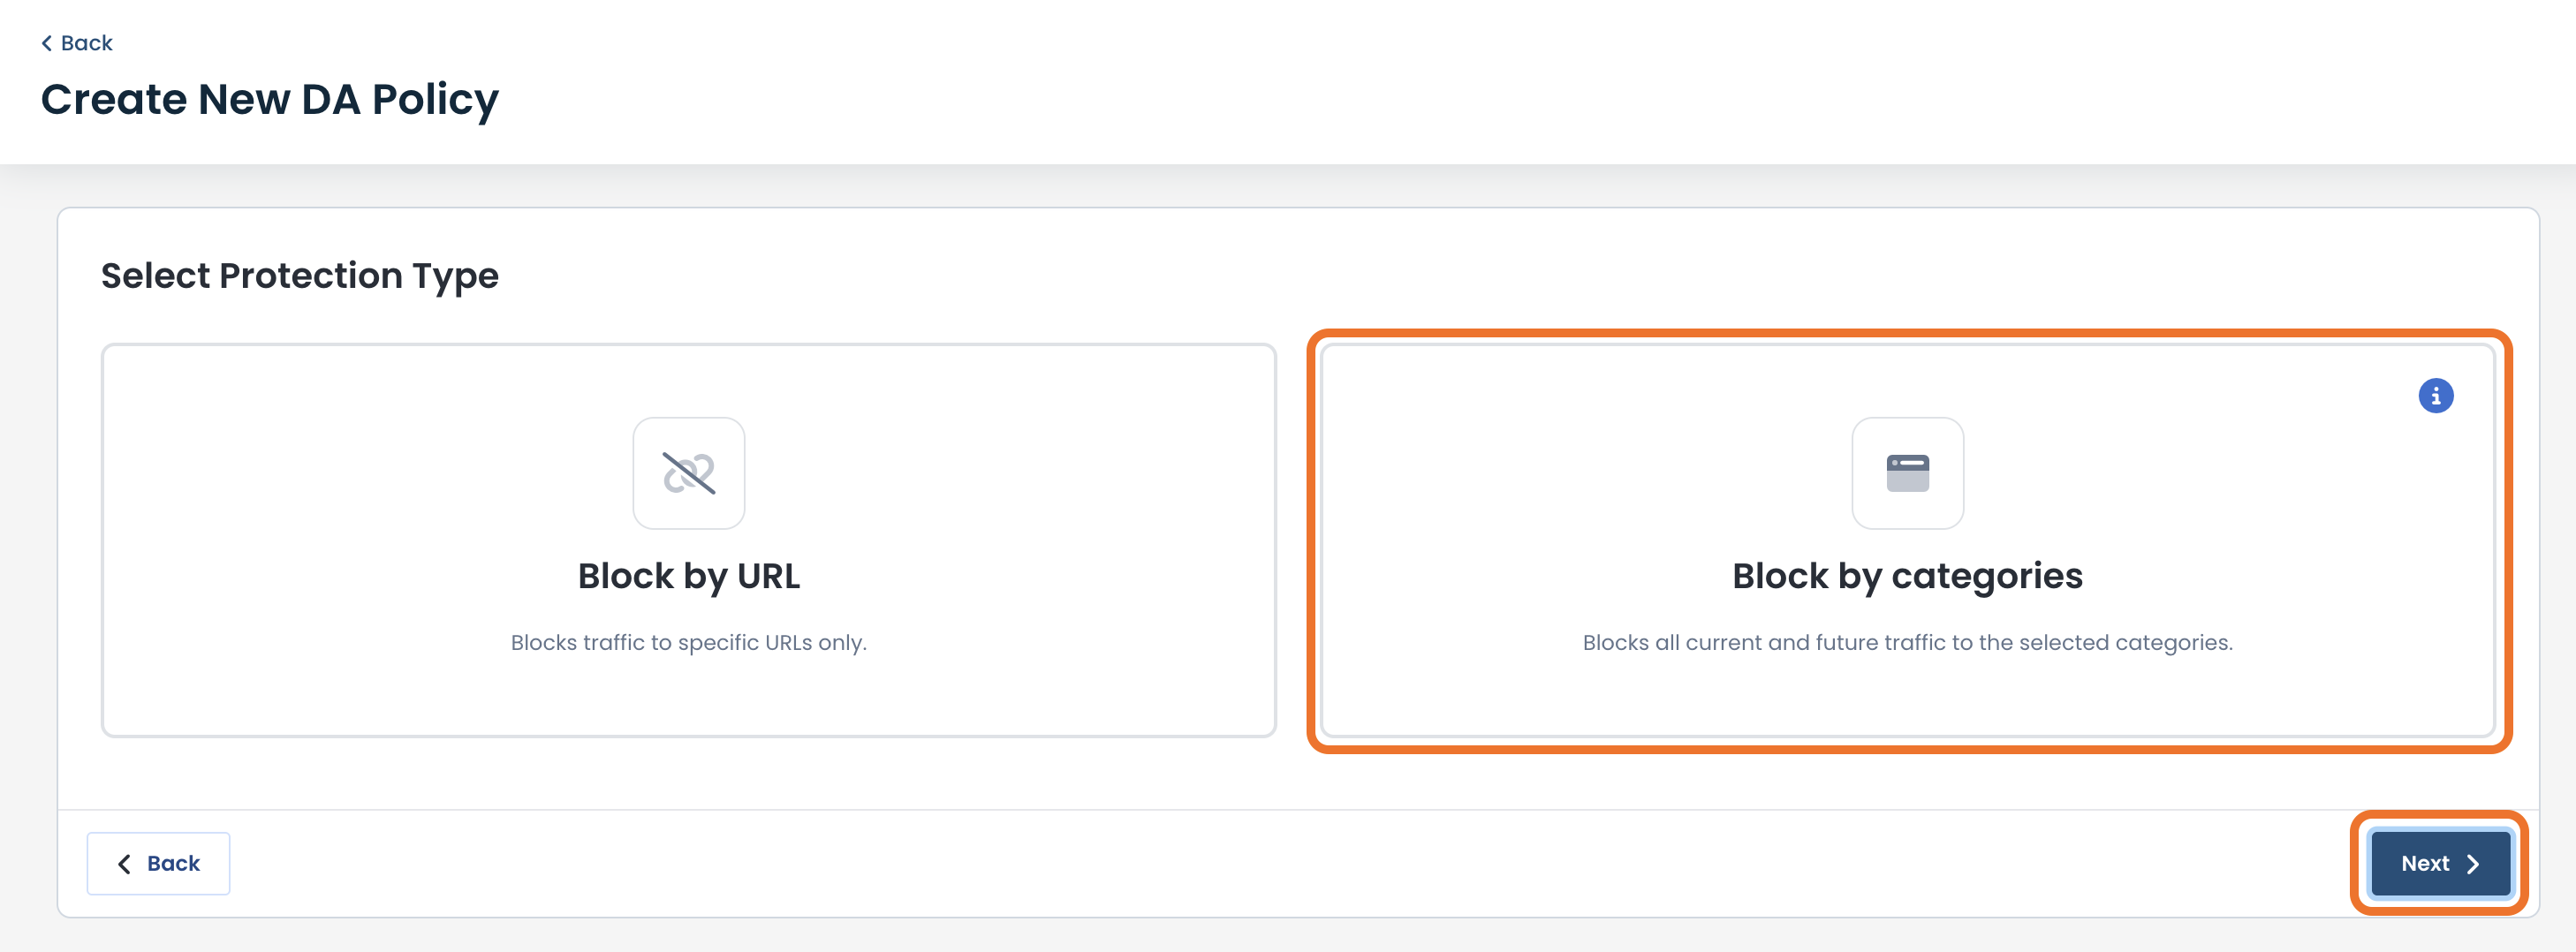
To add applications to a Protection Policy that will block them from entering your network, click ‘Protection’.
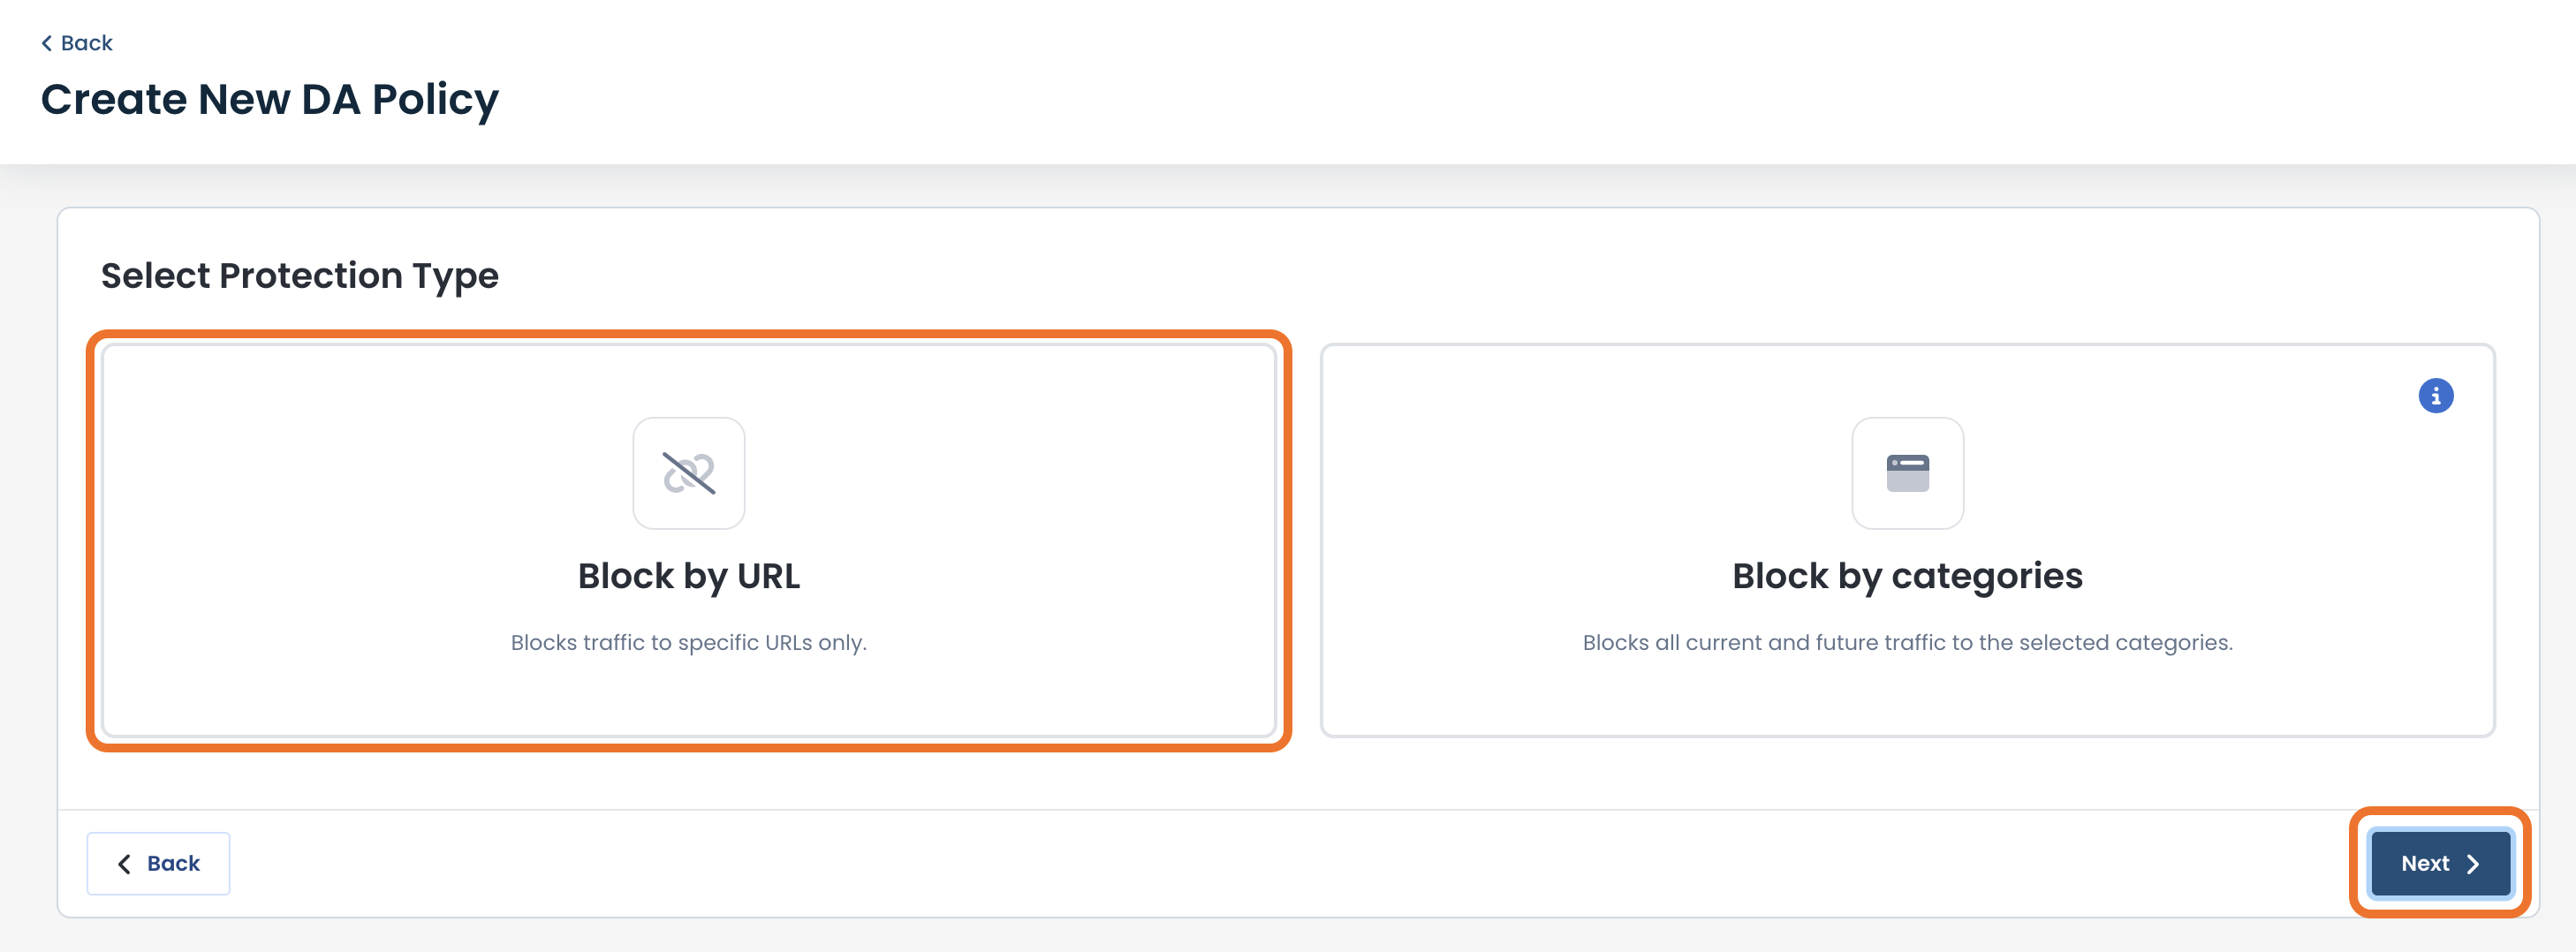
Click ‘Next’.
You can either block by a specific URL, or by entire domain categories.
Blocking Traffic to Specific URLs
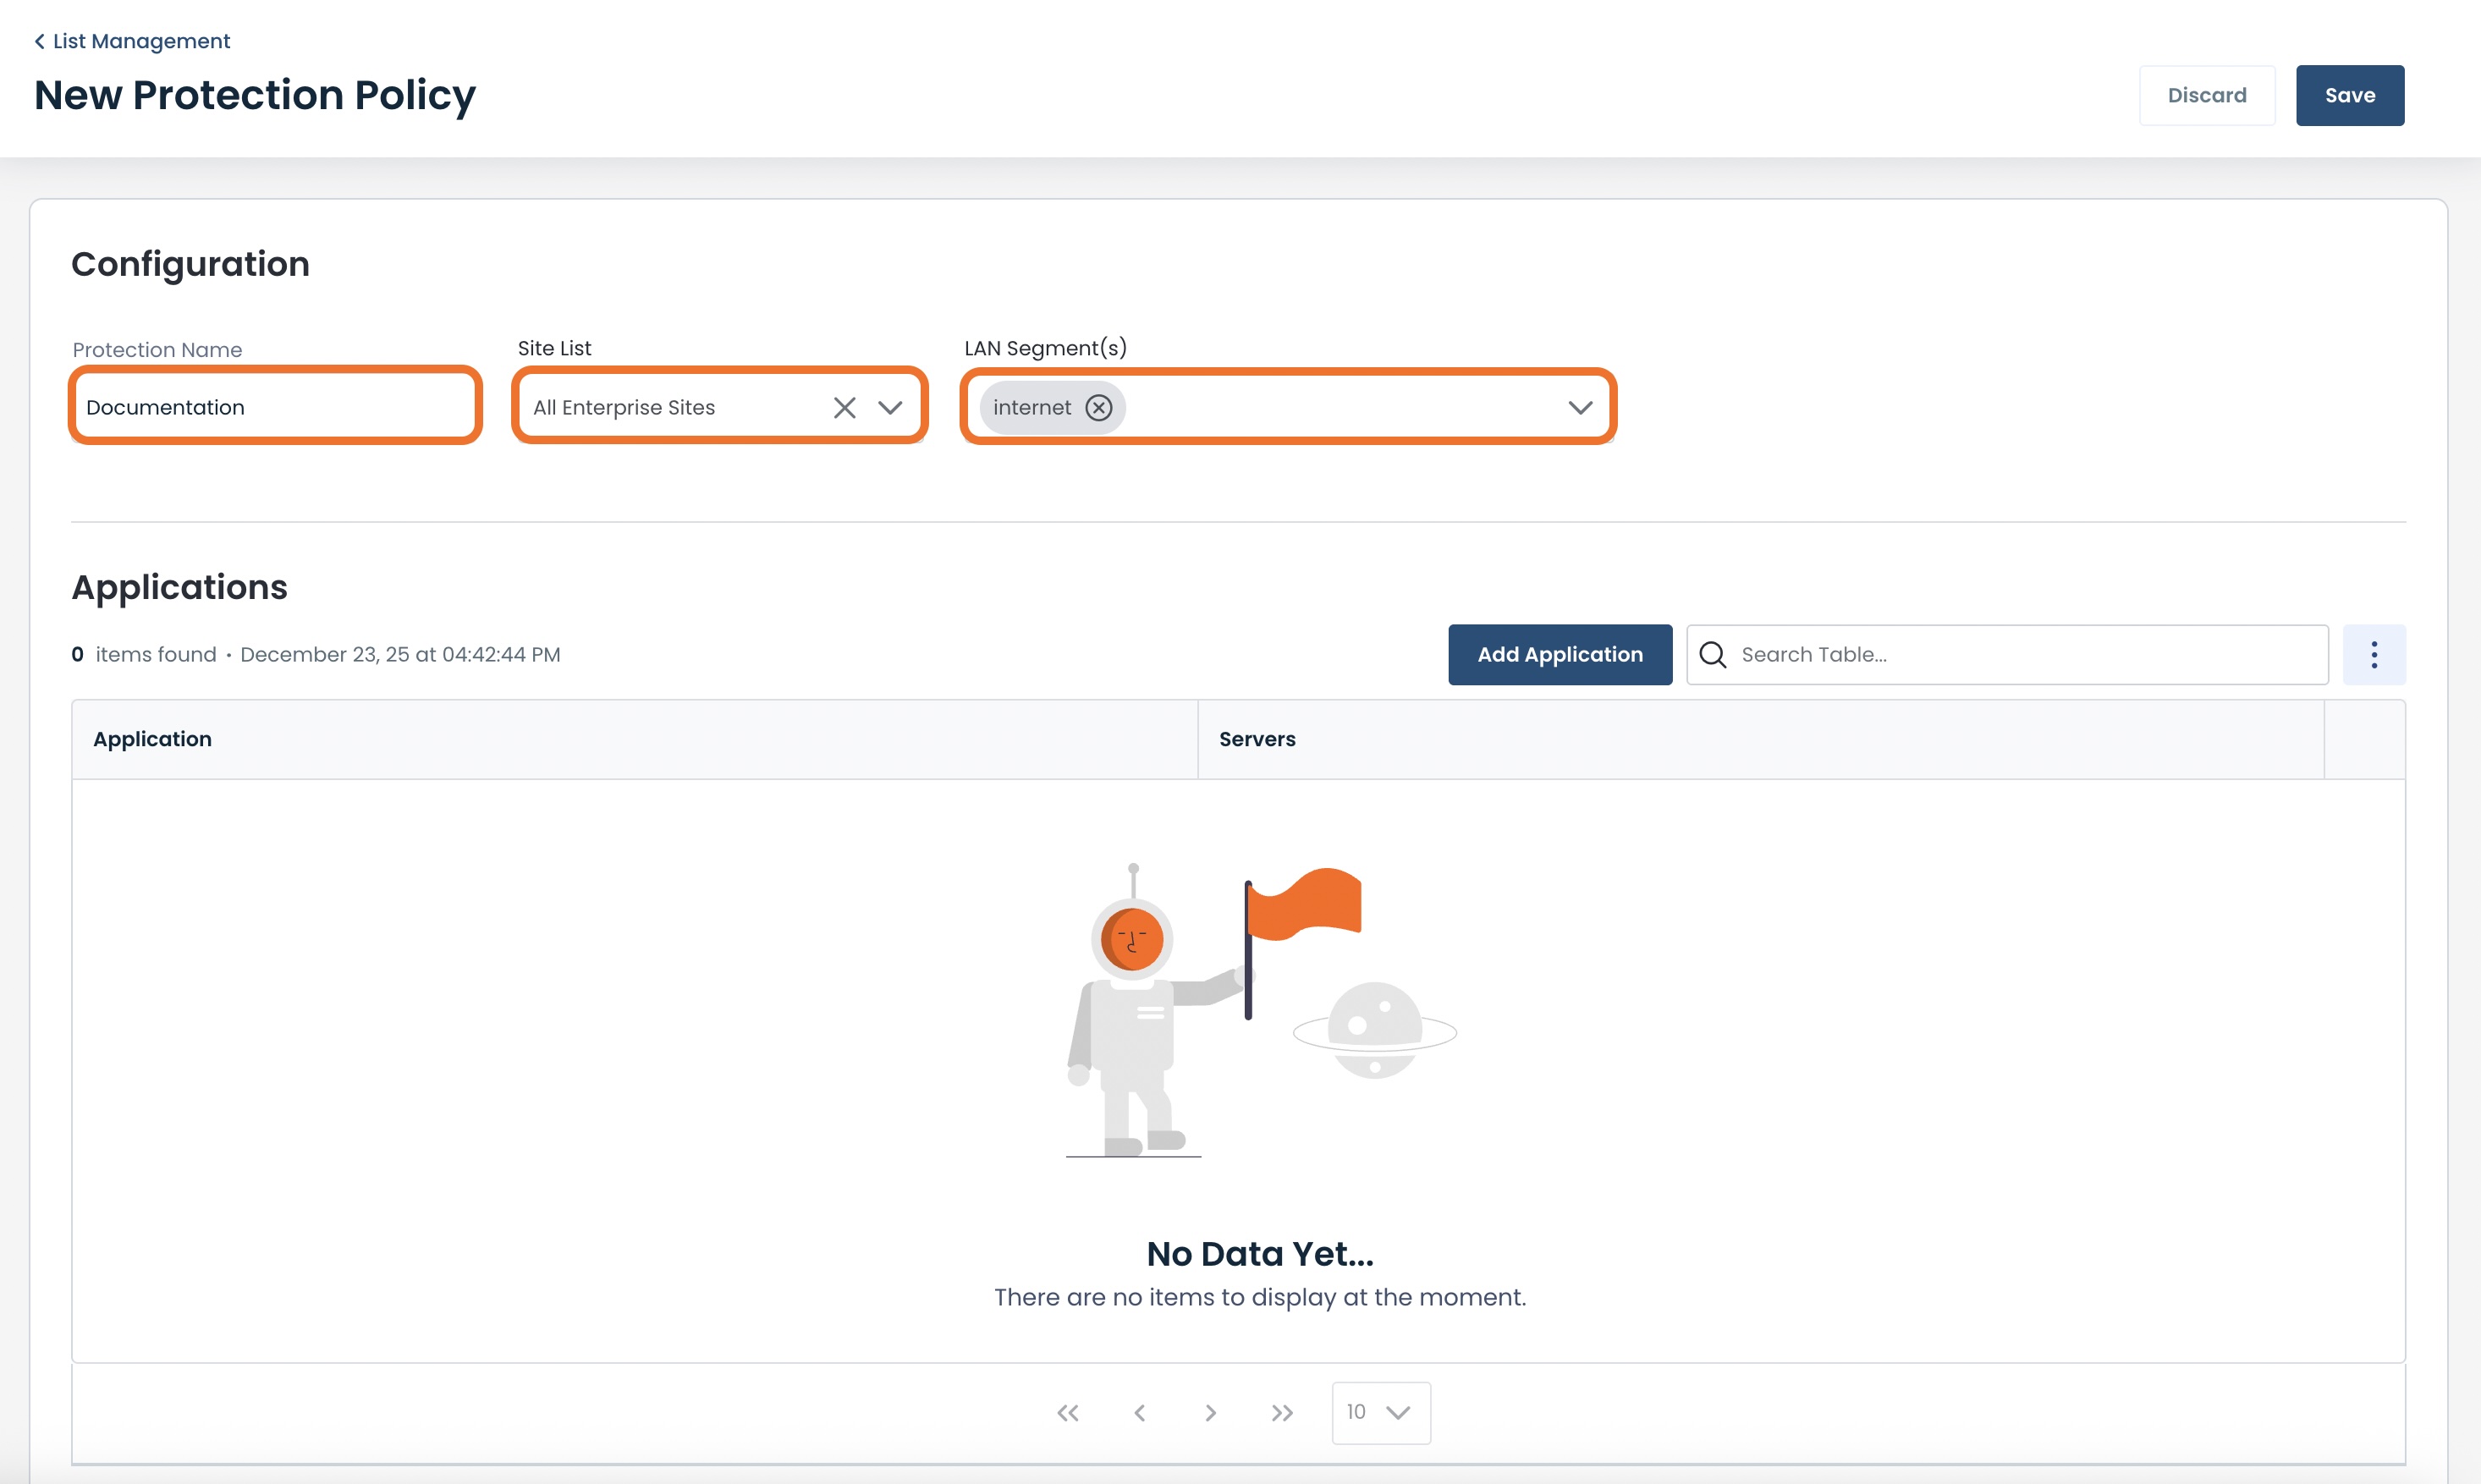
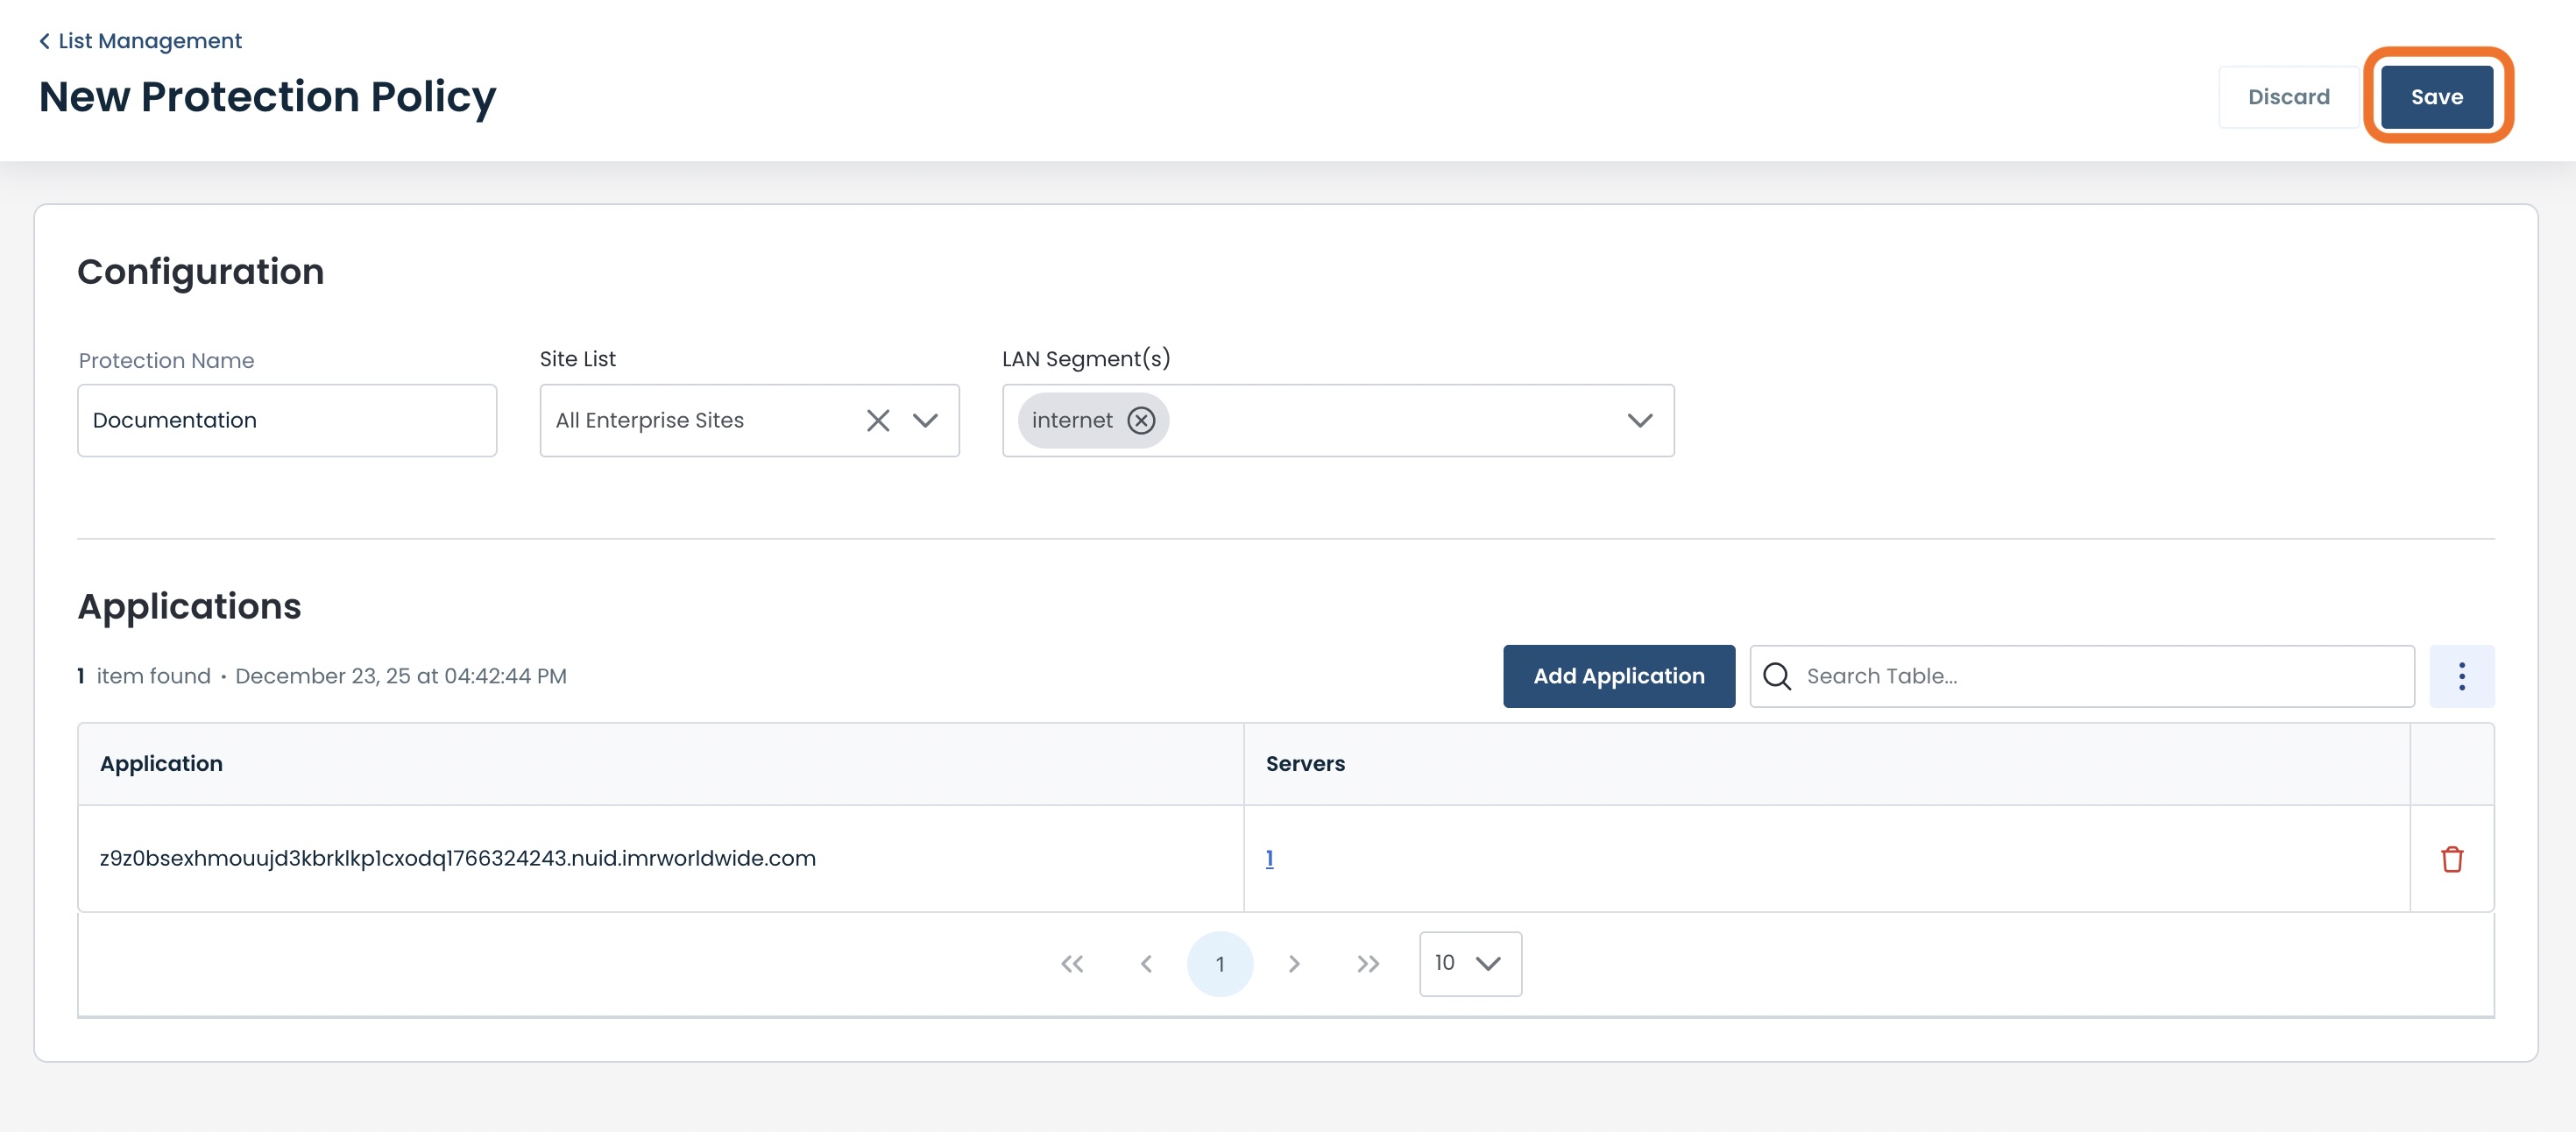
The URL Protection Policy configuration list will open.
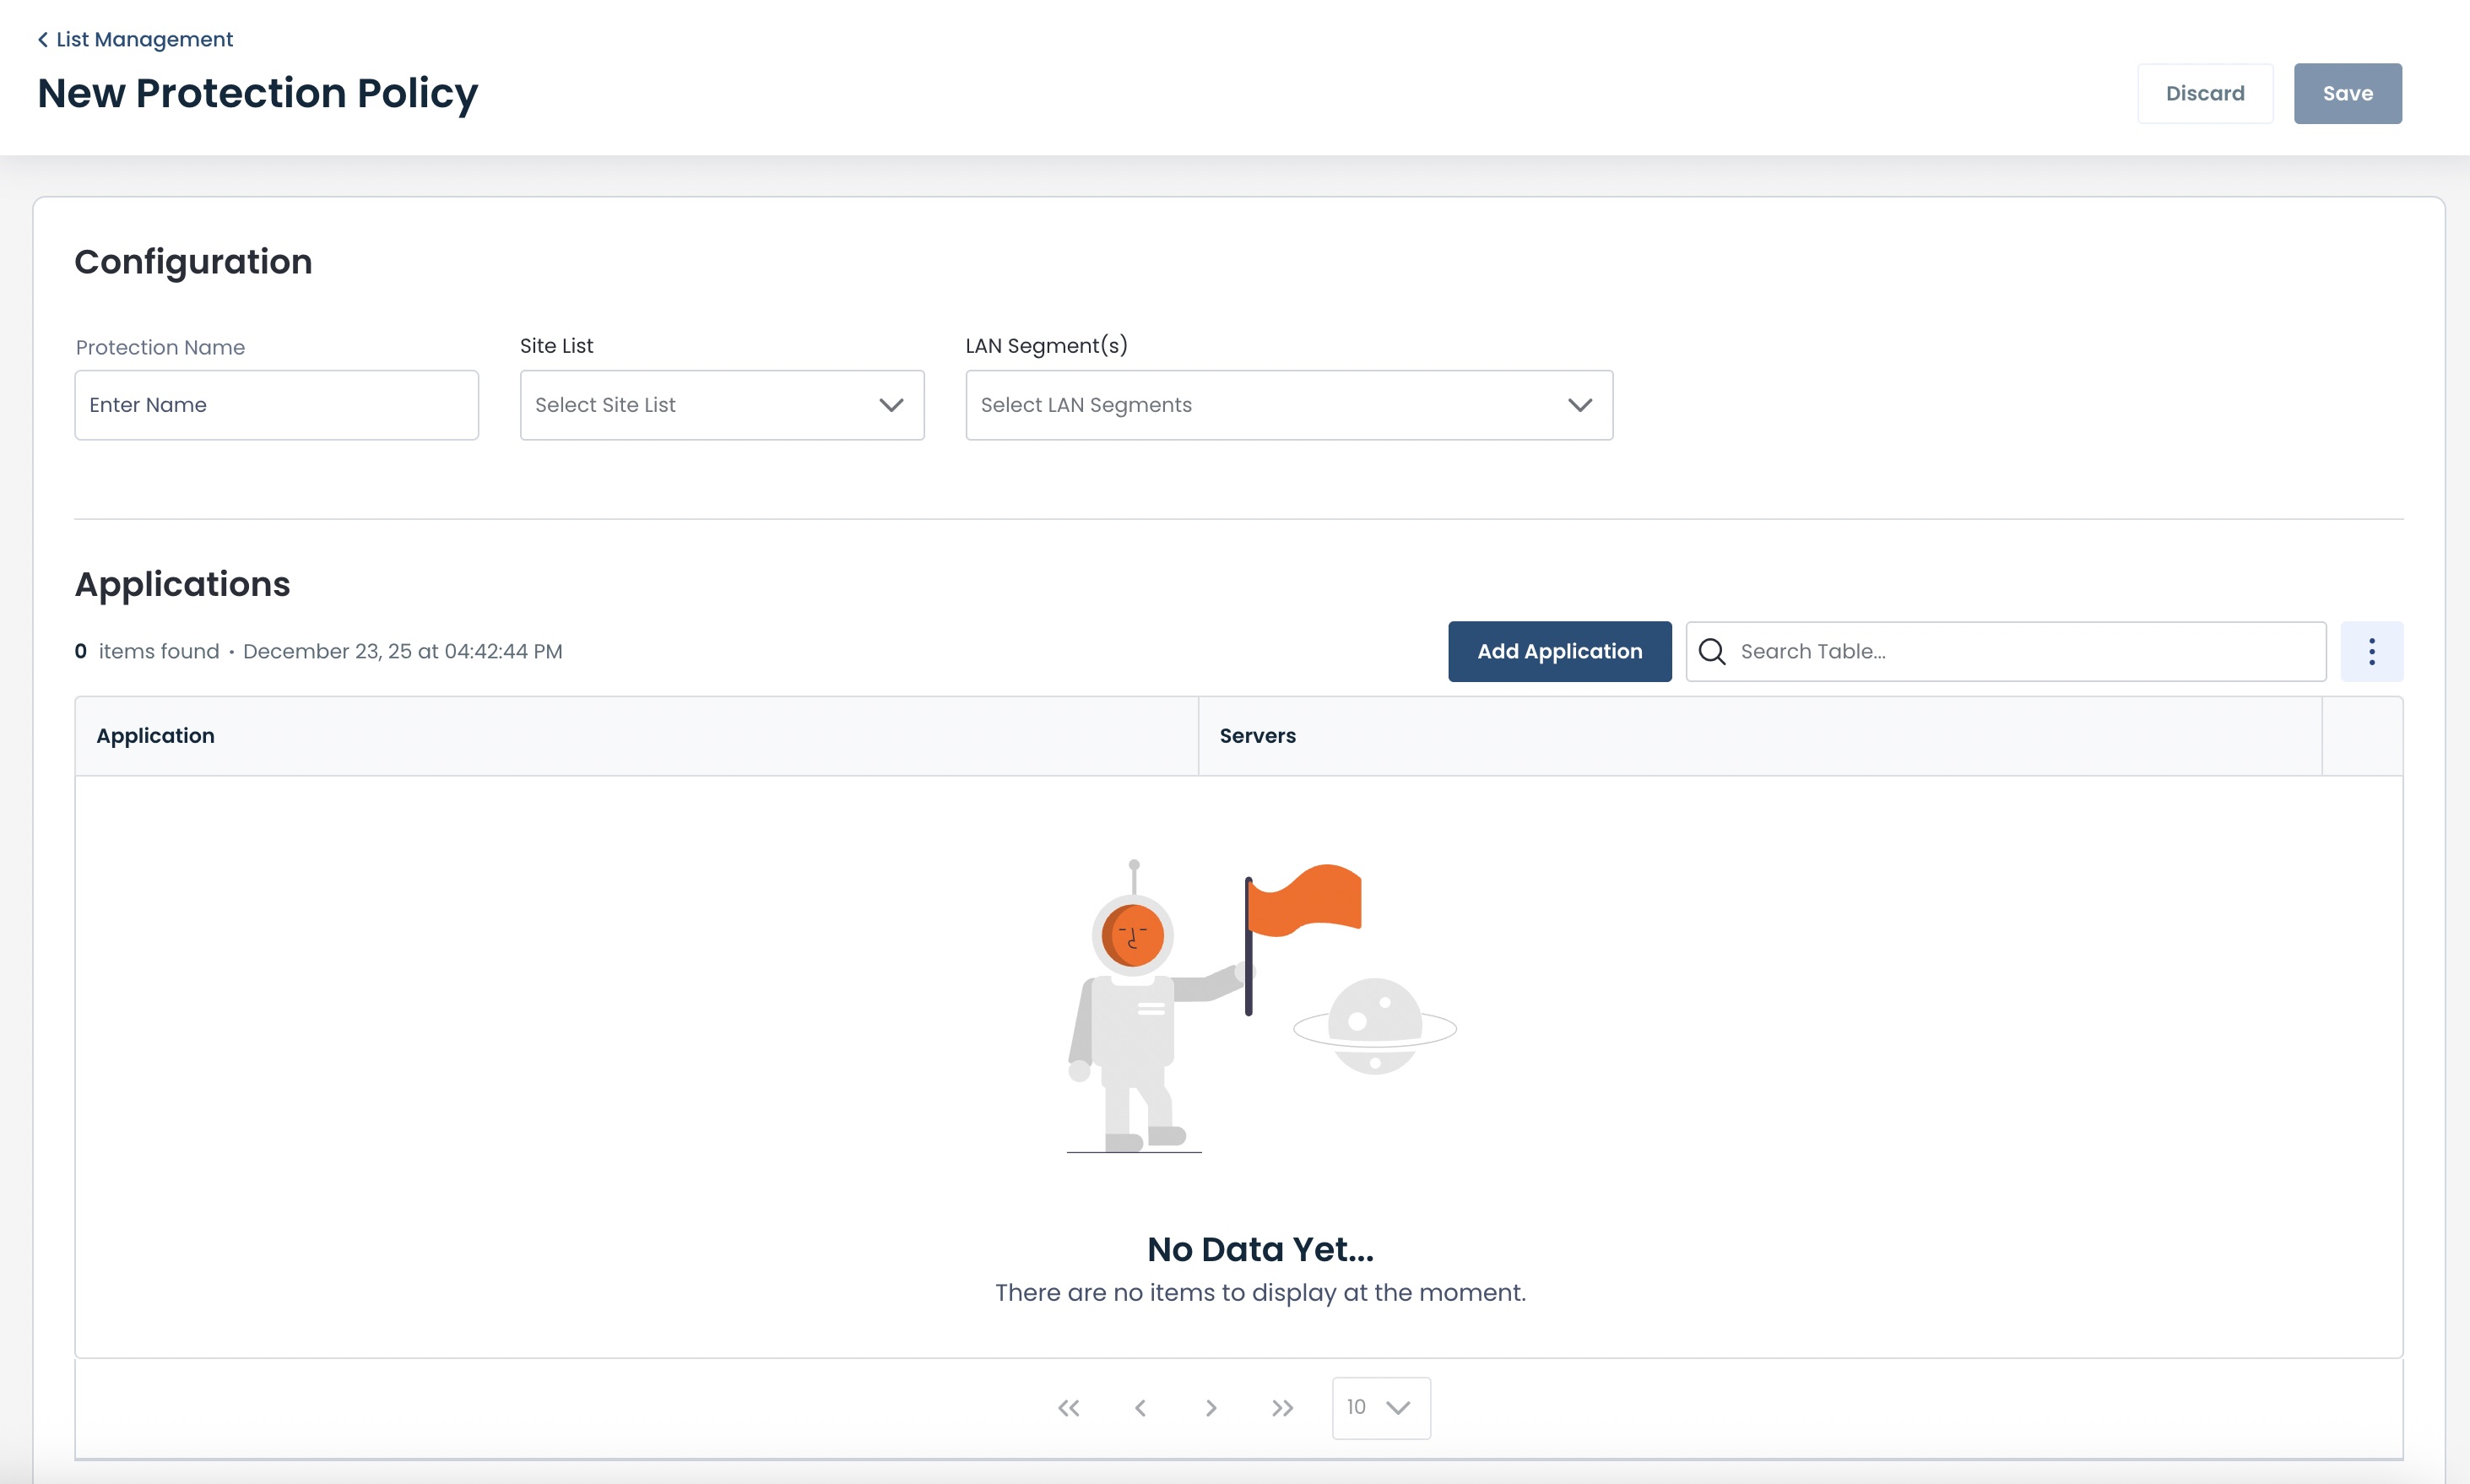
Complete the following fields:
Protection Name: Type in the name of the new policy that you are creating
Site List: From the drop-down, select the Site List that will be using this policy
For more information on Site Lists, click here.
LAN Segment(s): From the drop-down, select the LAN Segment(s) that will be using this policy
You can stop here and save the policy by clicking ‘Save’ at the top right.
If you have applications to add now, click ‘Add Application’.
To add an application to be blocked with this policy, click ‘Add Application’.
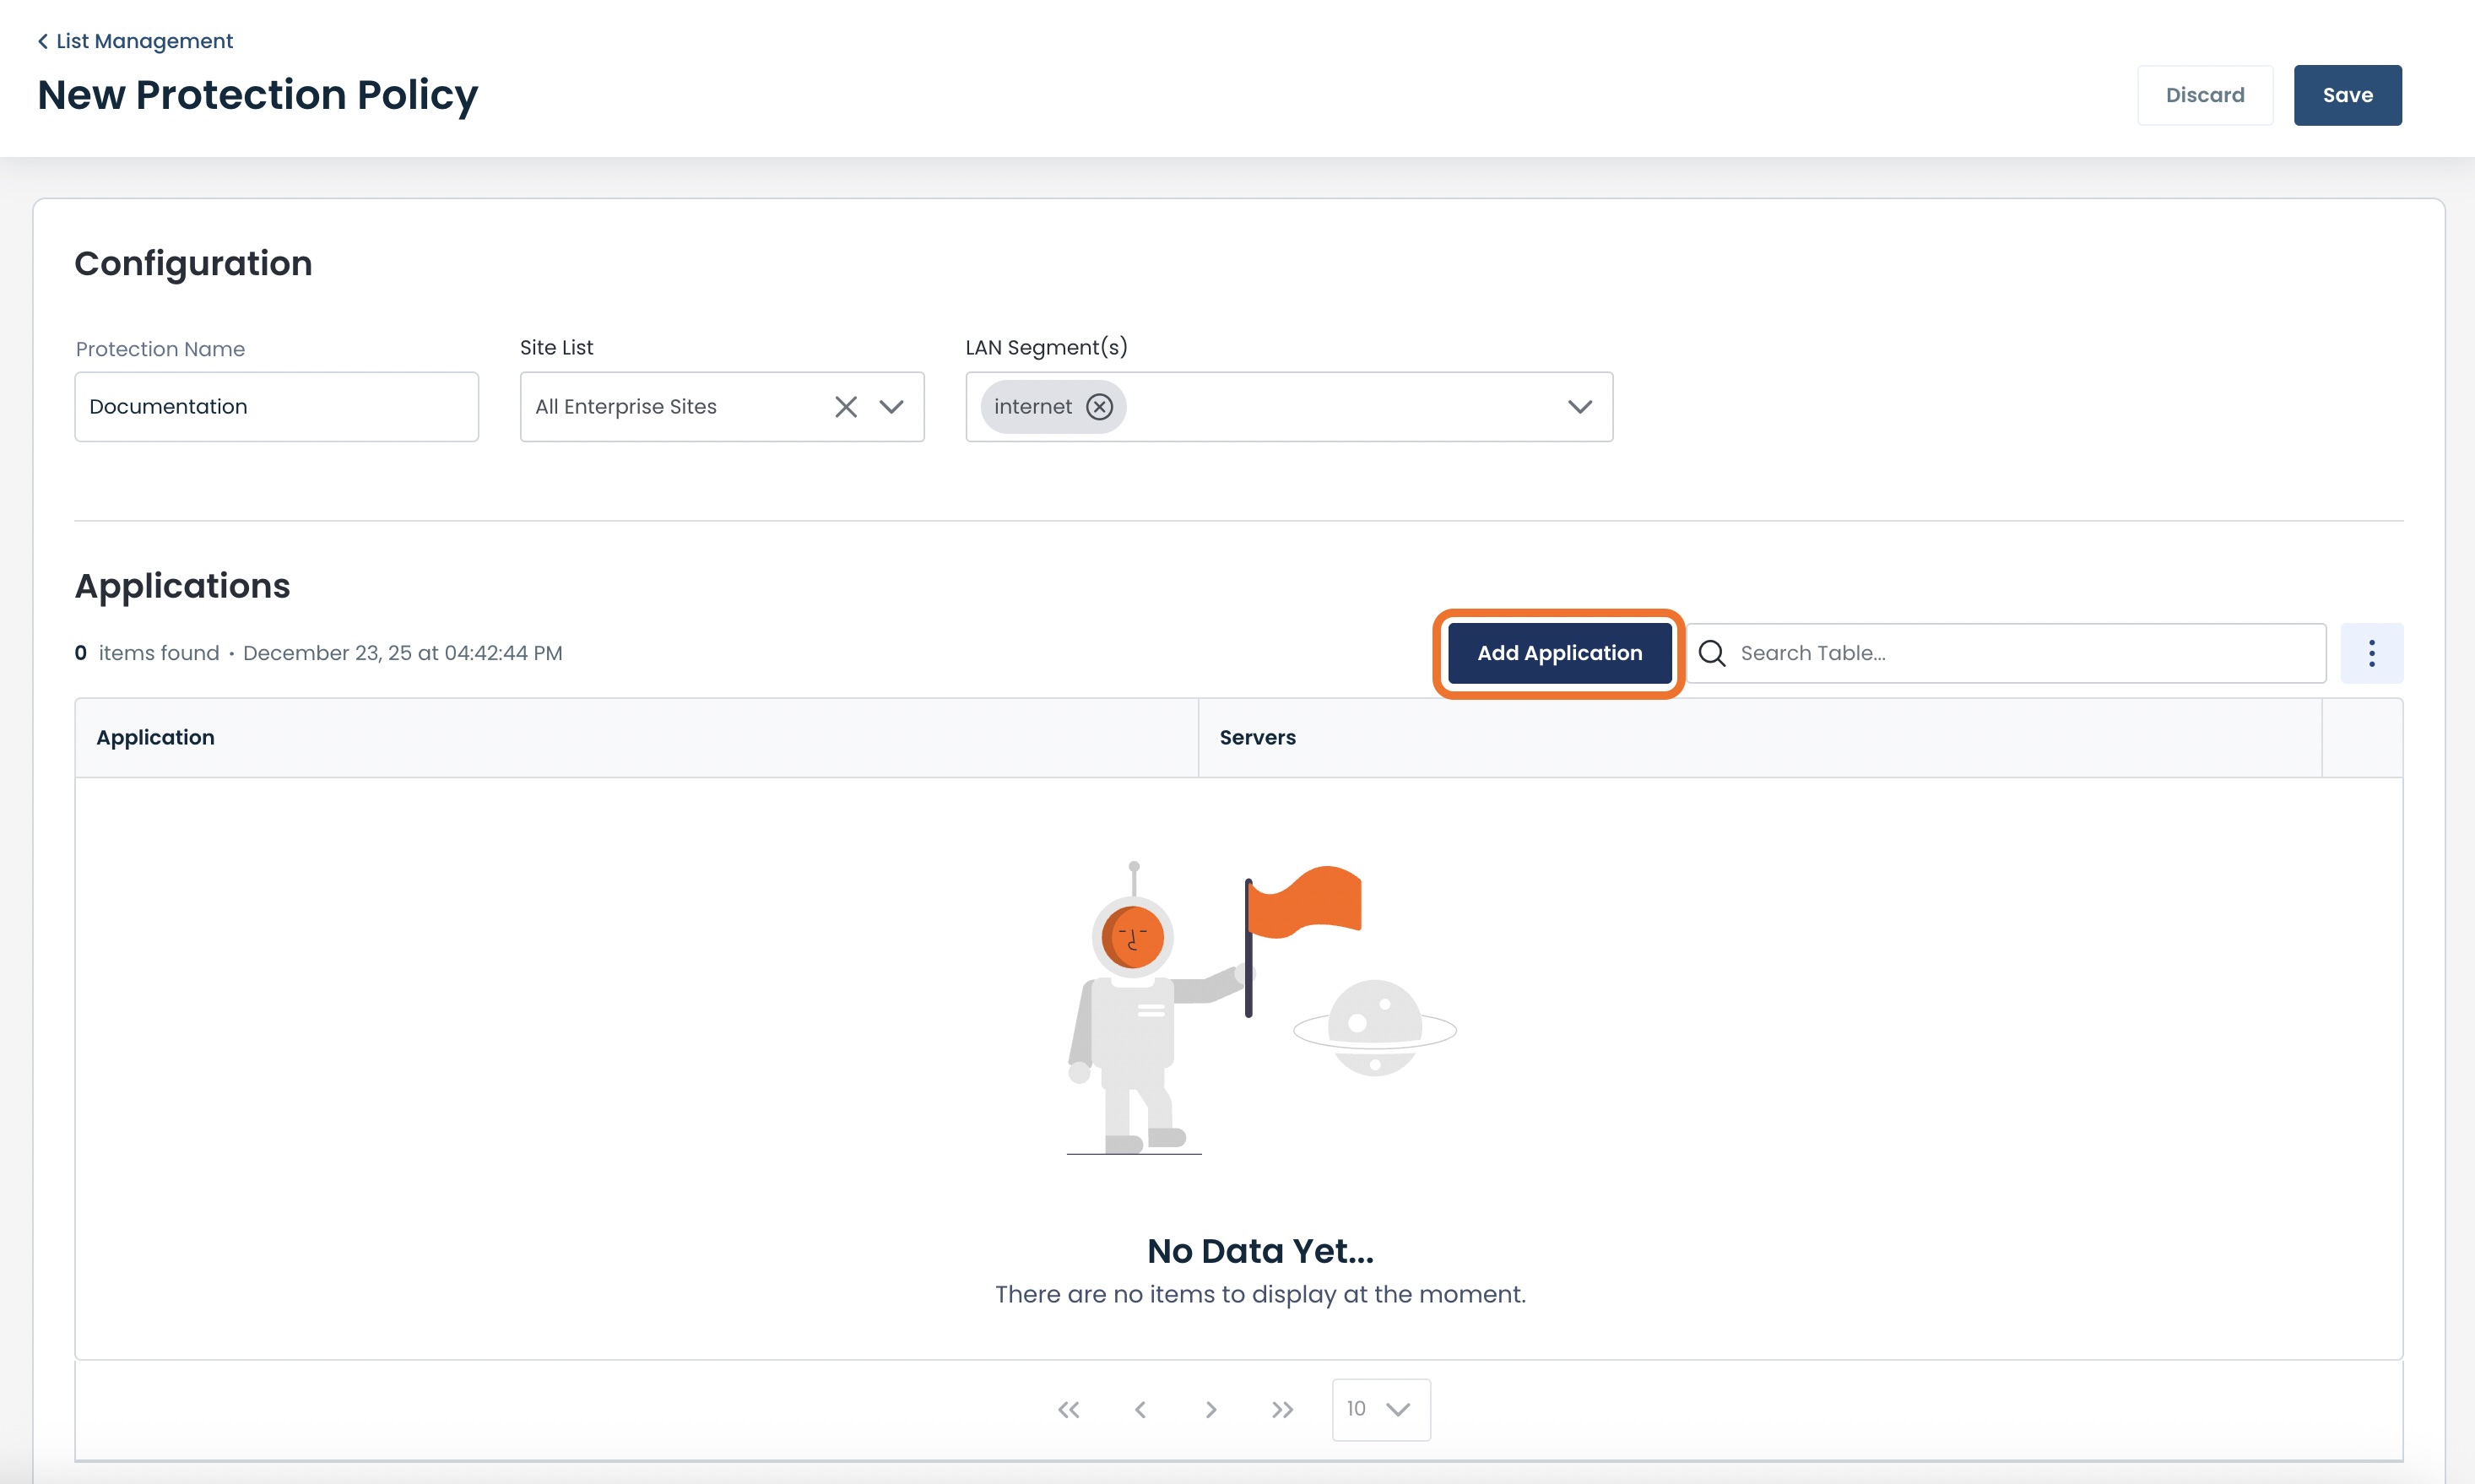
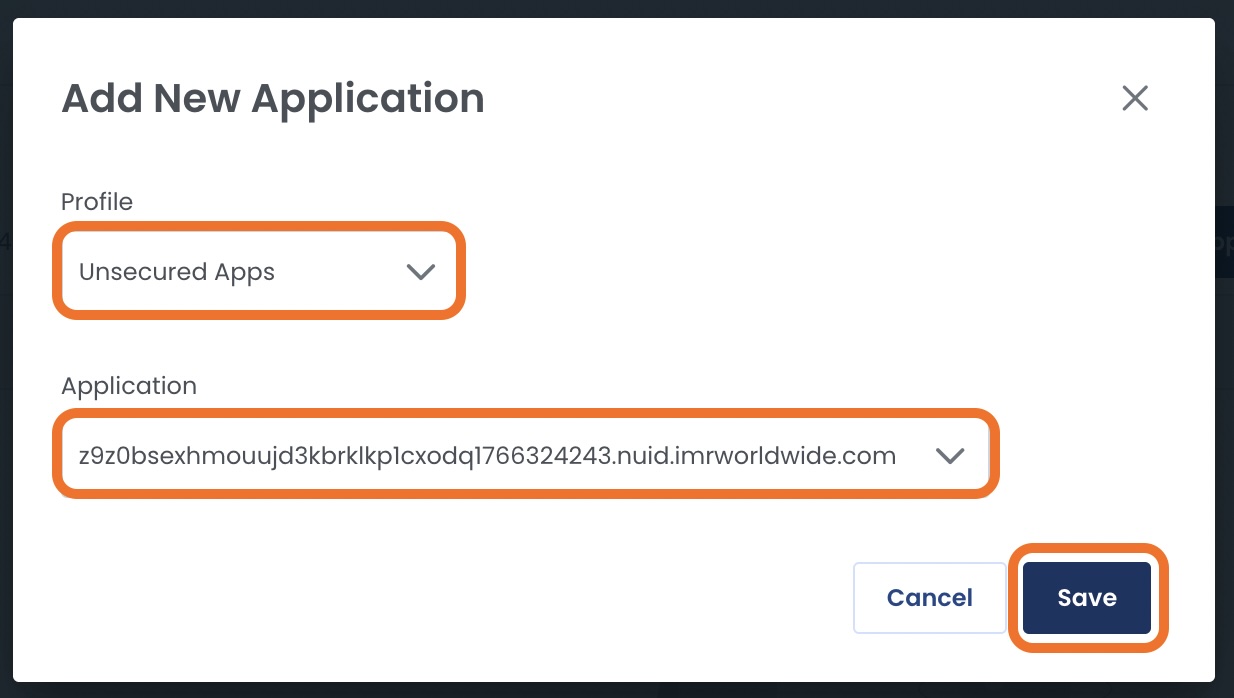
A modal will open to add an application.
Fill out the following fields:
Profile: From the drop-down, select the Data Assurance bucket that houses this application
Application: From the drop-down, select the application you wish to block and include in the list
Click ‘Save’.
You will see the new application to block in the Applications list at the bottom of the page.
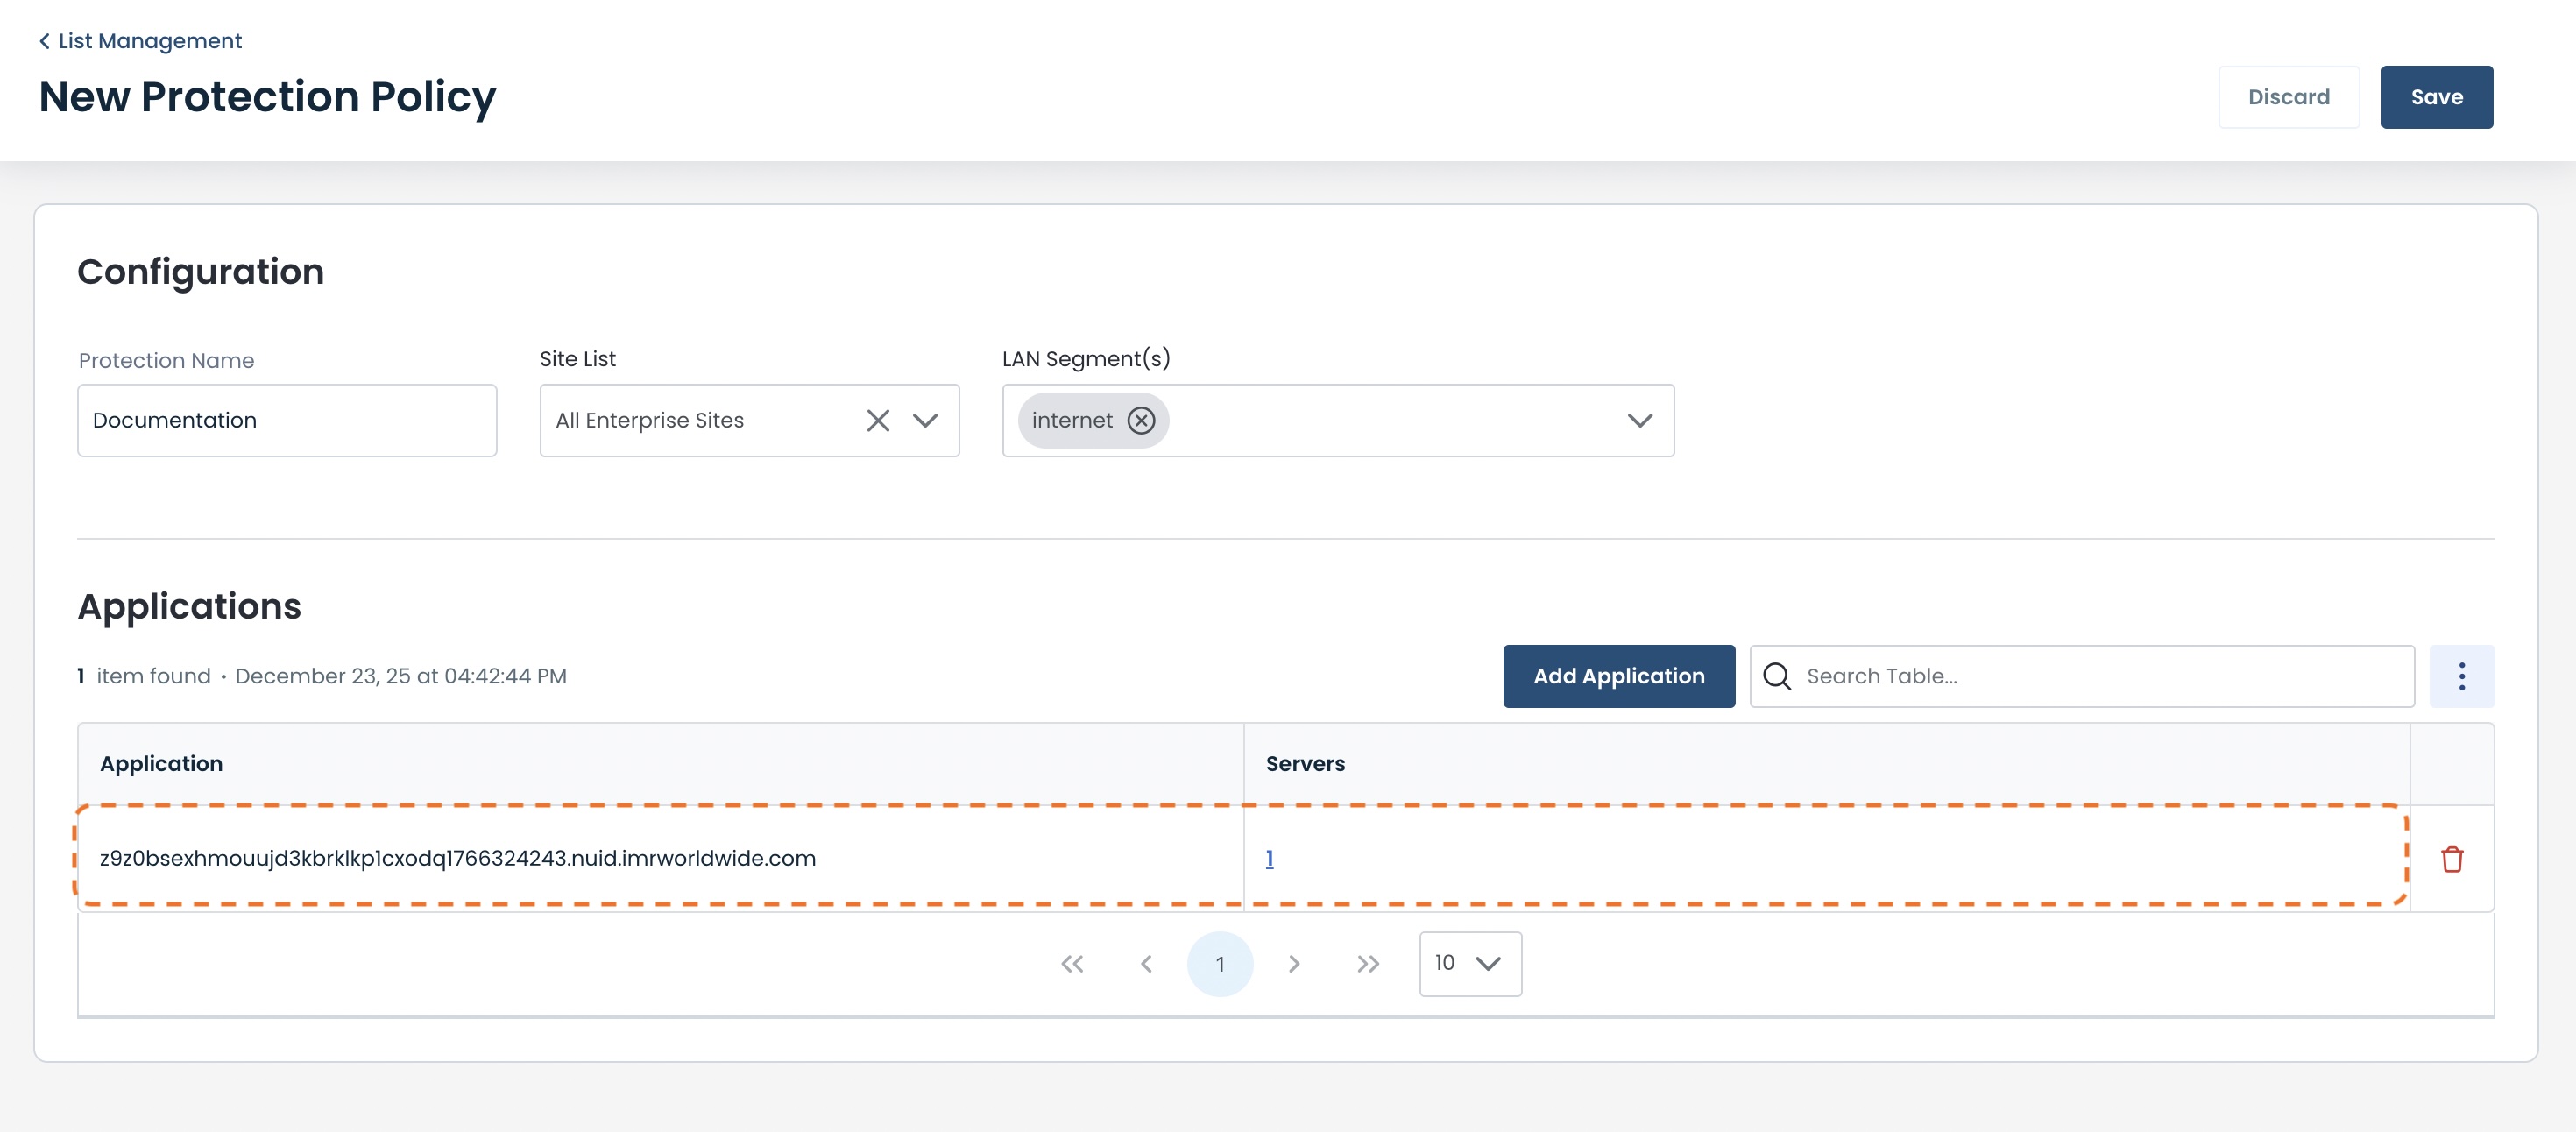
To add additional applications, simply click ‘Add Application’ for each one and repeat the process.
When you have added all applications that are to be included in the list, click ‘Save’ at the top right.
You will now see the new Protection Policy in the Protections List table.
Blocking Domain Categories
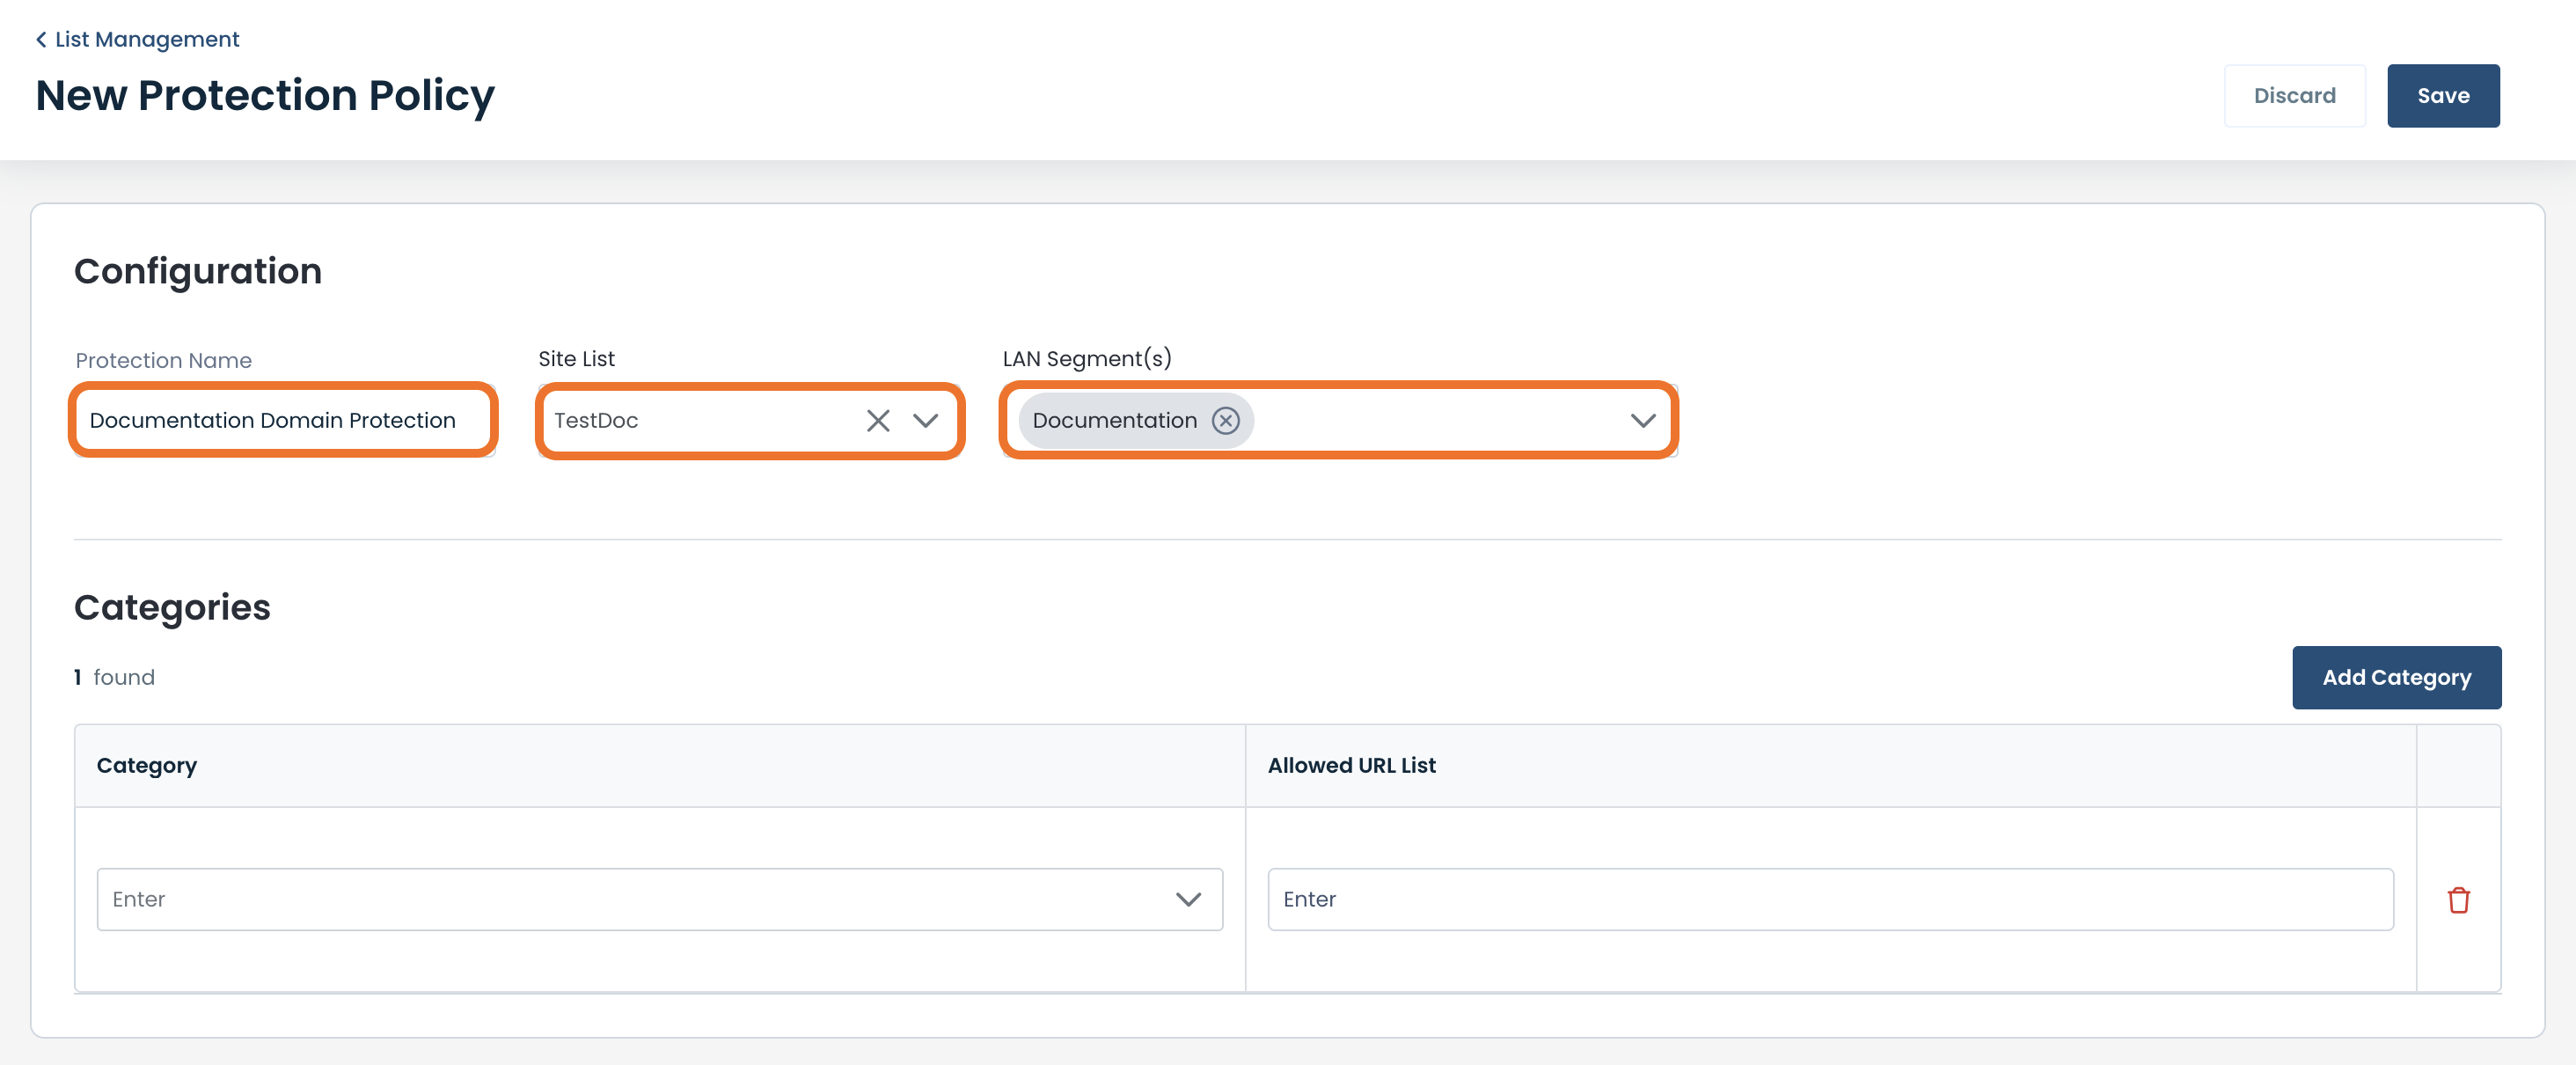
The Domain Category Protection List configuration page will open.
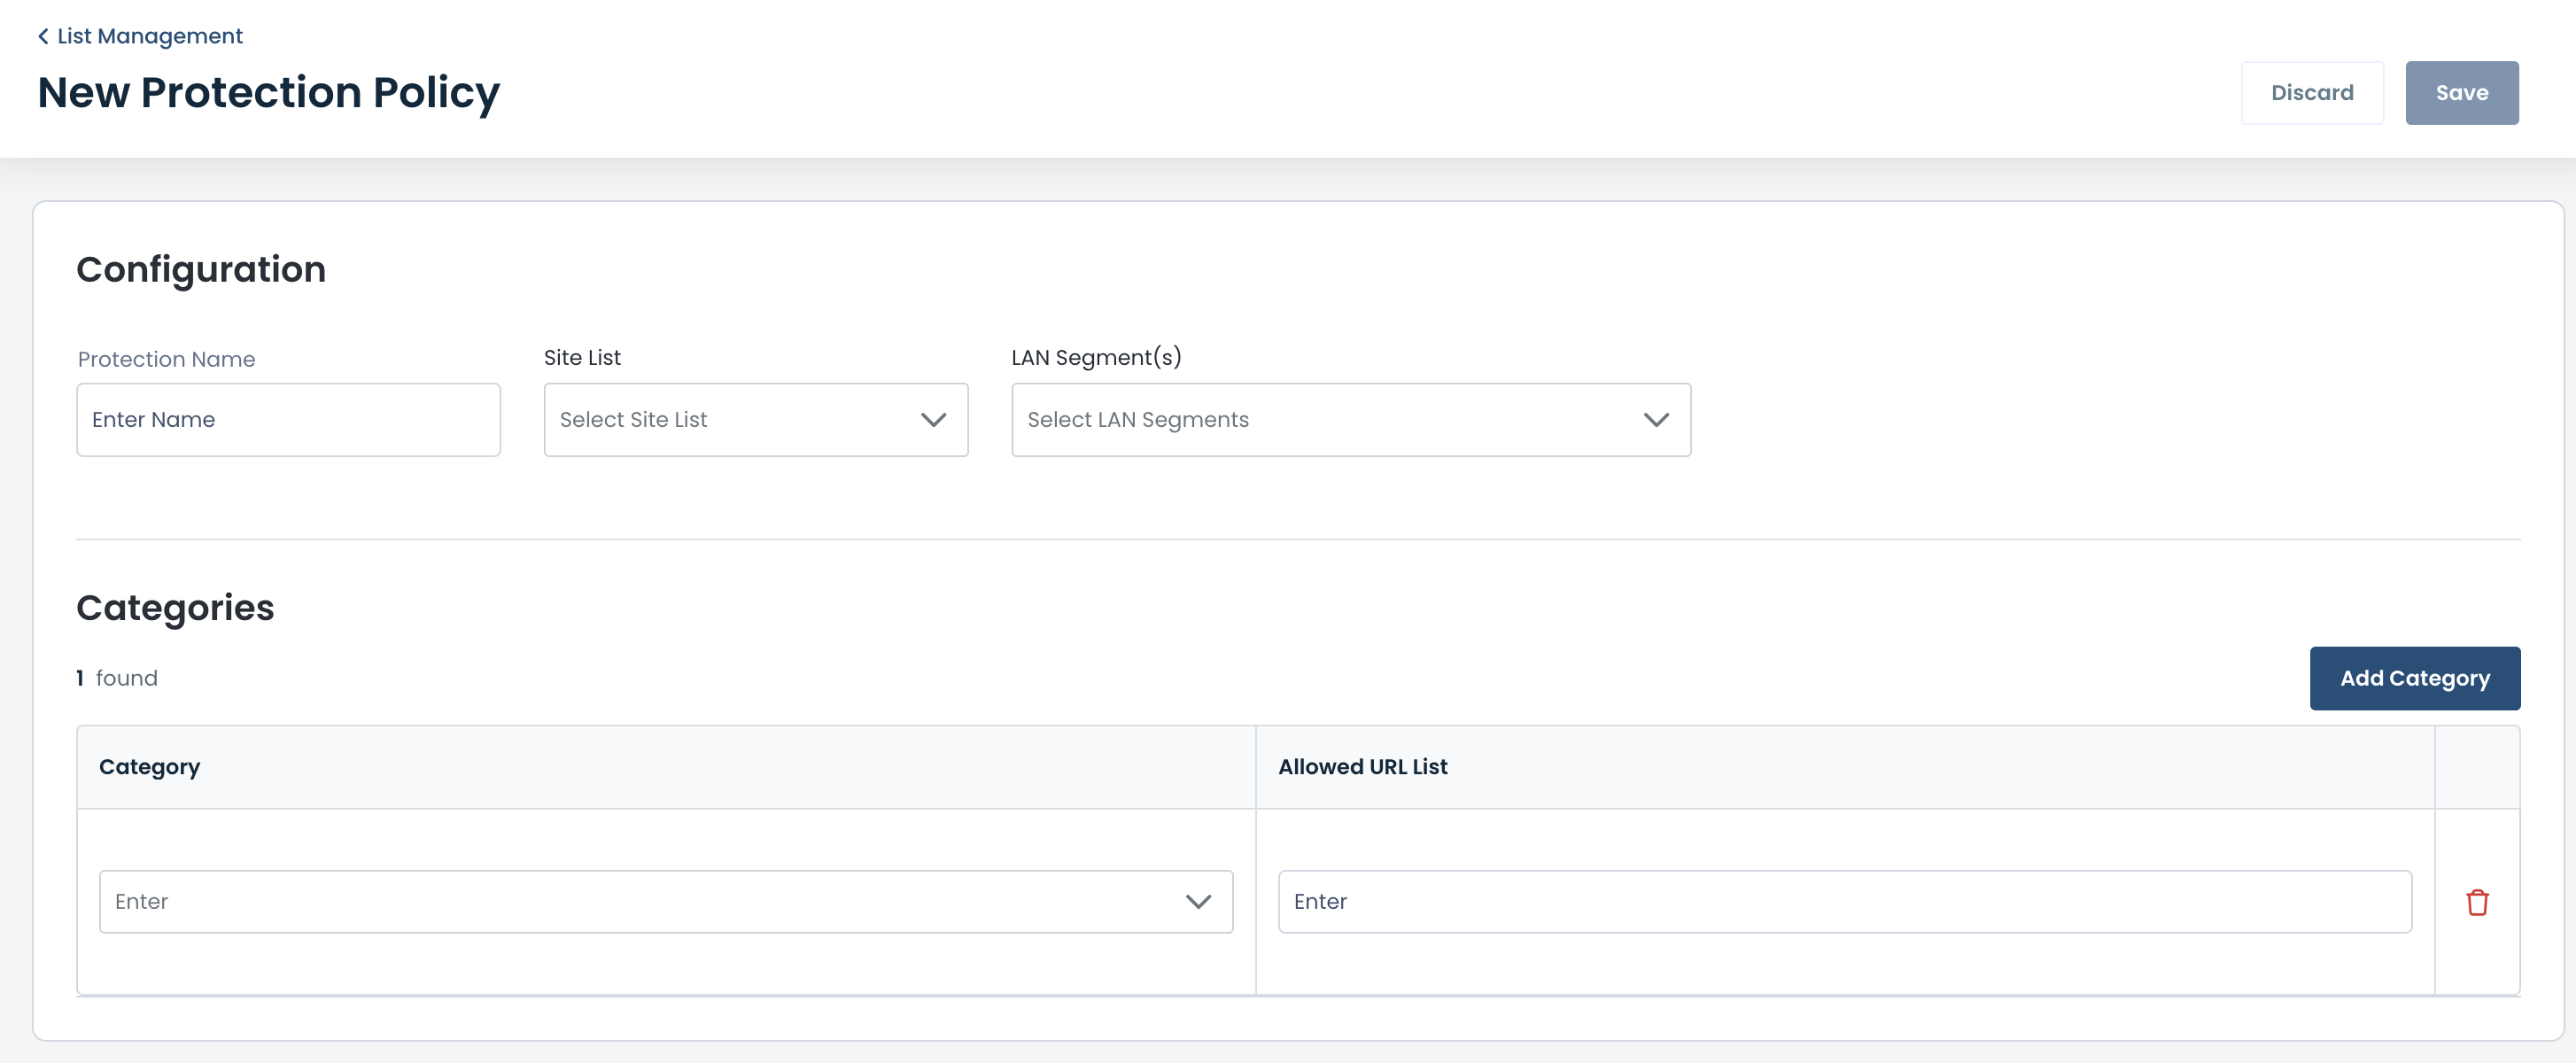
Complete the following fields:
Protection Name: Type in the name of the new policy that you are creating
Site List: From the drop-down, select the Site List that will be using this policy
For more information on Site Lists, click here.
LAN Segment(s): From the drop-down, select the LAN Segment(s) that will be using this policy
You can stop here and save the policy by clicking ‘Save’ at the top right.
If you have categories to add now, continue below.
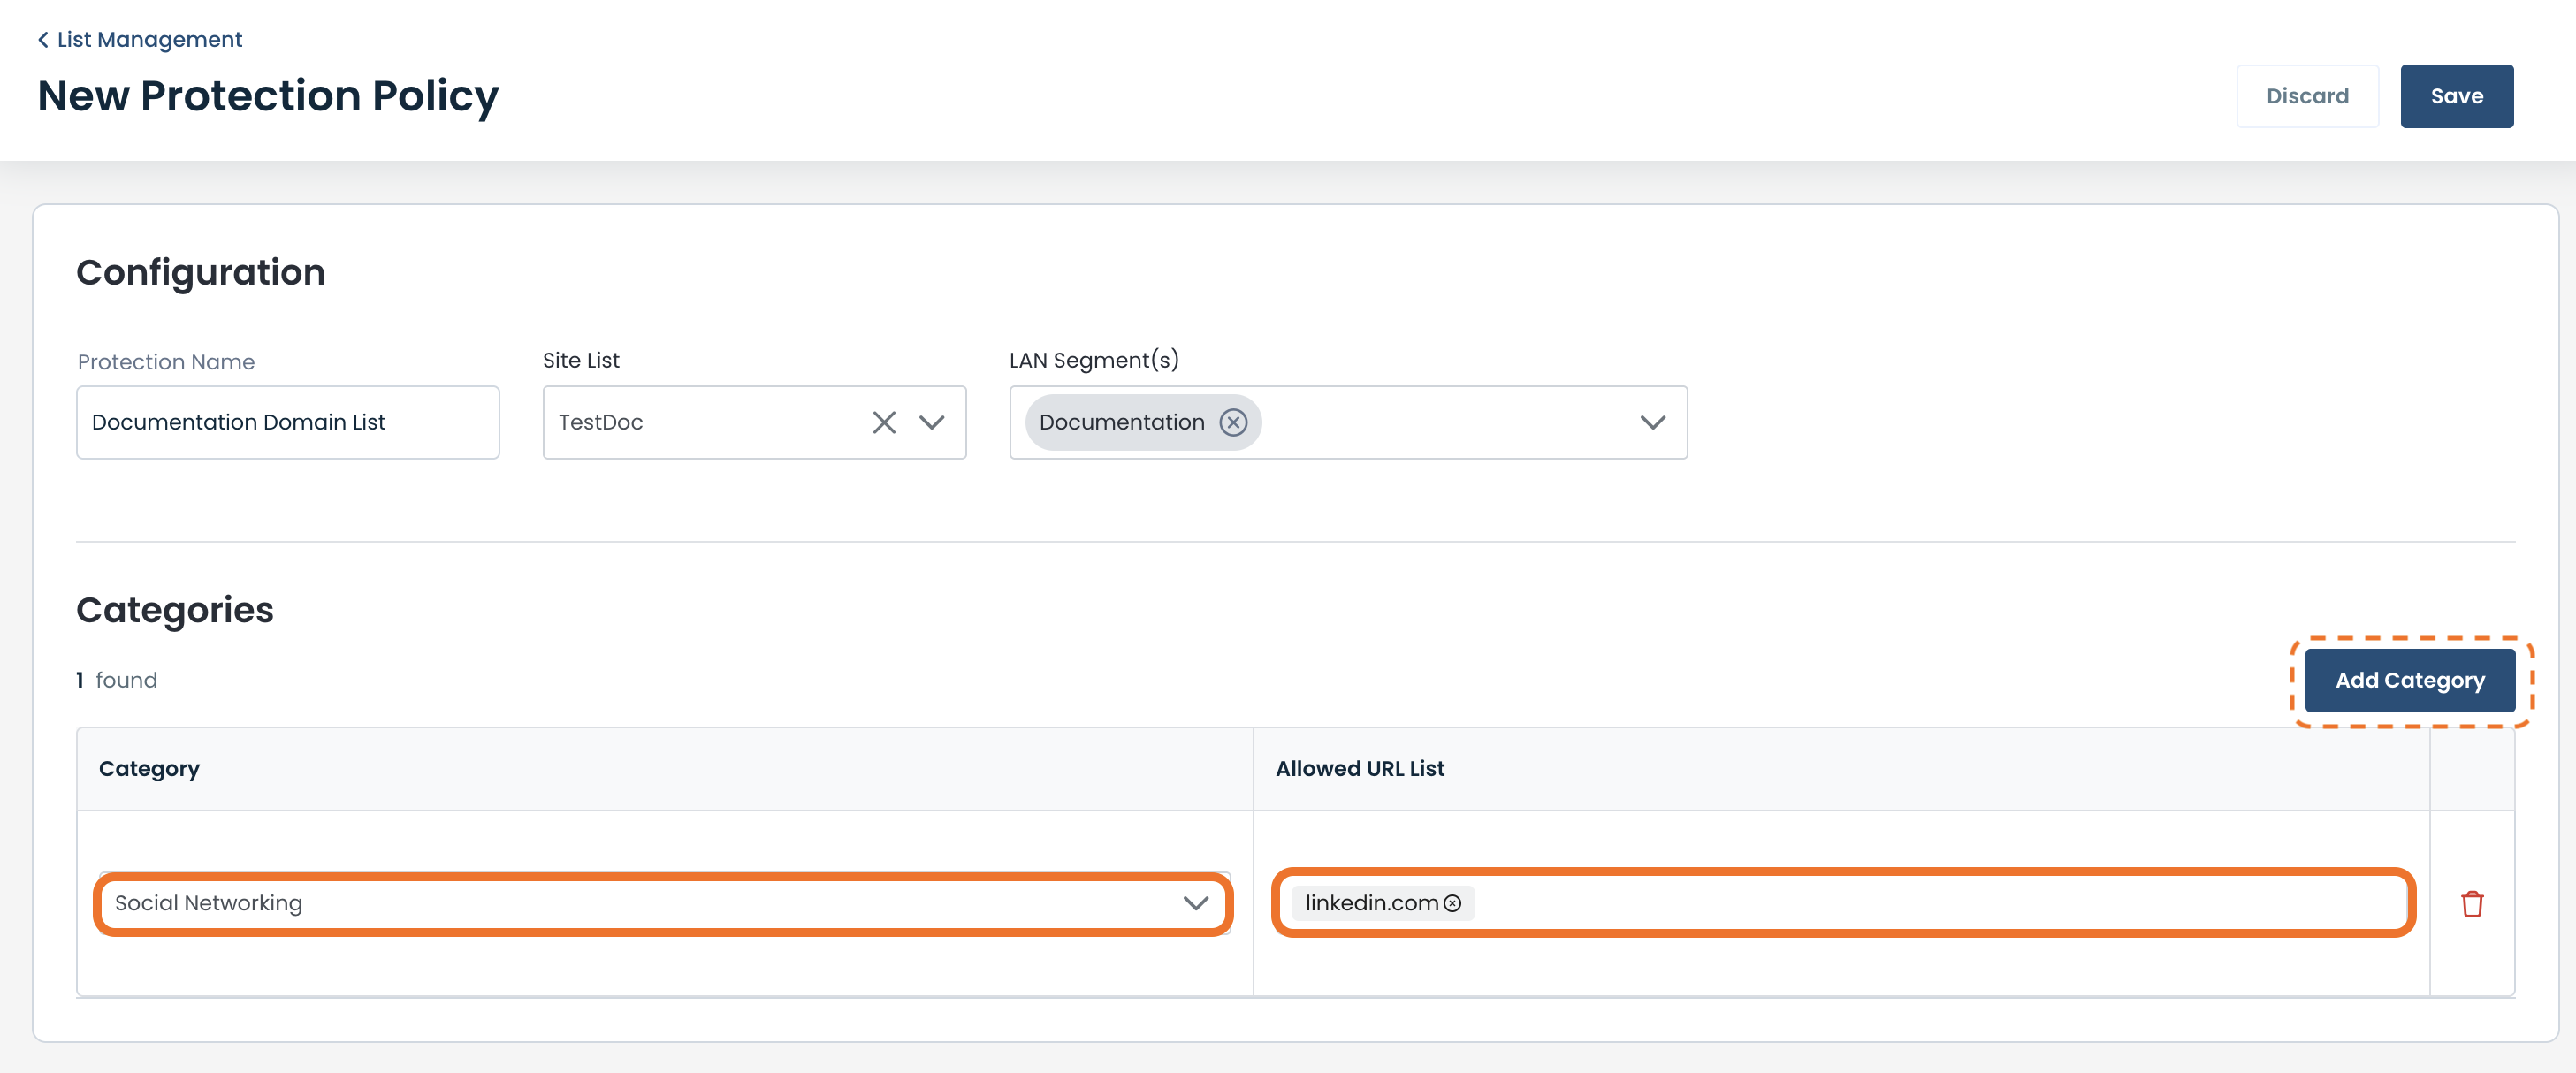
Category: Select your desired category to block from the dropdown.
Allowed URL List: If you have URLs you would like to allow through as an exception to the list, enter them here.
To add additional categories to be blocked with this policy list, click ‘Add Category’.
New fields will populate beneath the existing categories entered.
When you have added all categories that are to be included in the list, click ‘Save’ at the top right.
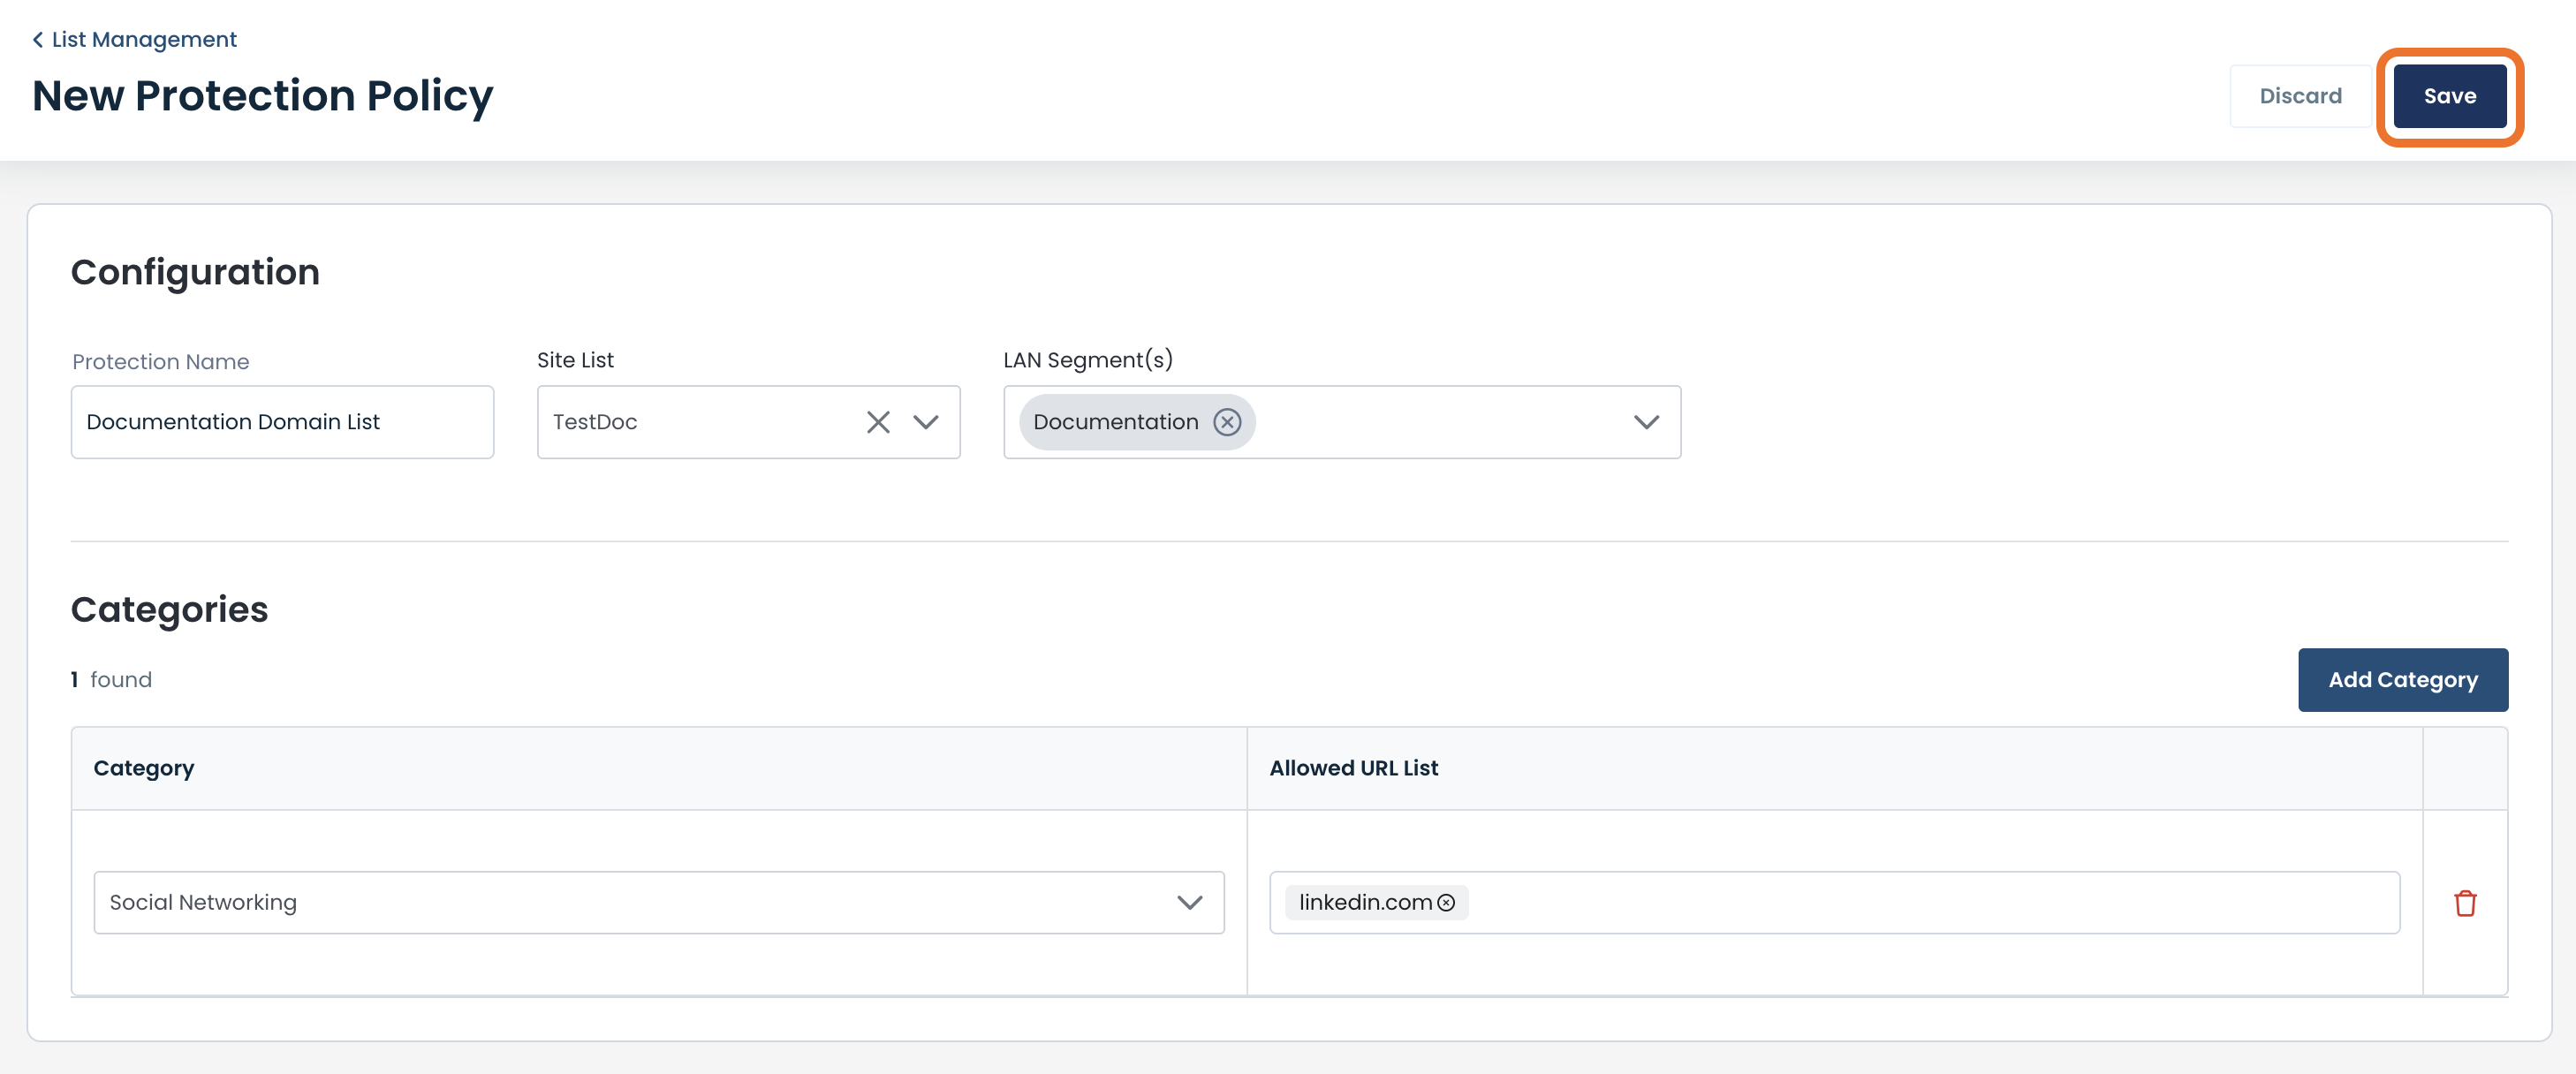
You will now see the new Protection Policy in the Protections List summary table.
Blocking Individual Applications in Data Assurance
Whether an application has been found to be malicious, or you simply don’t want it in your network, Data Assurance easily allows you to block it.
To block an application from entering your network, click the ‘Block’ icon to the right of the application in the Application Details table.
This will open a modal to block the application.
You will need to select a Data Assurance Block List to which to assign this application; you can either:
Select a Block List from the dropdown
or
Create a new one.
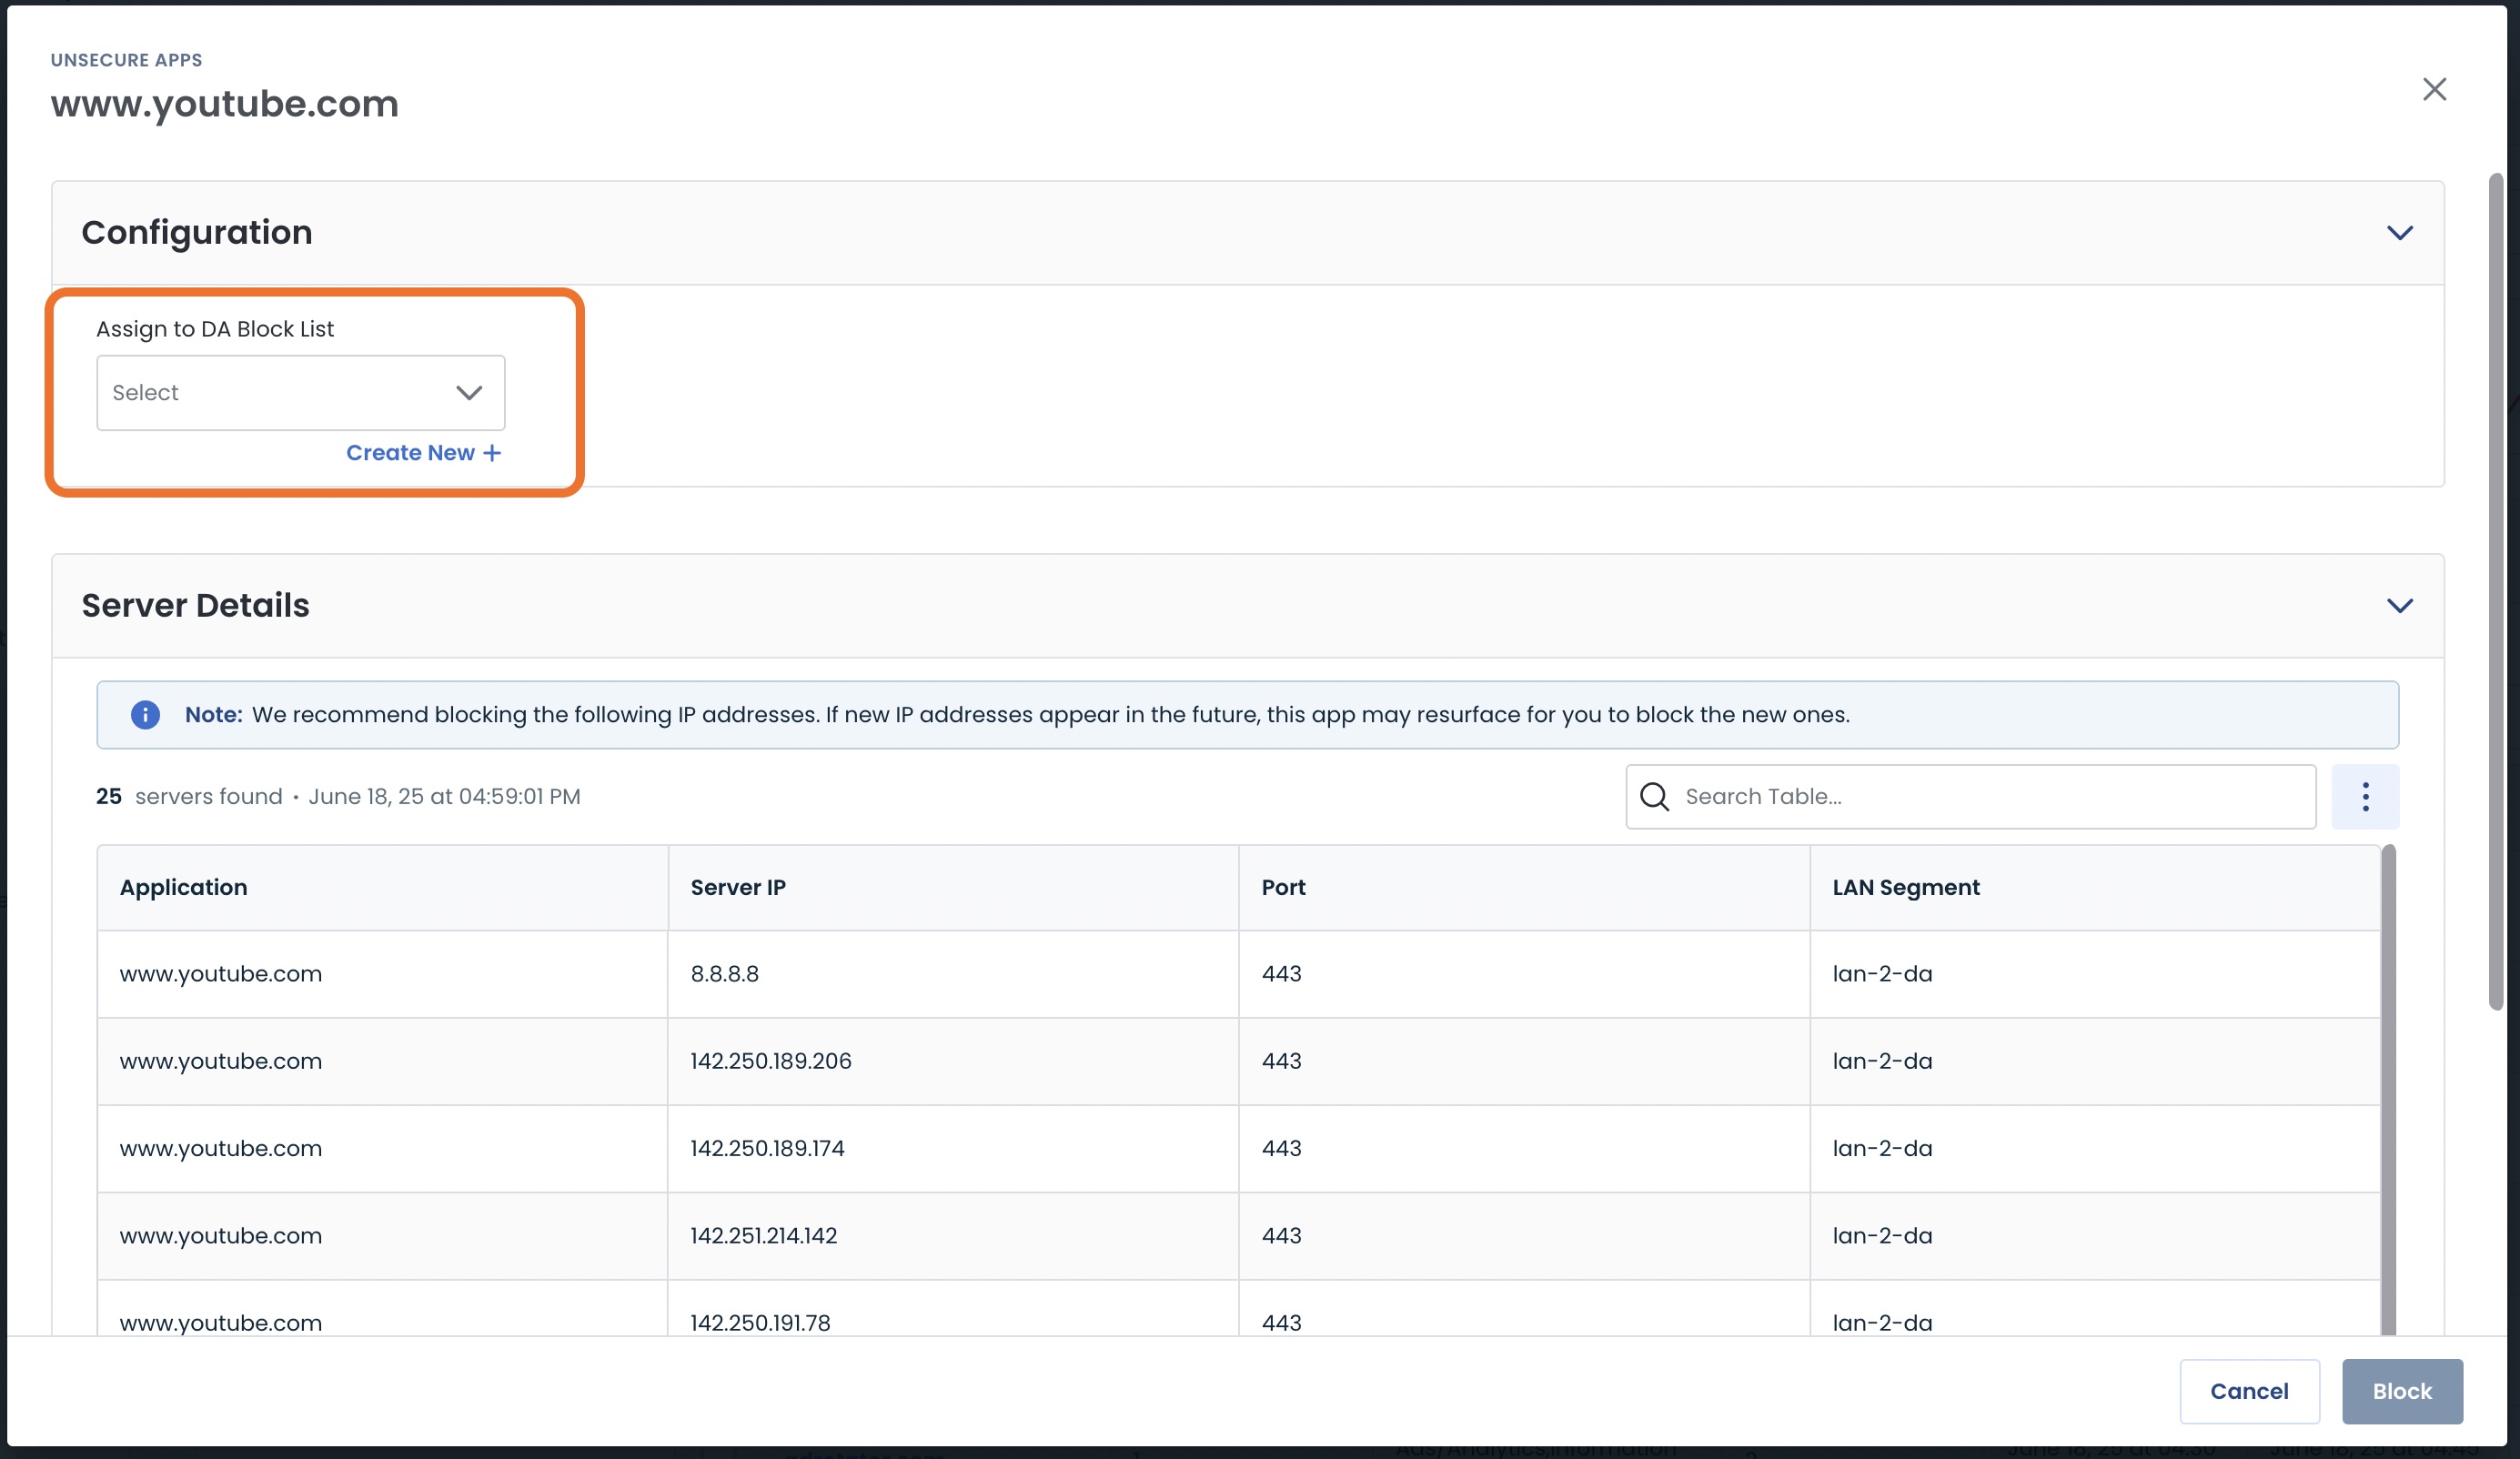
Should you need to create a new Data Assurance Block List, click ‘+ Create New’ .
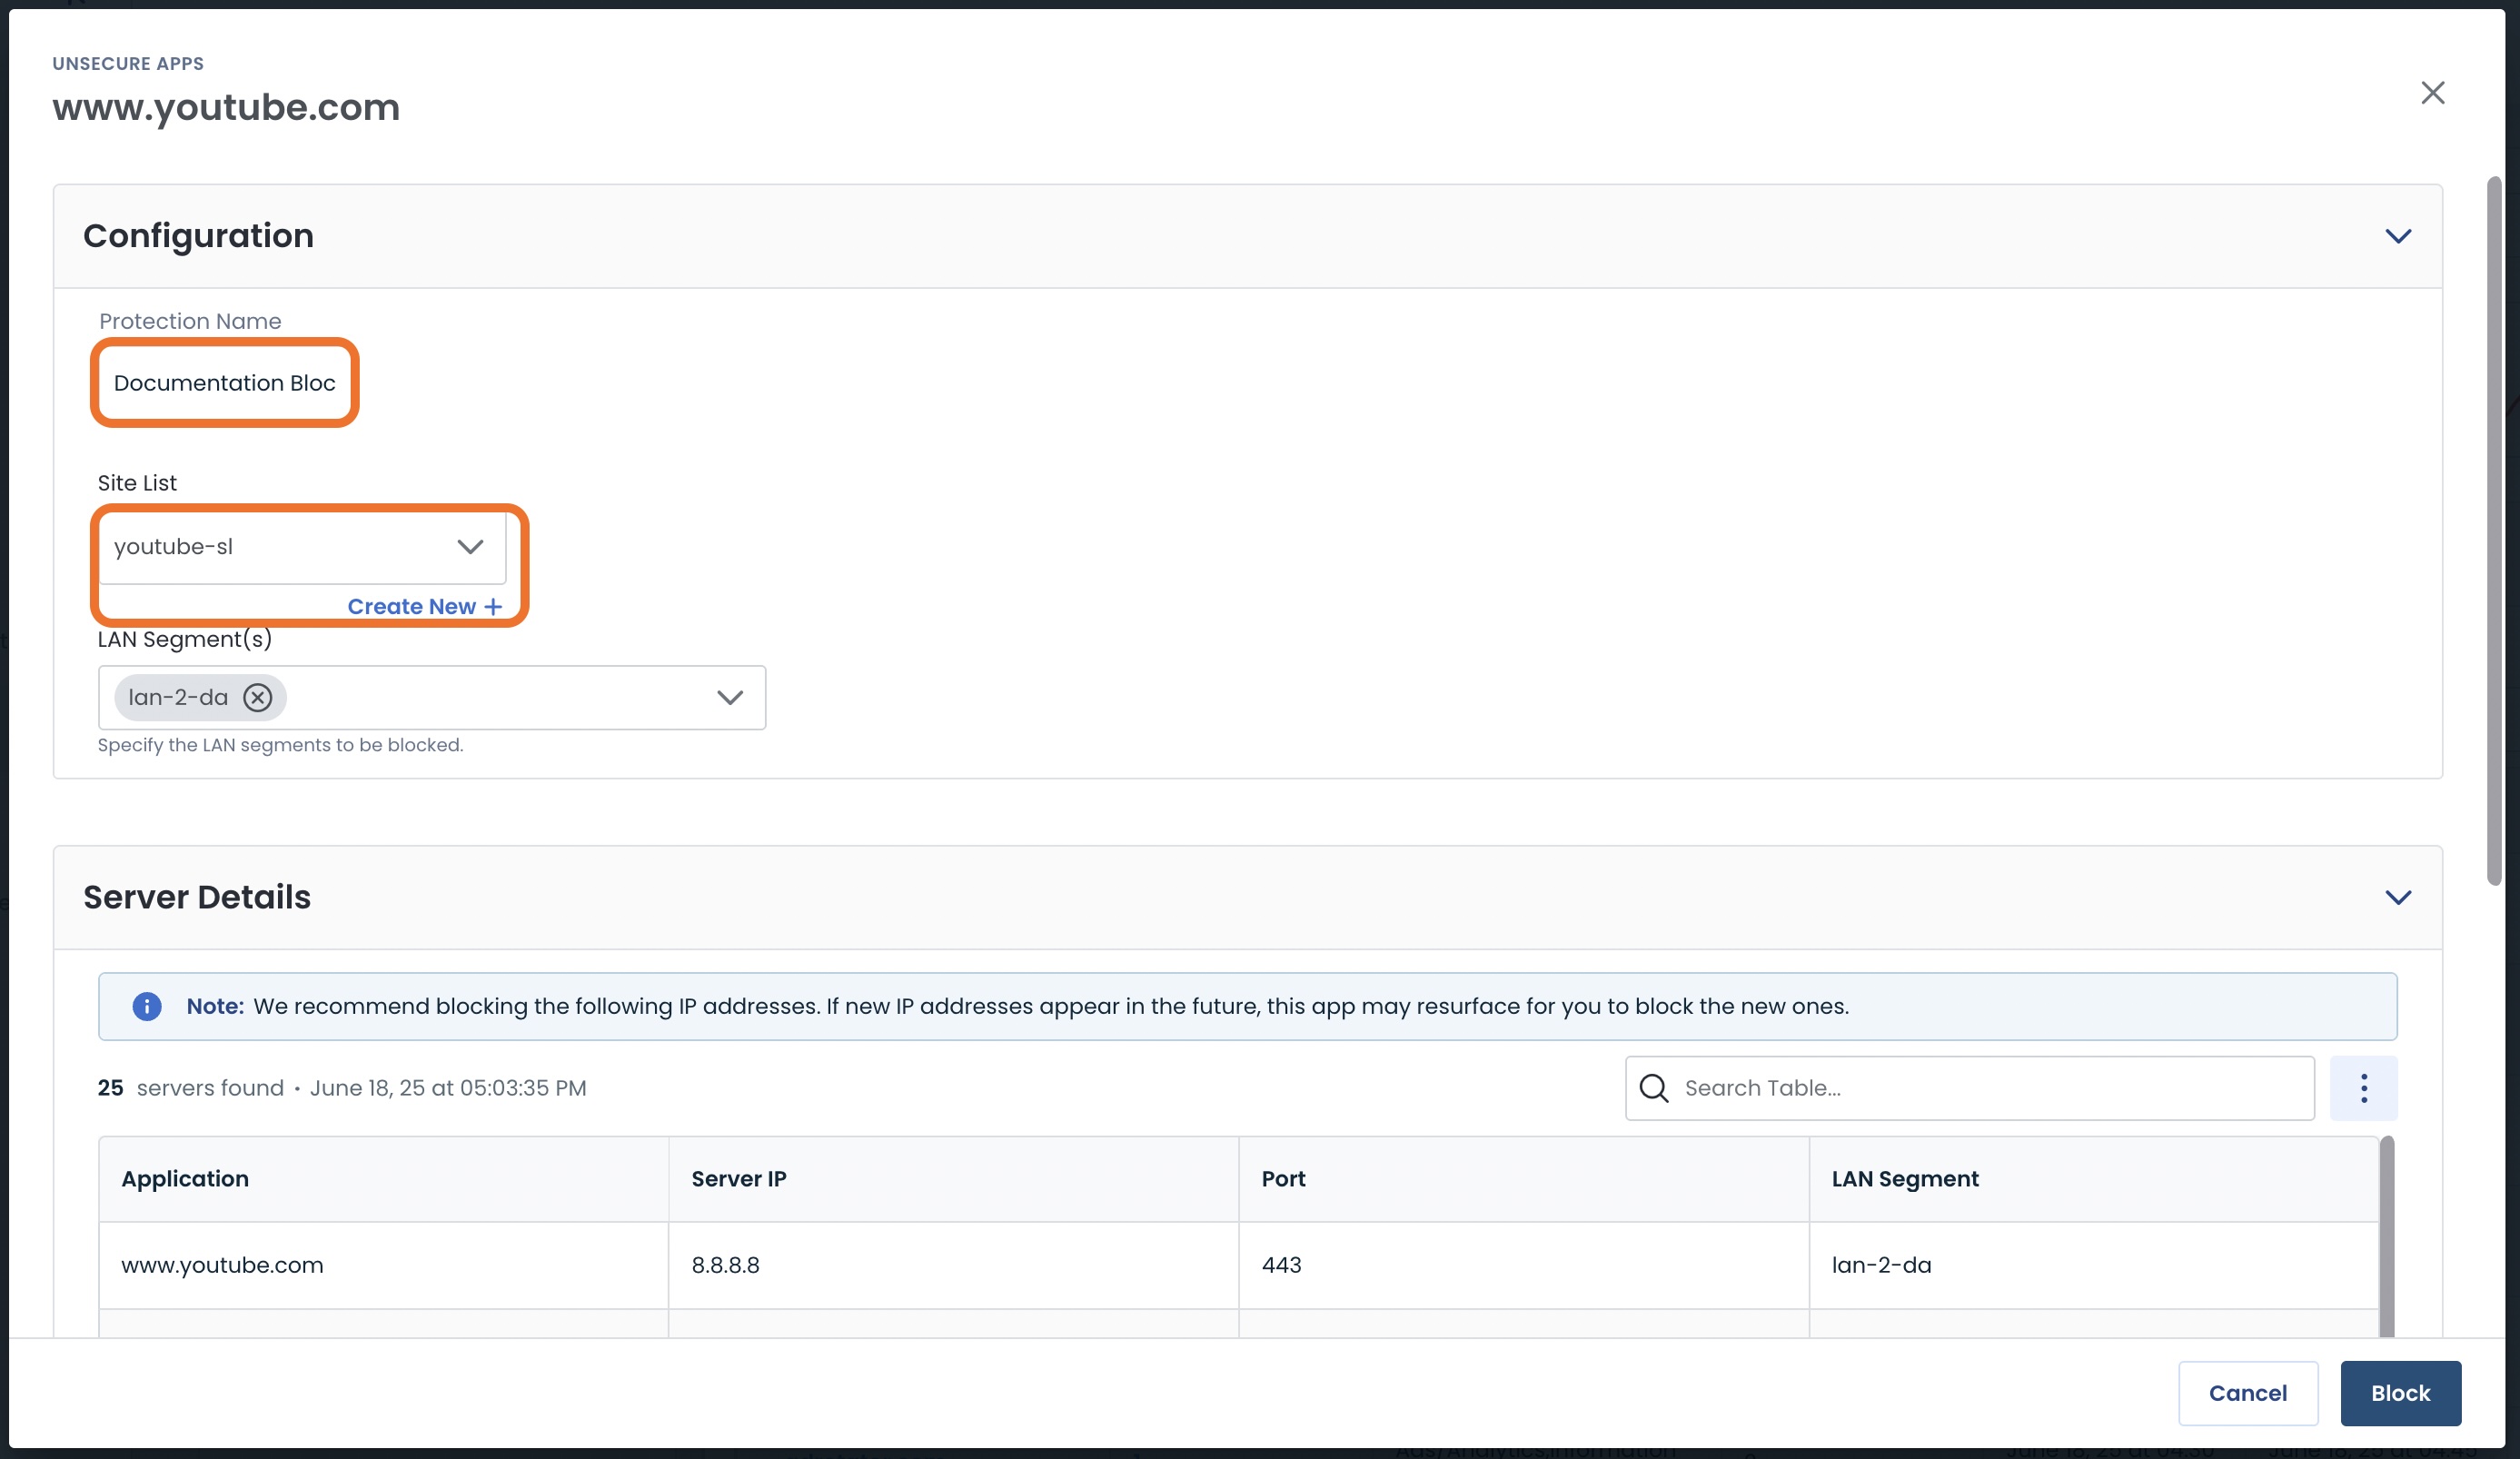
You will need to supply the following information:
Protection Name: The name of the block list for this and possible future applications
Site List: From the drop-down, select the site(s) that will be protected by rejecting applications within this Block List. If you need to create a new Site List, click ‘Create New’. For information on Site Lists, click here.
Note:
The LAN Segment field will be pre-populated with the LAN segments that have already encountered this application in the table below.
Now that you have either assigned an existing Block List, or created. your own, the block action is ready to take.
Click ‘Block’.
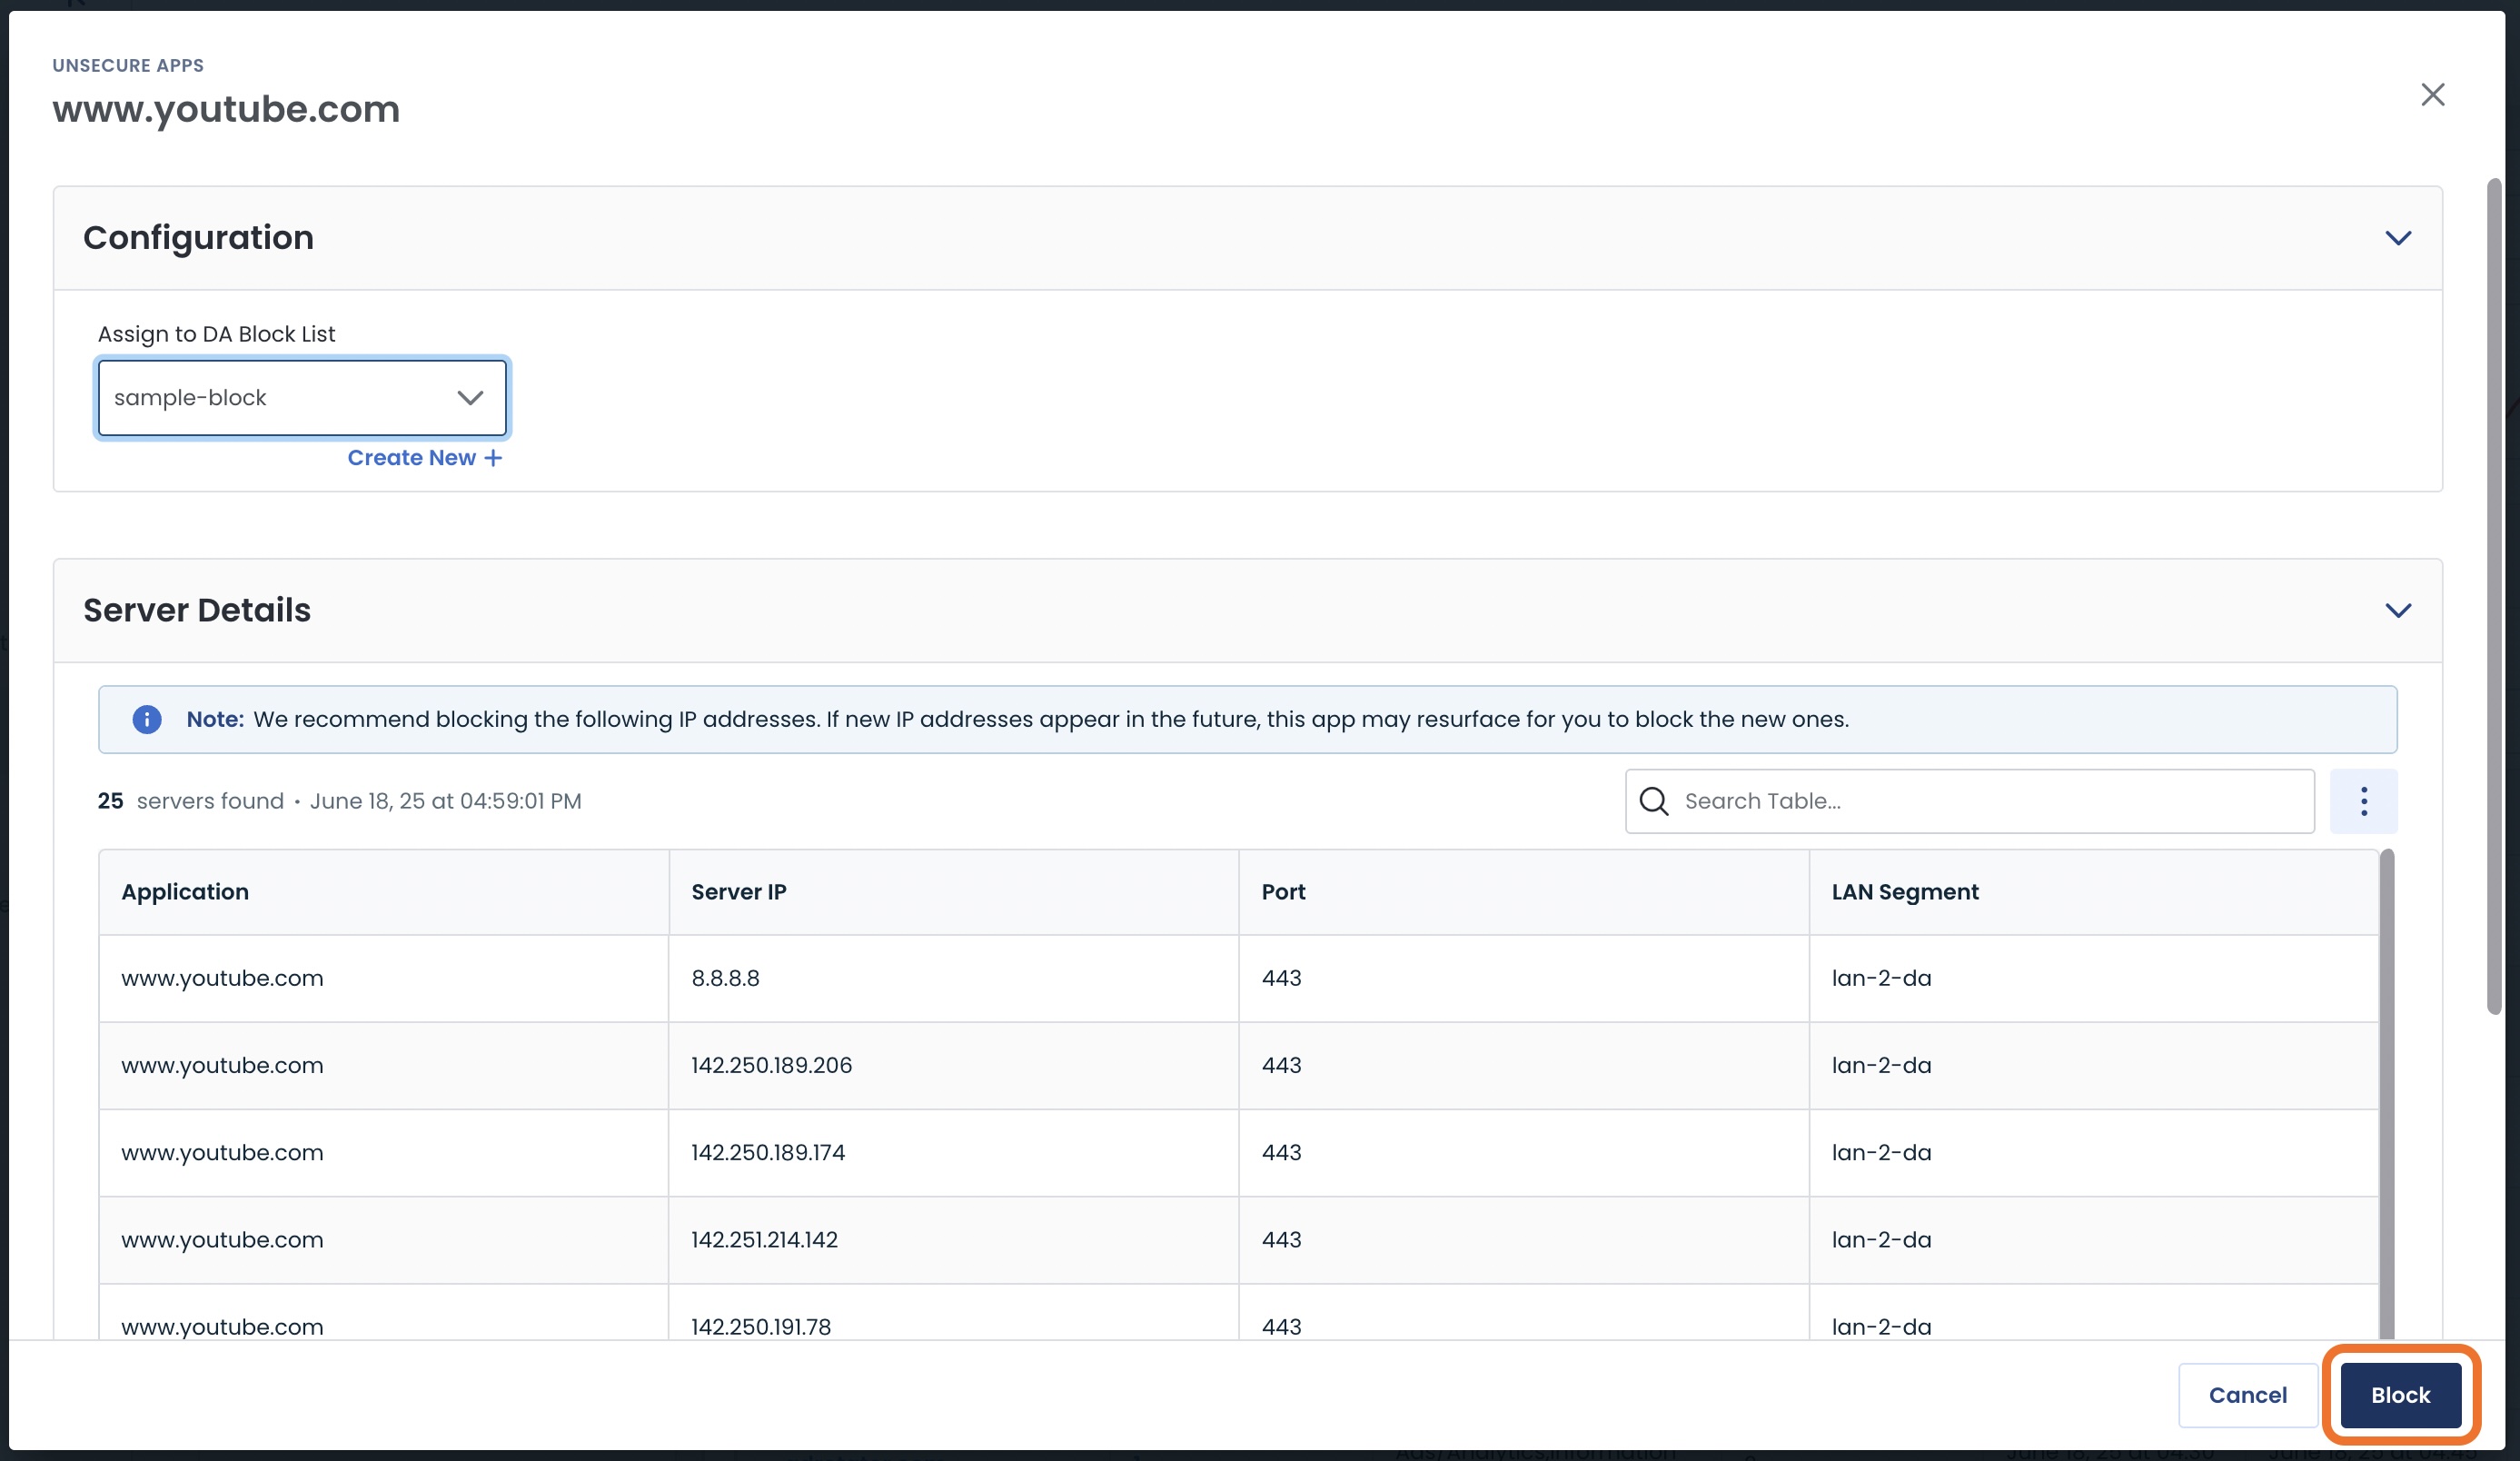
The blocked application now appears in the blocked table.
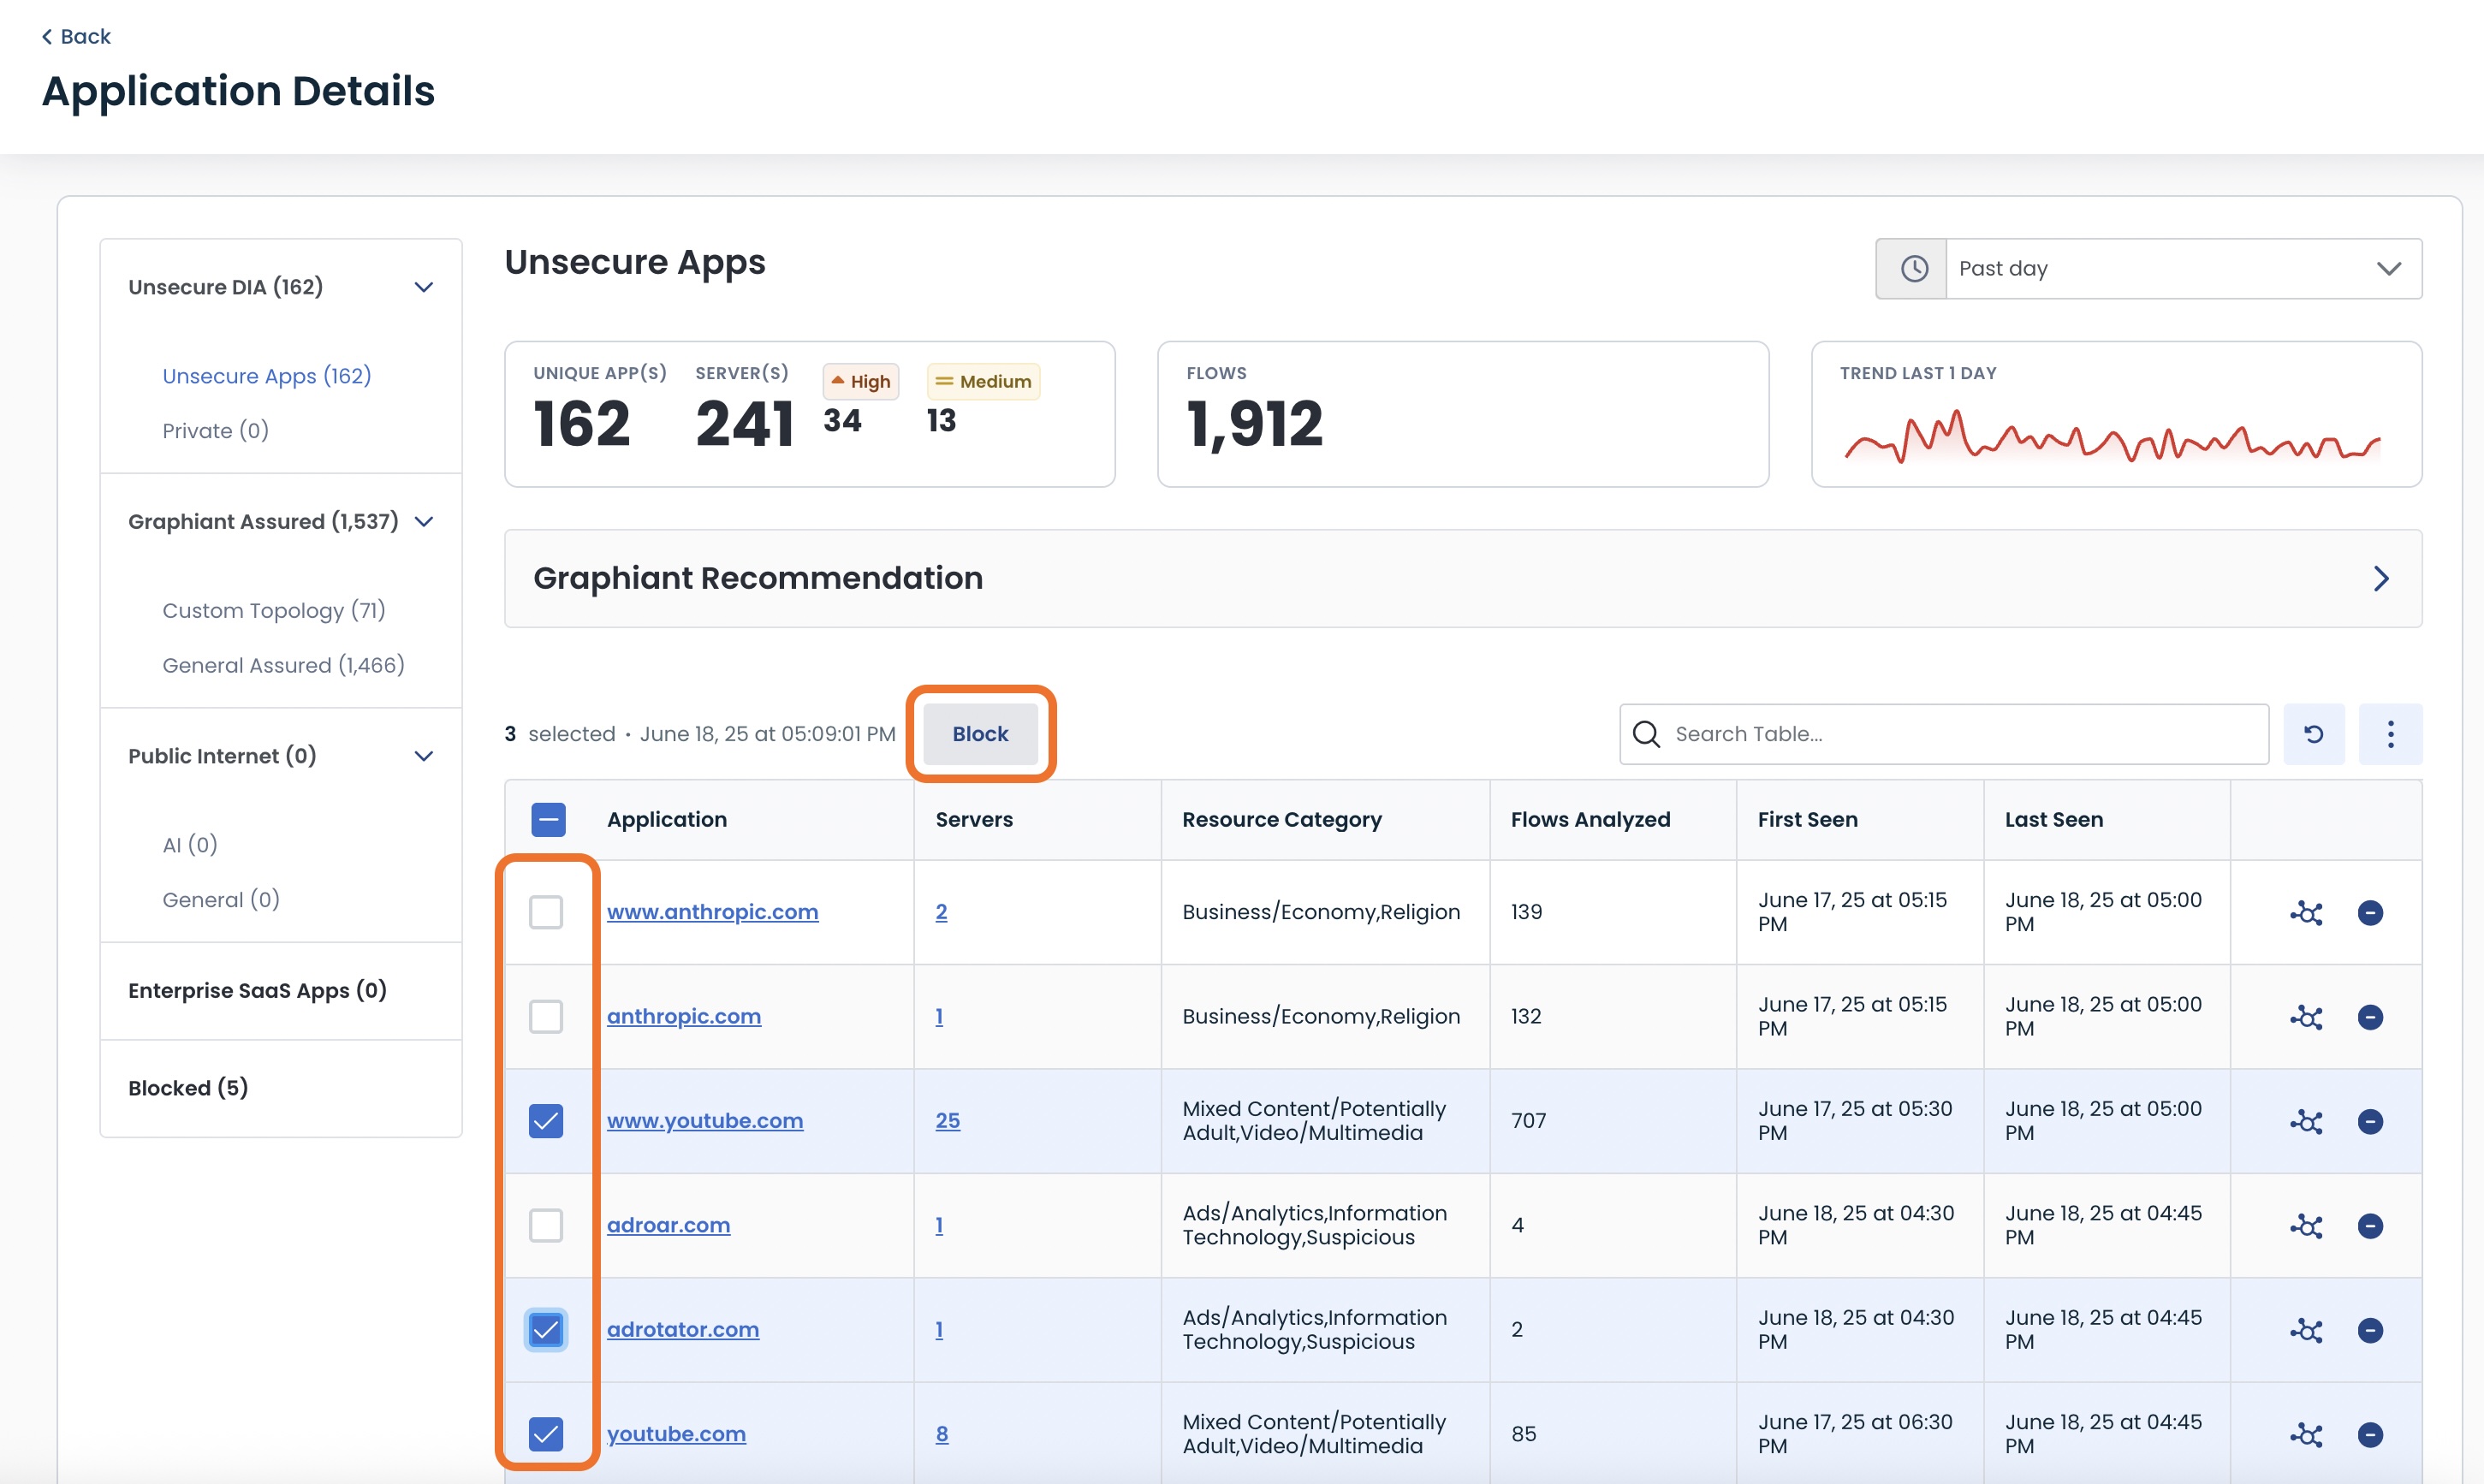
Using the Bulk Action to Block Applications in Data Assurance
If you would like to block multiple applications simultaneously, select the applications by utilizing the corresponding boxes to the left of the applications; click ‘Block’.
Follow the same instructions as above for a single application from here:
Assign to a / Create a New DA Block List
Click ‘Block’.
Warning:
All LAN Segments involved in any of these applications will be blocked. If this not your intention, block the applications individually.
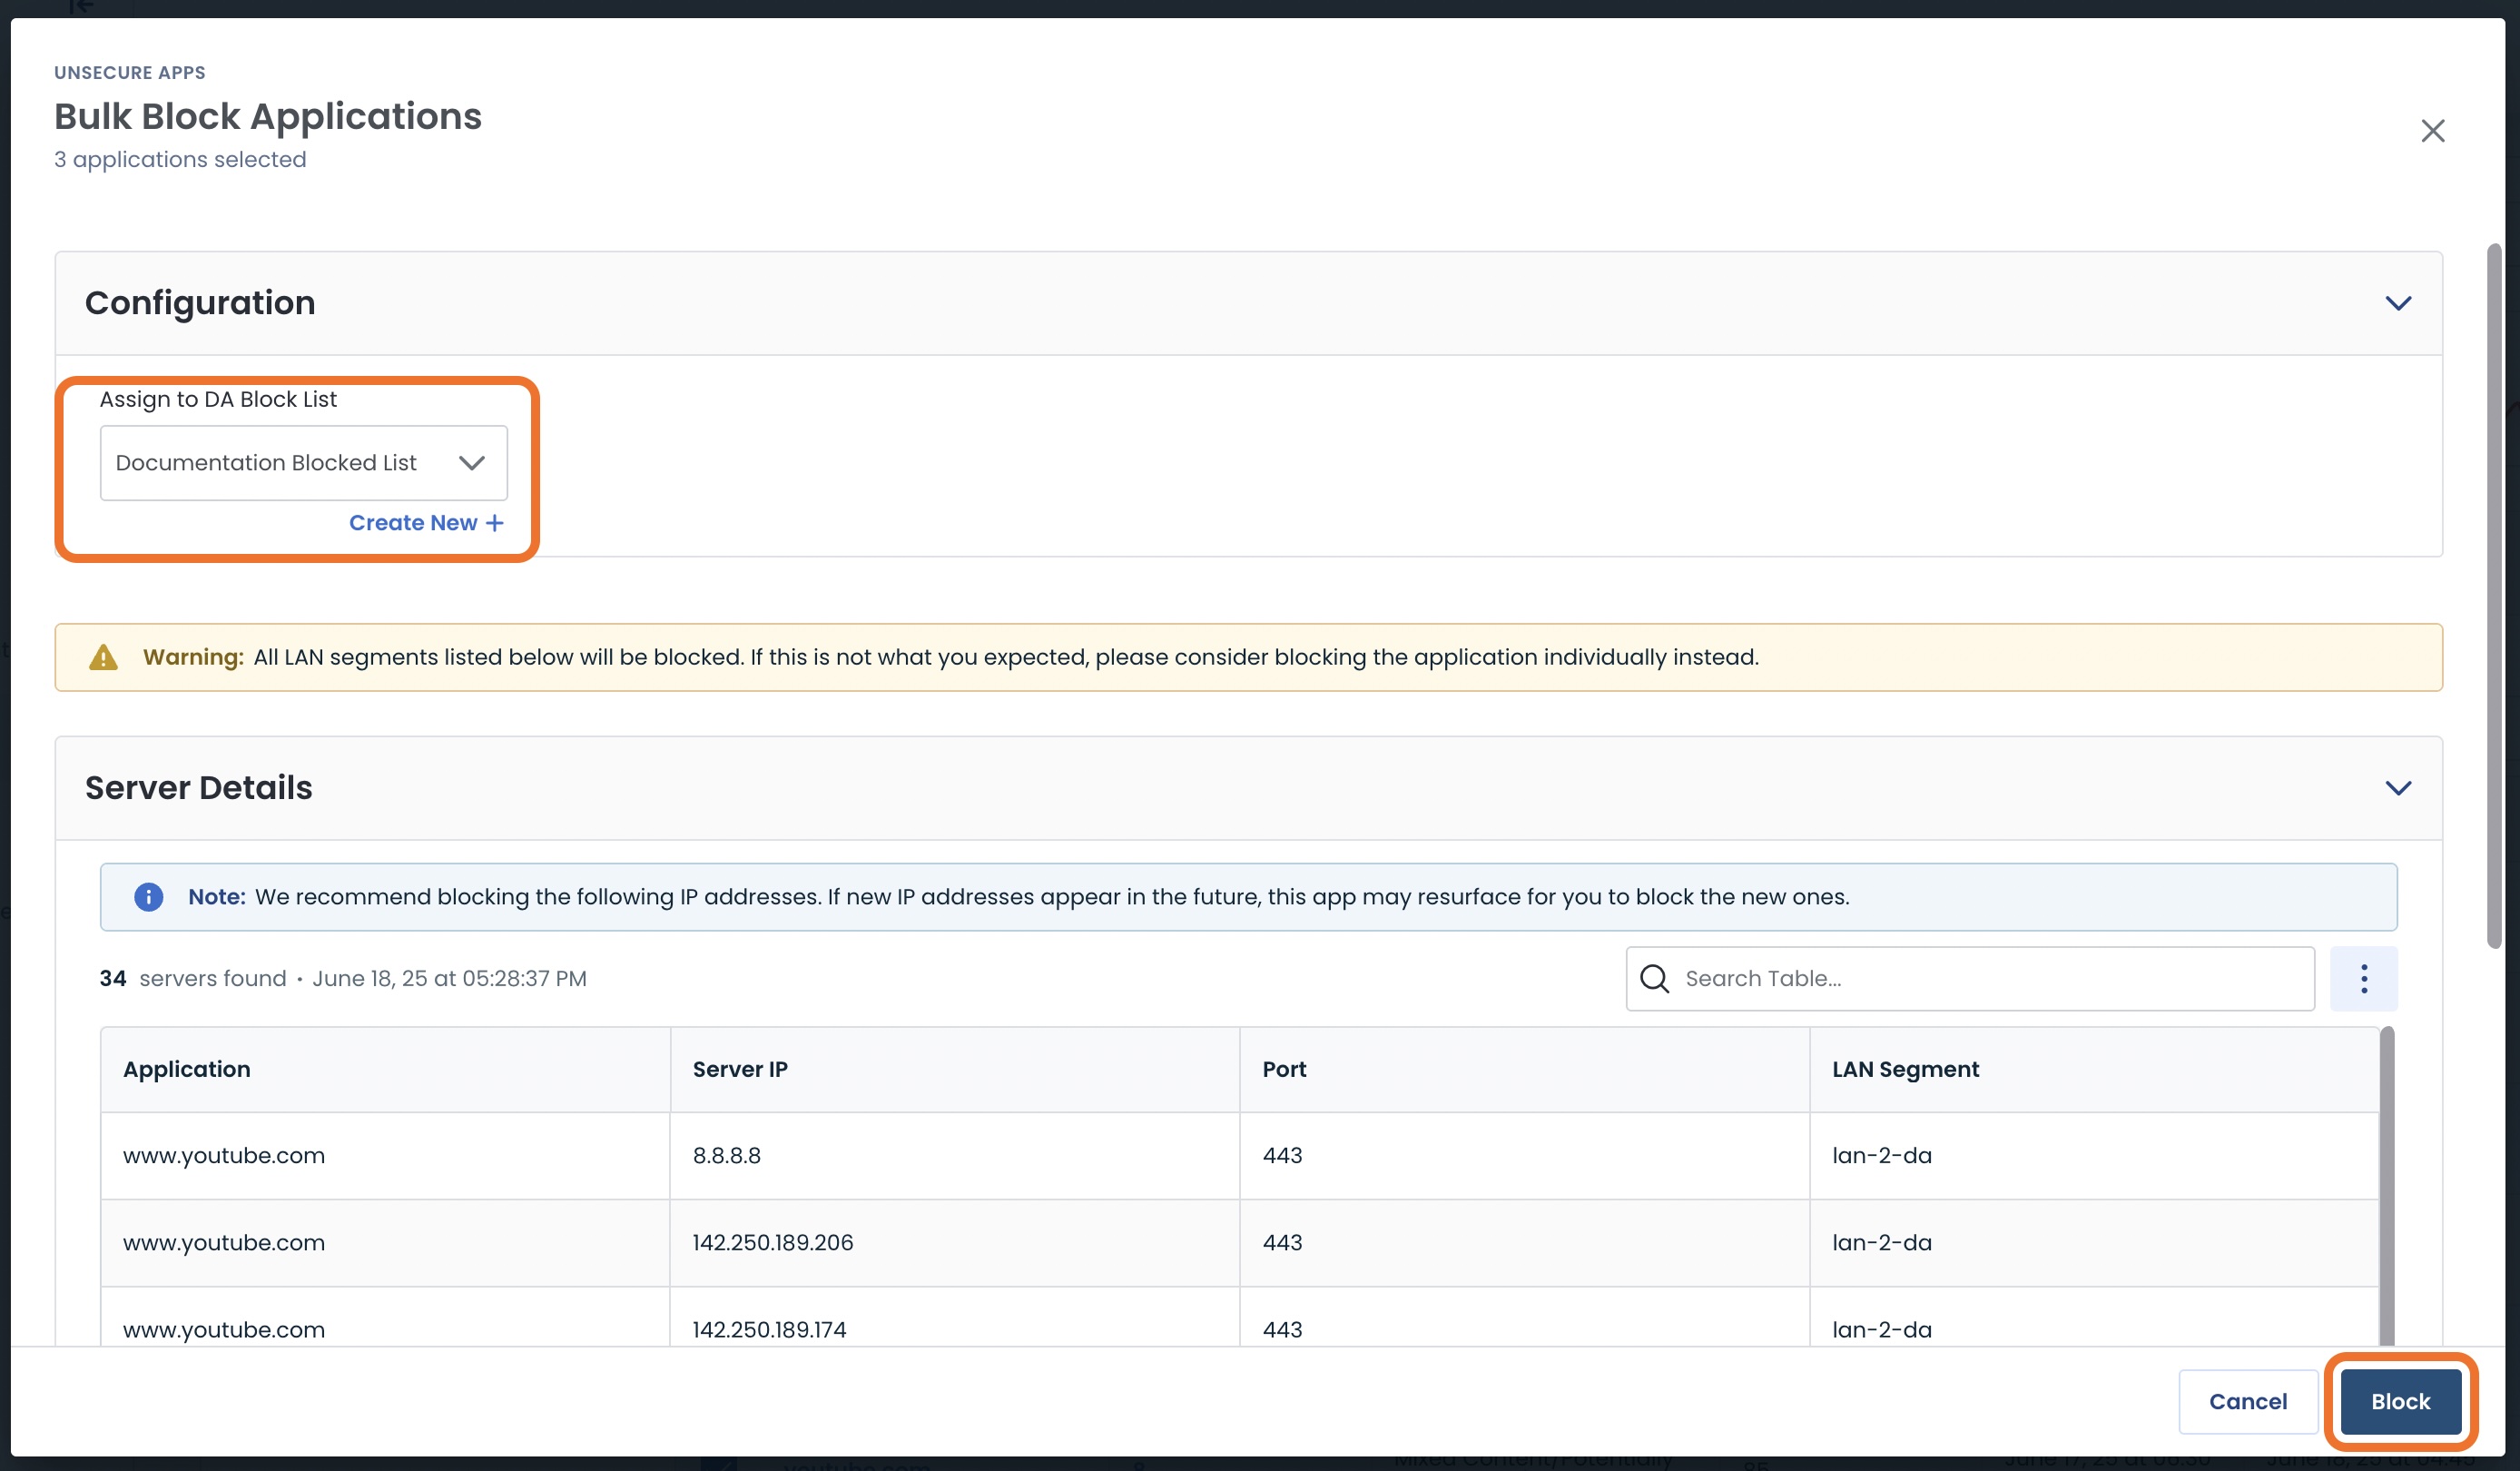
These apps will now appear in the Blocked Applications table.
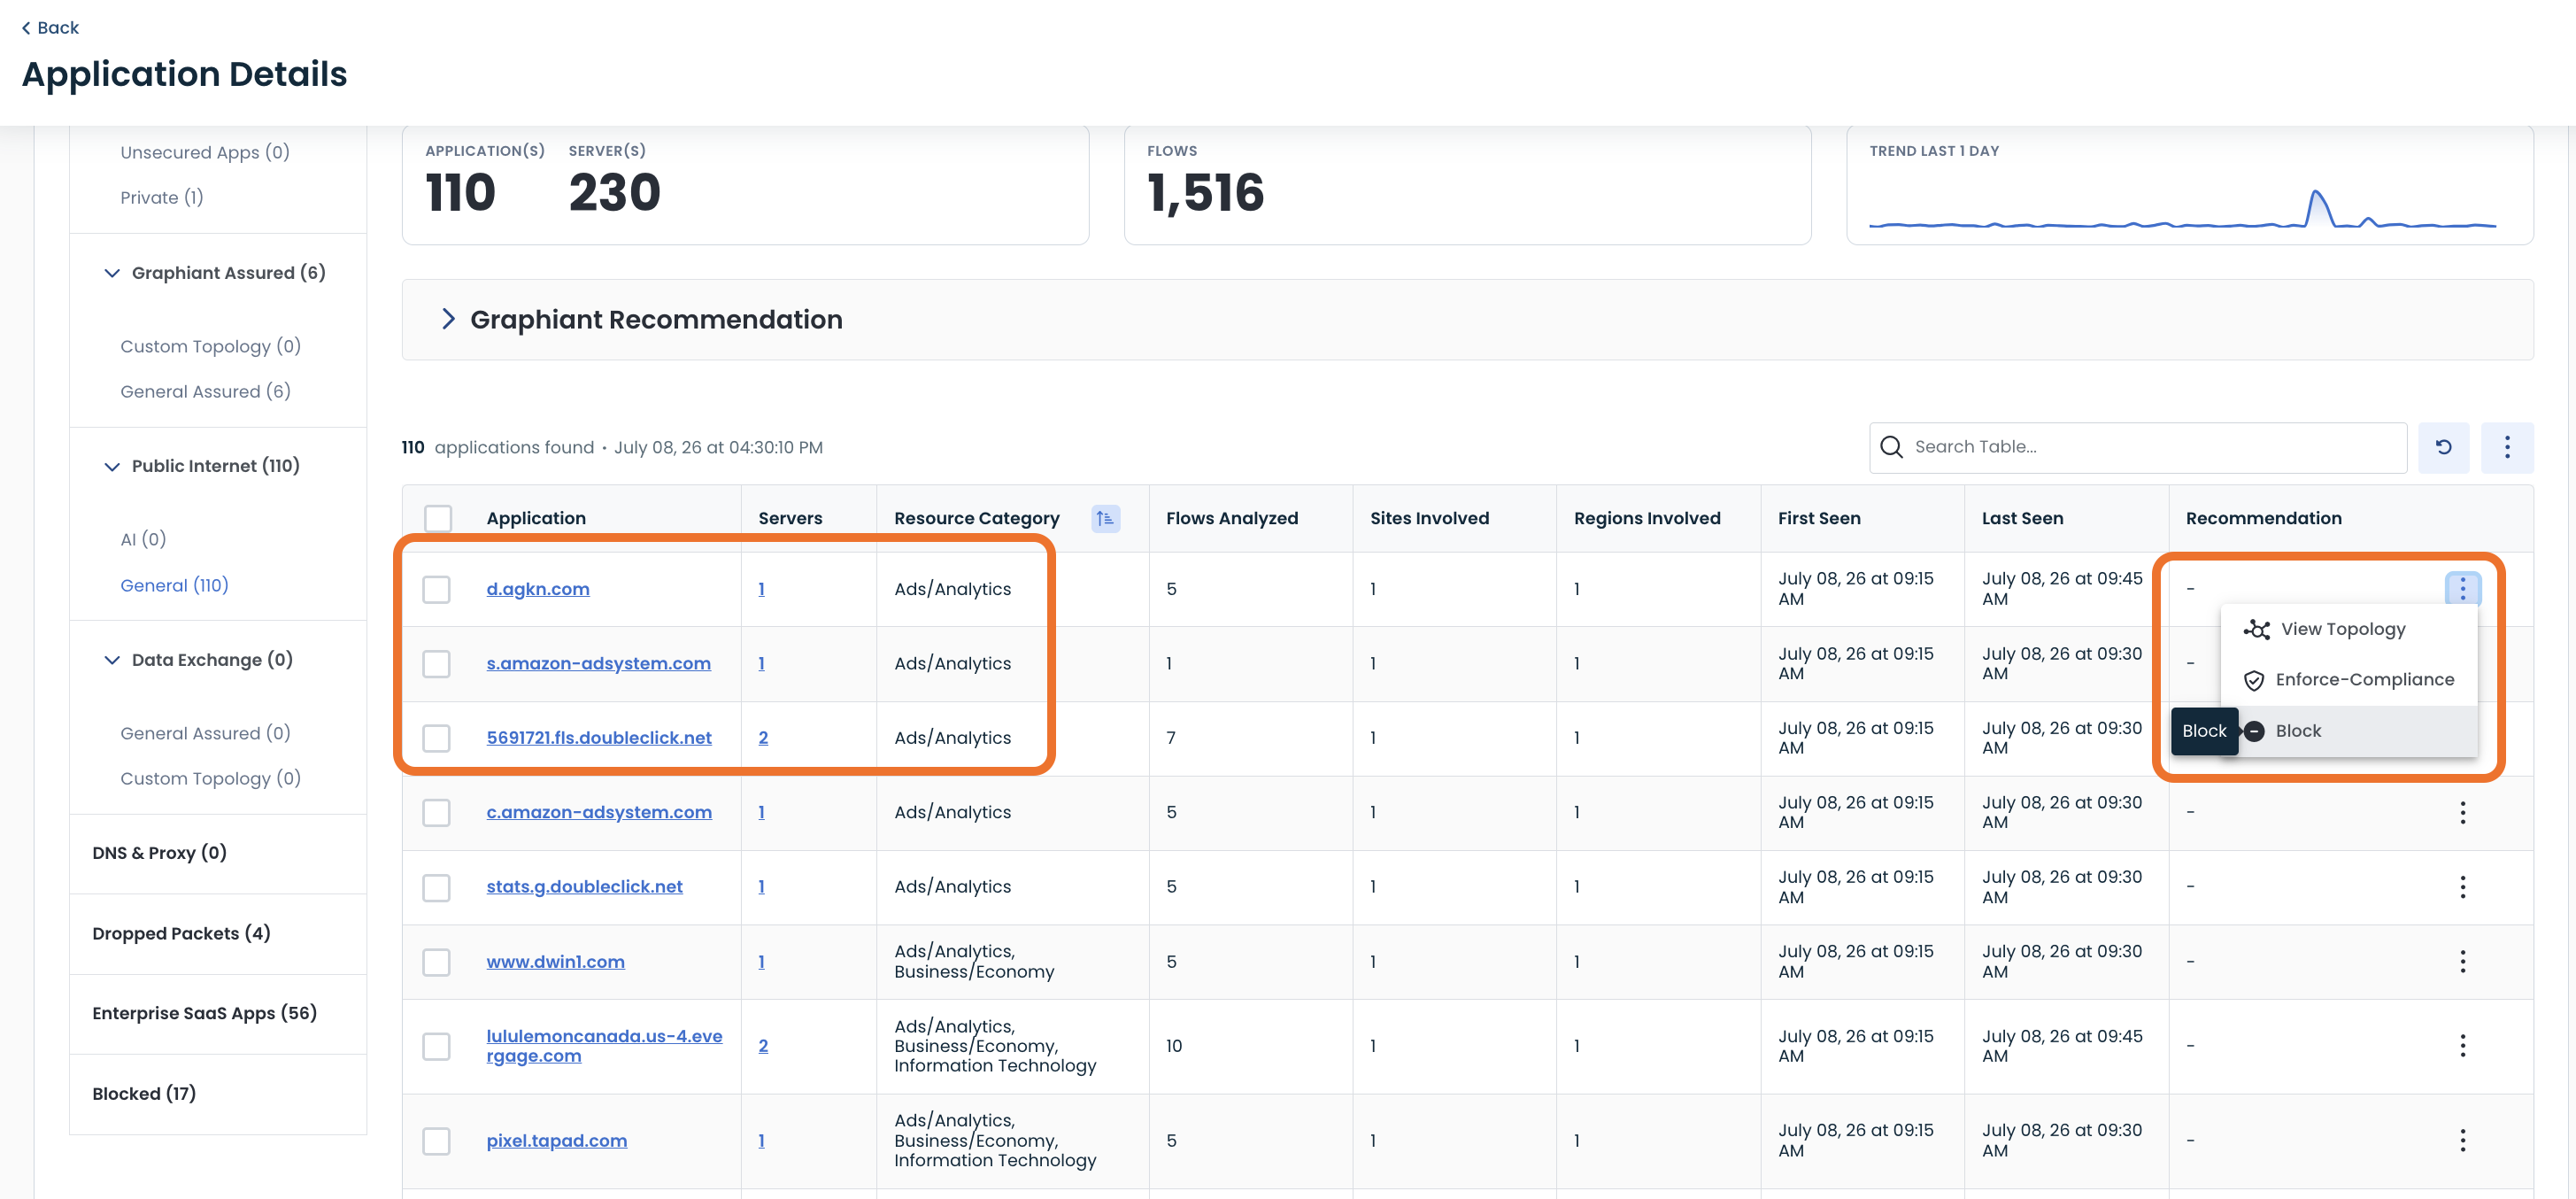
Blocking Applications by Categories in Data Assurance
If you would like to block all the applications from a category, click on the three-dot menu on the right and select block.
Then select option ‘Block all sites in the associated categories’.
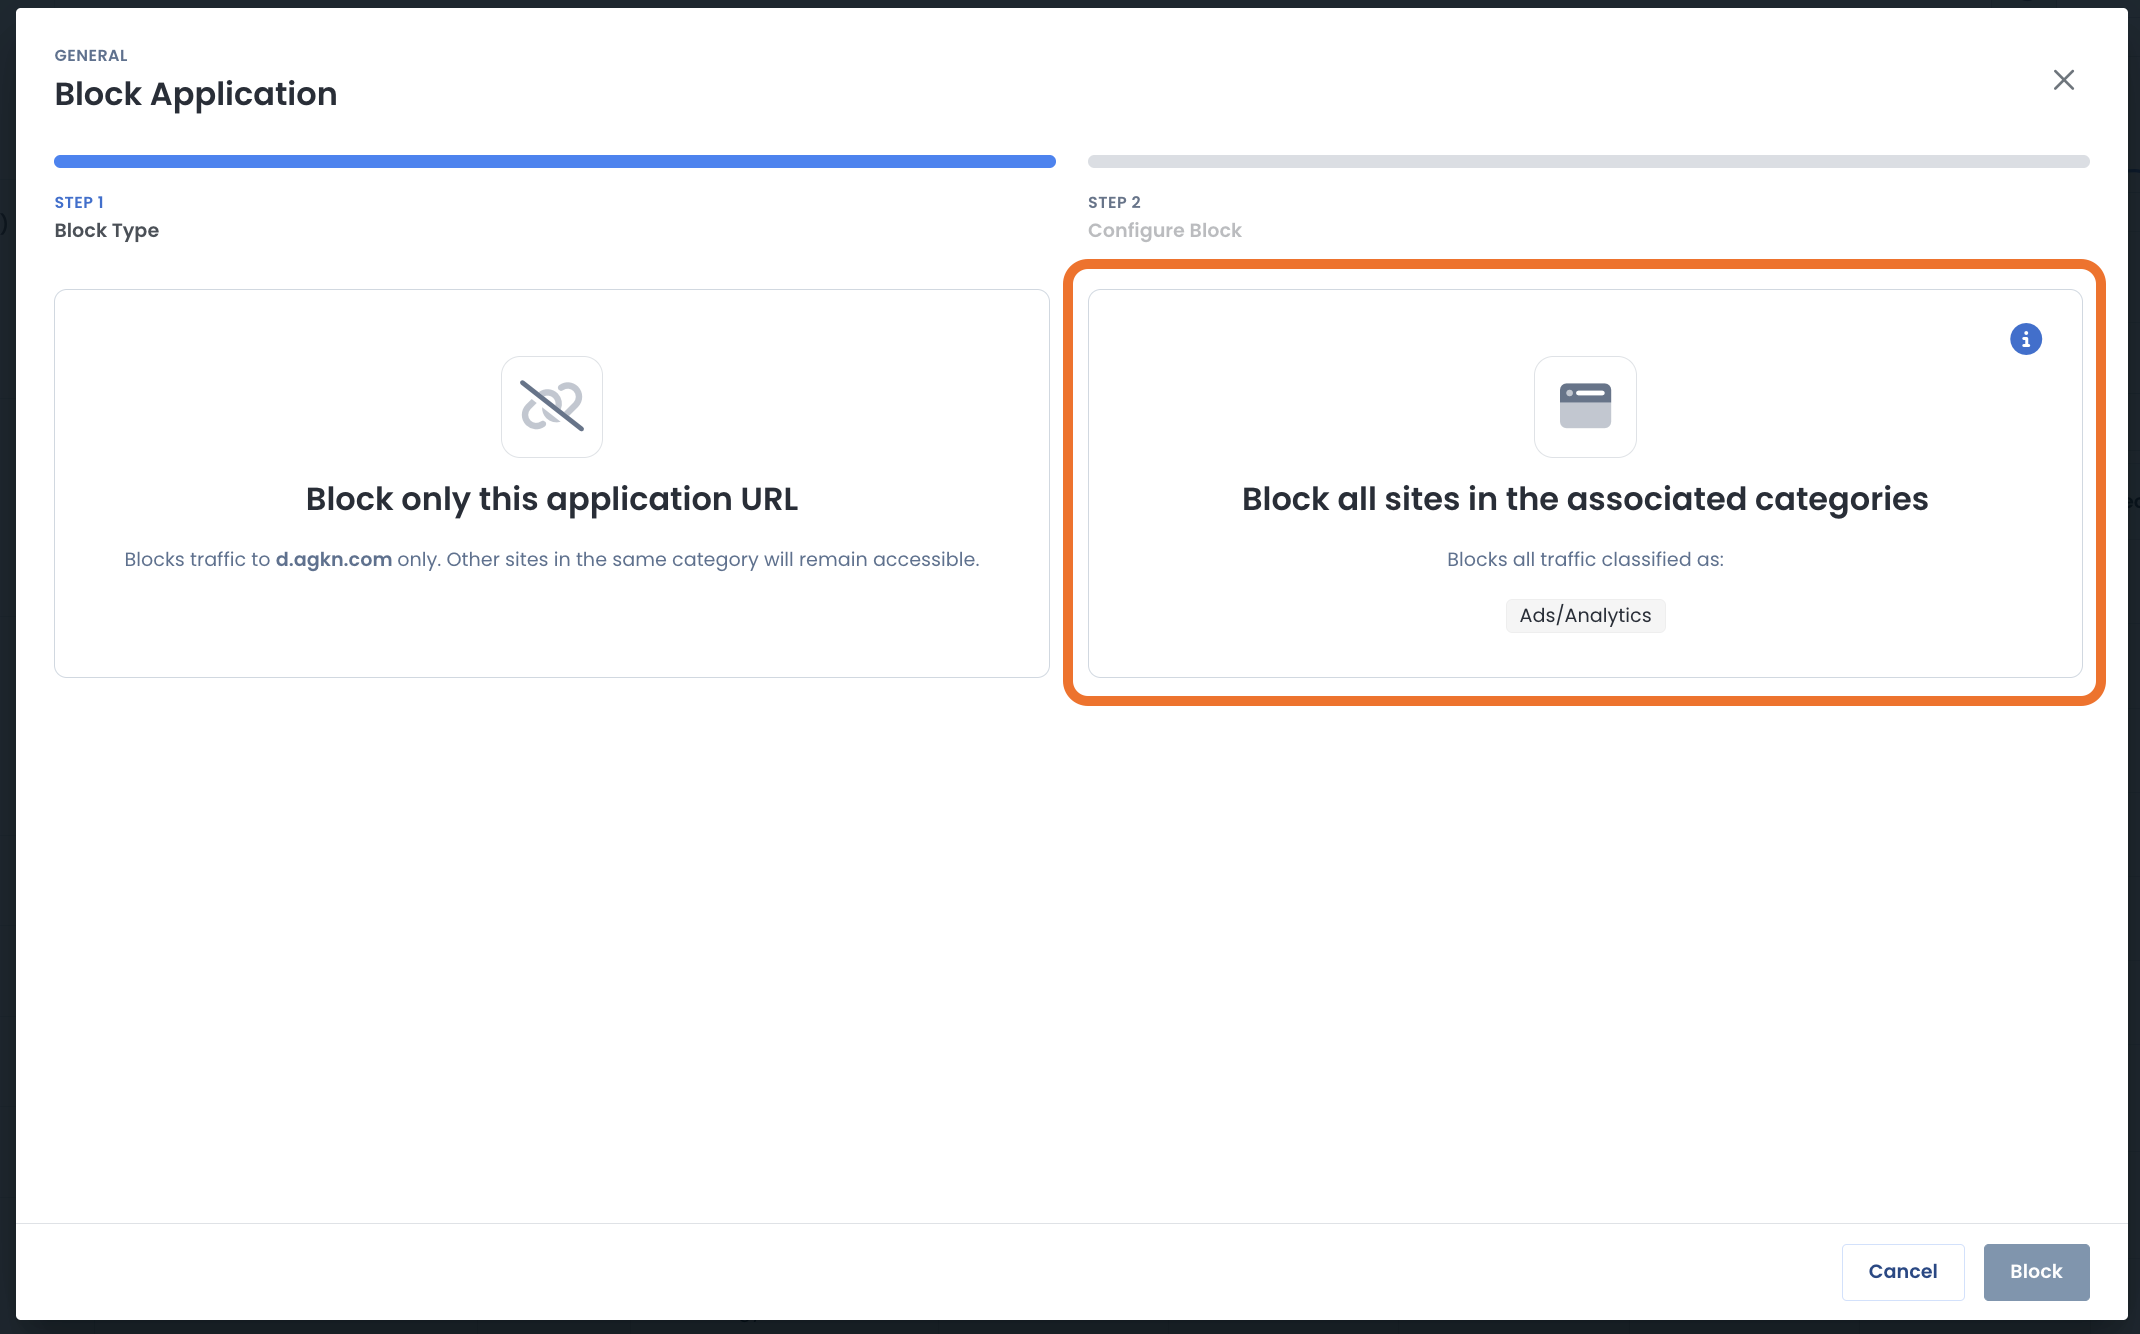
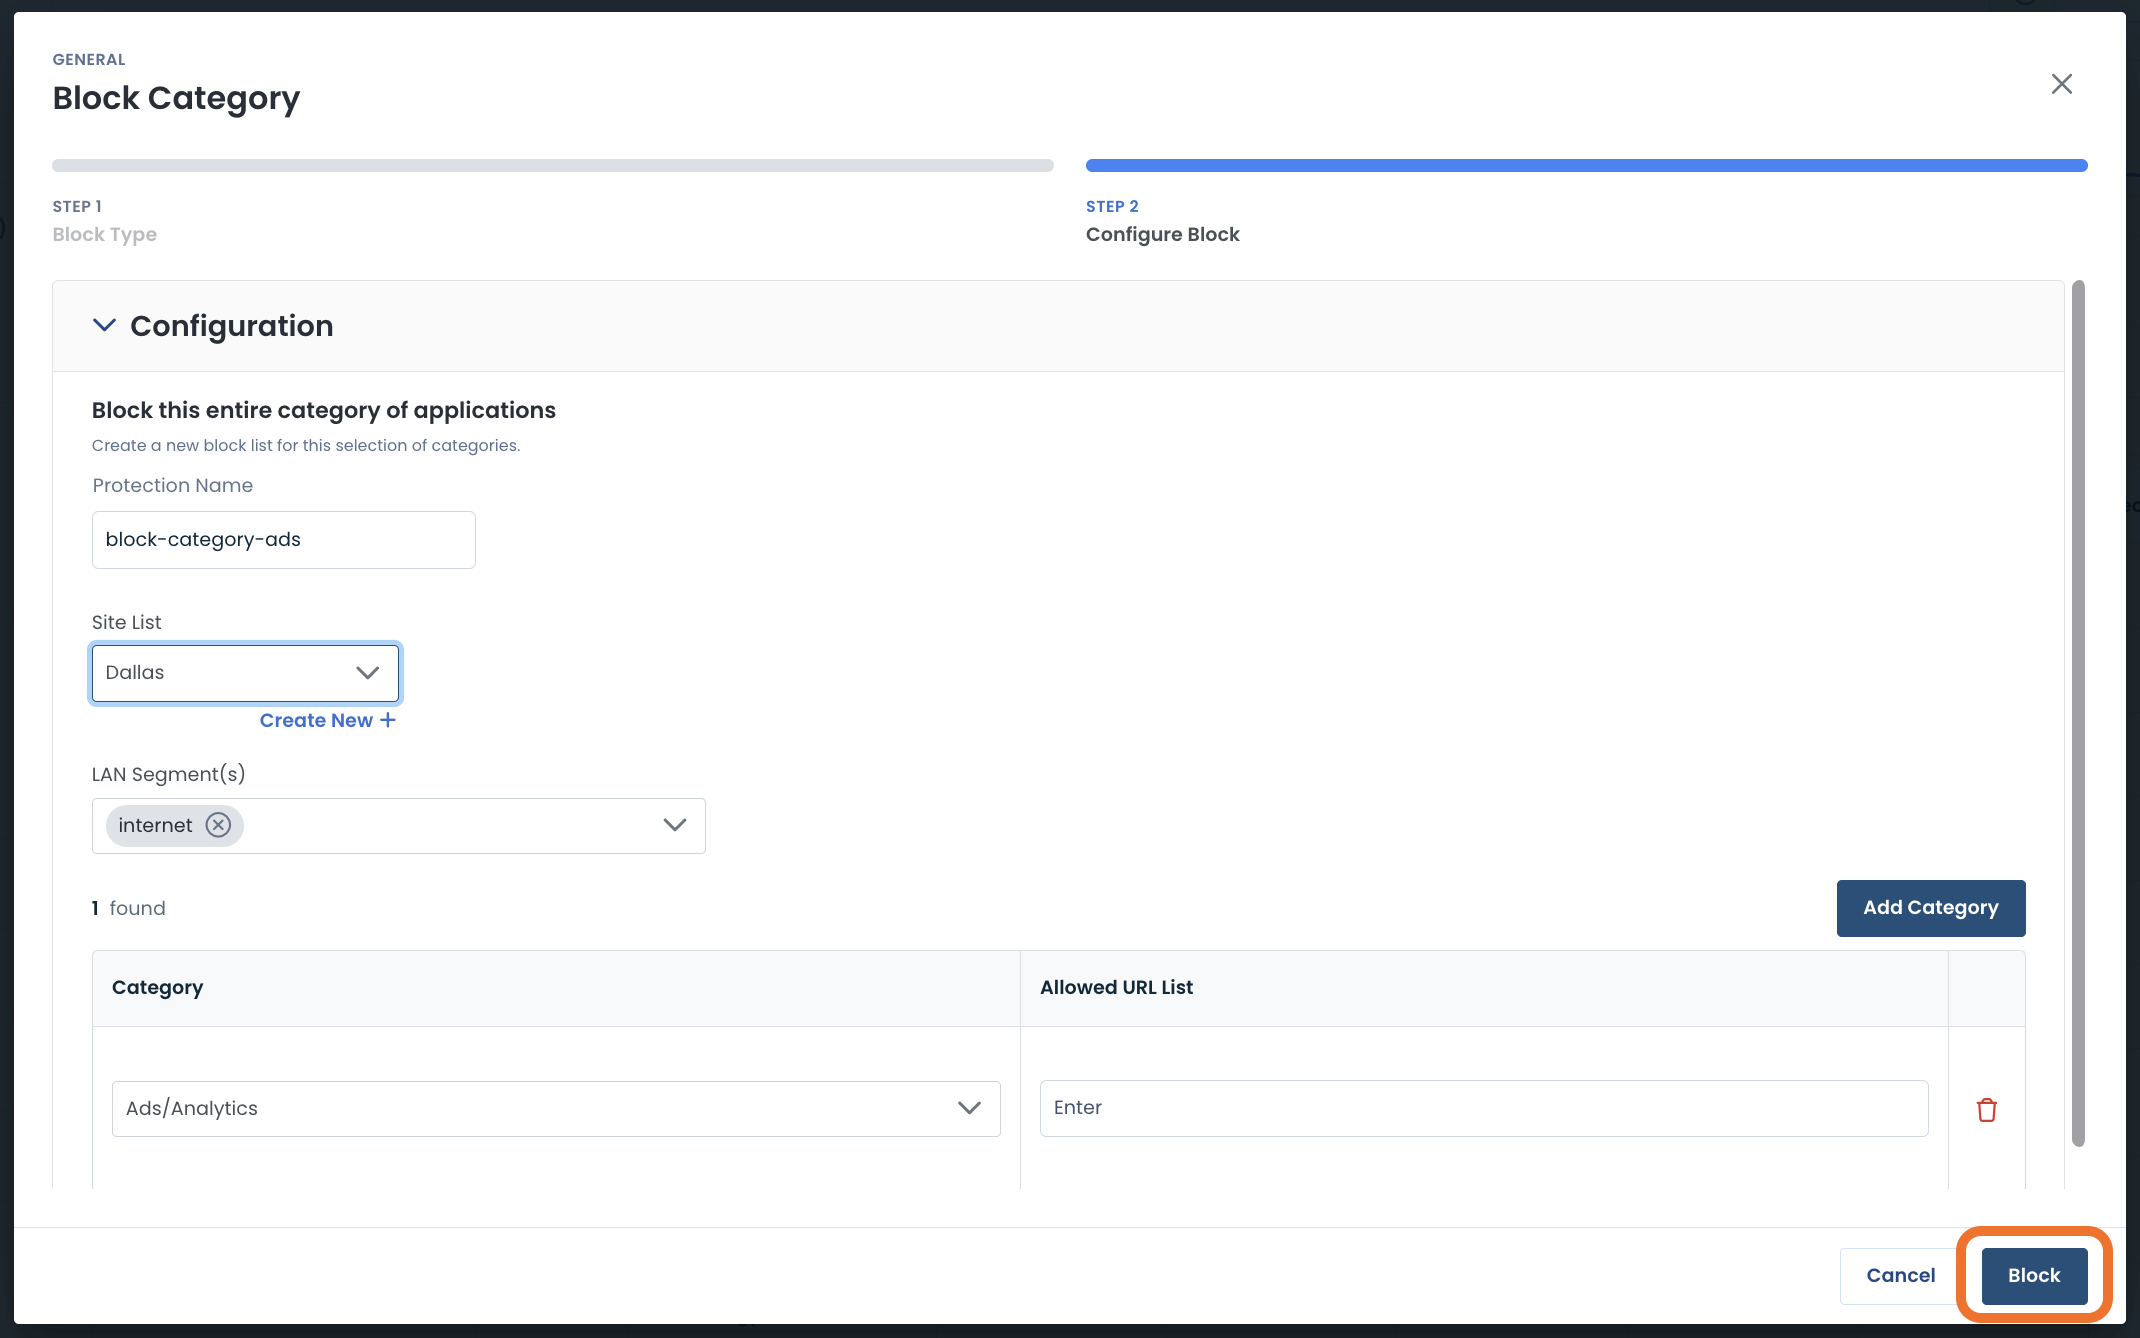
Complete the following fields and click ‘Block’ when you finished.
Protection Name: Type in the name of the new policy that you are creating
Site List: From the drop-down, select the Site List that will be using this policy
For more information on Site Lists, click here.
LAN Segment(s): From the drop-down, select the LAN Segment(s) that will be using this policy
Category: Category is populated
Allowed URL List: If you have URLs you would like to allow through as an exception to the list, enter them here.
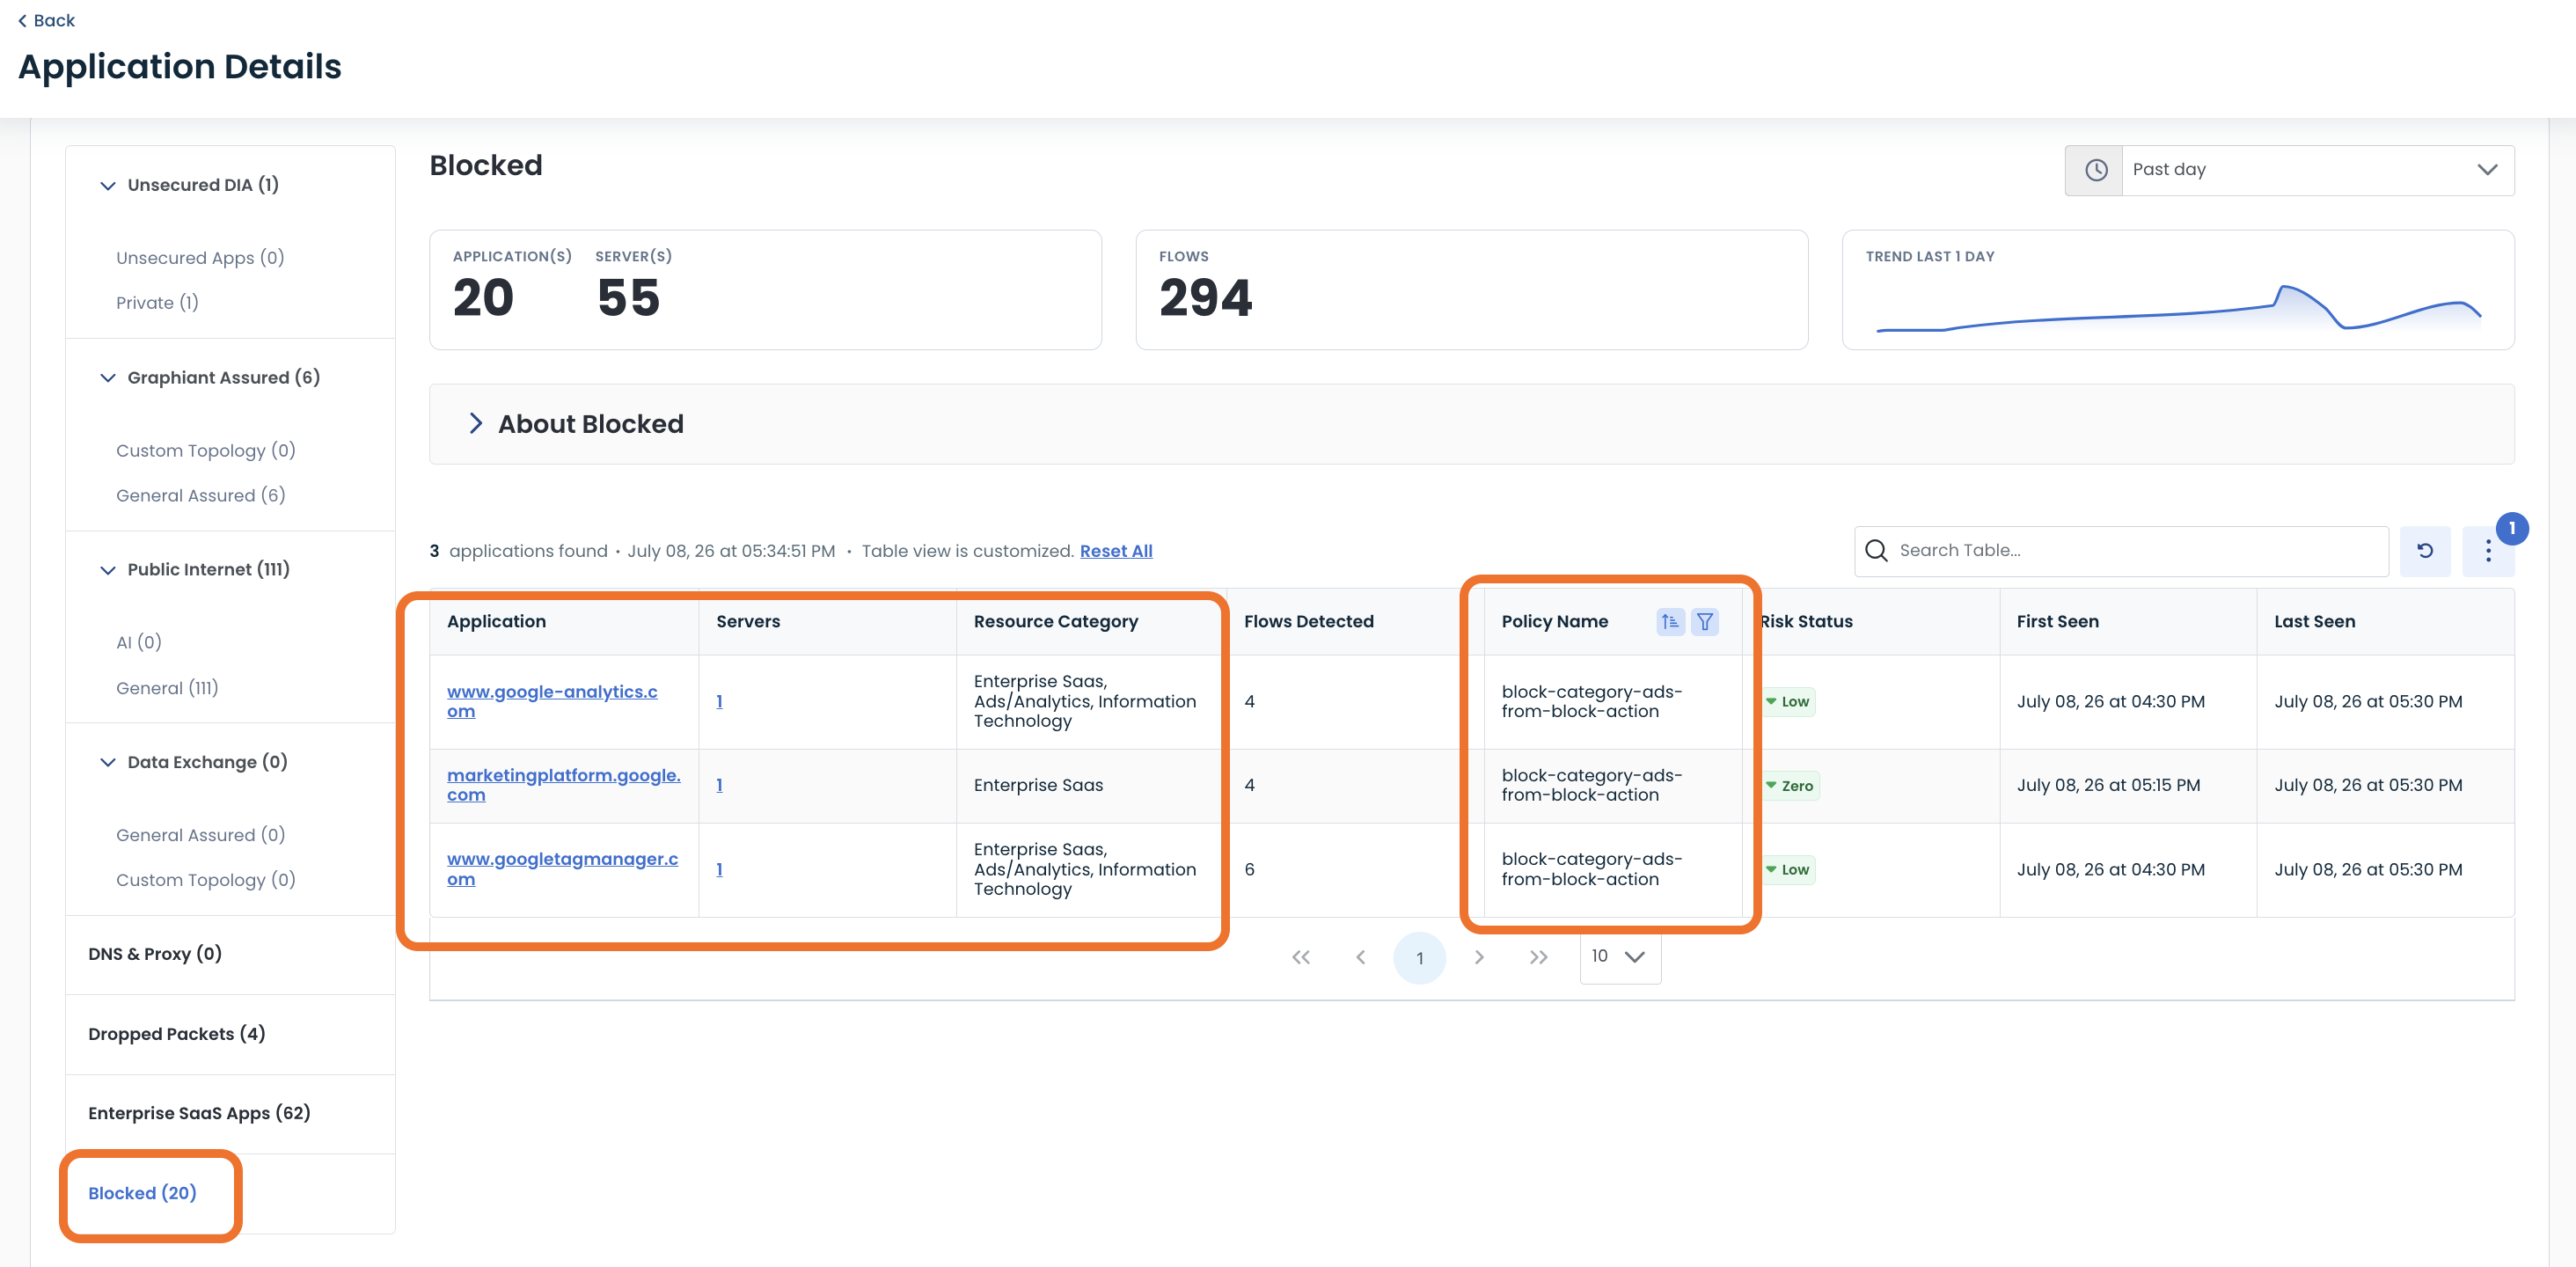
These apps will now appear in the Blocked Applications table.
Topology of Applications in Data Assurance
Assurance of your Data in Motion needs to be backed with Real-Time Visibility, as well as a forensic look back.
Graphiant's Data Assurance allows you to select the Application Data of interest, and shows you the paths that data traversed over the Graphiant Backbone at that given point in time.
Locating the Topology Map in Data Assurance
You can find topology information by either directly from the Data Assurance Dashboard, or for a specific app from the Applications Detail Table:
1). From the Data Assurance Dashboard
Click the 'Topology' Tab at the top of the page.
.png)
This will open the topology map.
From here you will be able to see the paths that the data is taking in your network.
The landing profile for the topology map is the General Assured bucket.
.png)
Simply select an application from the drop-down to view its topology.
.png)
2). From the Application Details Table
Click the 'Topology' icon to the right of the application of which you wish to see the data paths within your network.
This will open the topology map focused on all paths that that specific application has taken, from present time and going back anywhere from the past 15 min to a month, or even a custom time frame of your choosing.
.png)
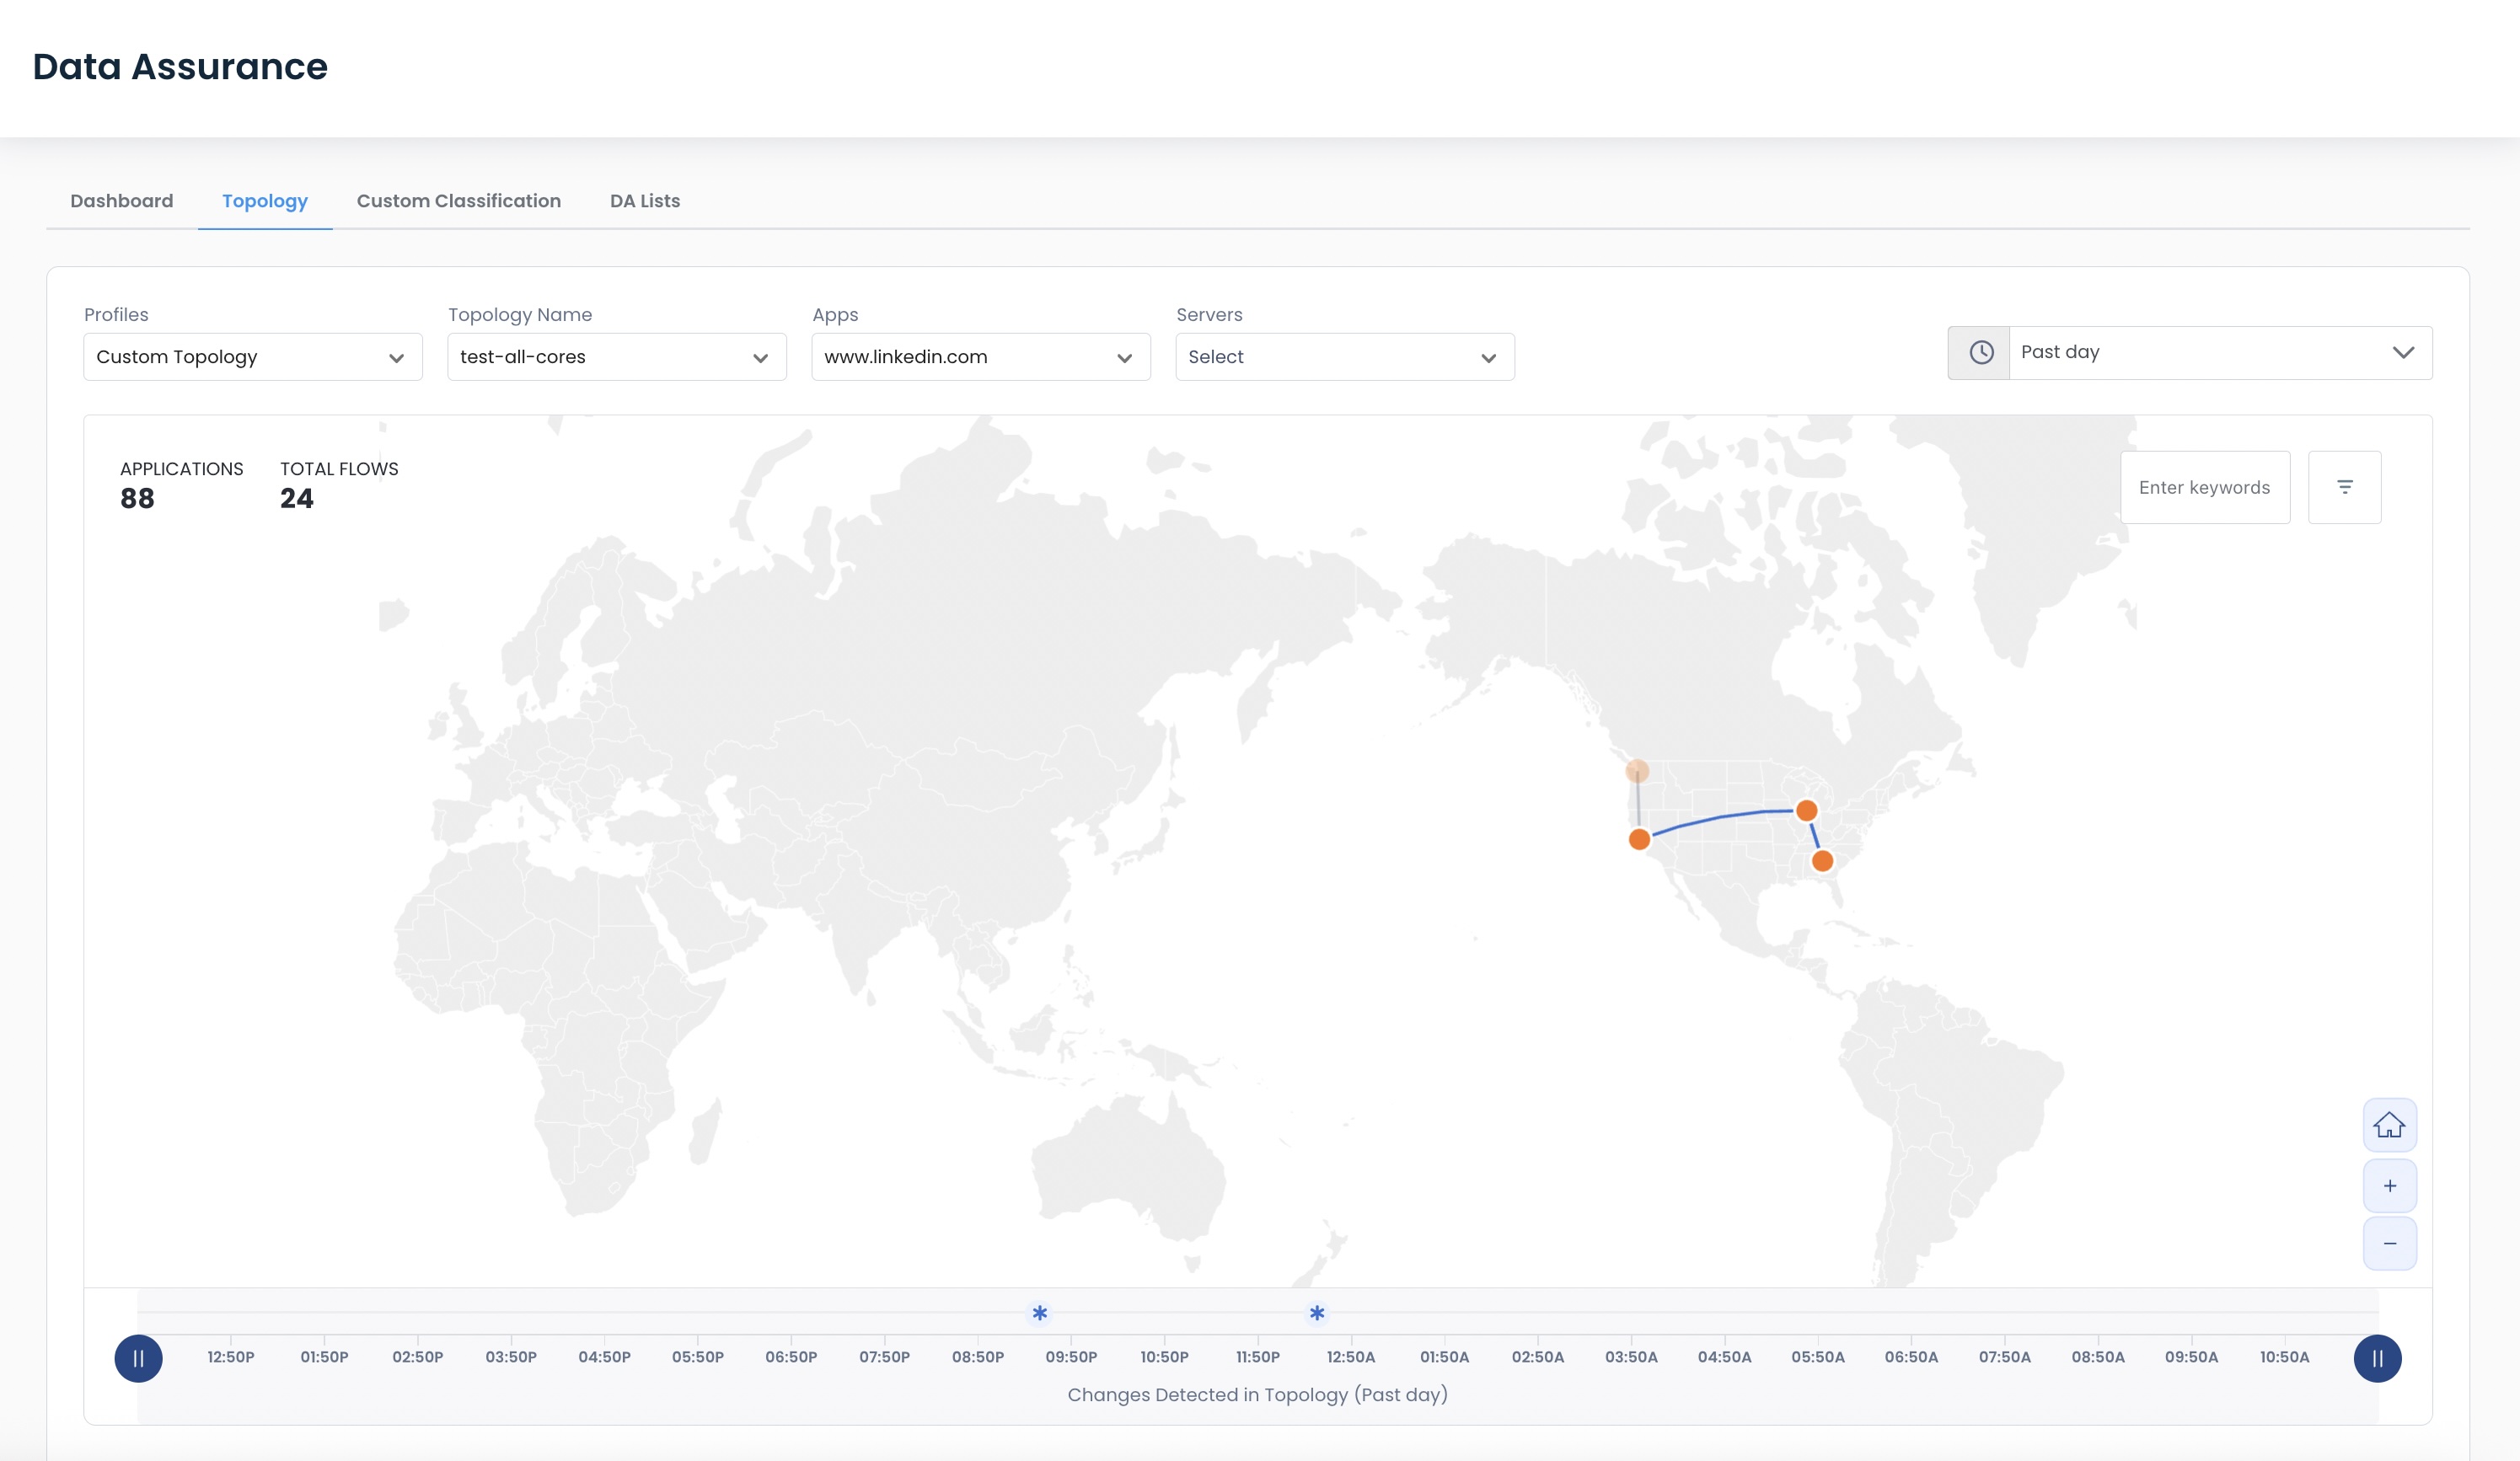
Navigating the Topology Map
The Data Assurance Topography Map is dynamic and will pull the location information in any way you need.
The Topology Map is laid out in five sections:
Profile / Application / Server Selection and Time Picker: Information selected here will determine the information shown on the entirety of the page.
Filters: The selections made here will narrow down the information shown to drill down even further to exactly what you are most interested in.
Topology Map: This visual shows the pathways, regions, and sites through which the data is traveling through your network.
Topology Slider: These endpoints are movable so that you can visualize the differences in the topology changes, denoted by the stars in the timeline.
Application Flows Table: This table shows which of your locations and LAN segments utilized the application selected, and for how many sessions.
.png)
The Topology map will give all information about the topology of your Graphiant Assured data starting at the present time, and going back anywhere from the past 15 min up to a month, or even a custom time frame of your choosing.
You are able to drill down as far as you'd like, to see as detailed of information as you need.
You can select the profile / bucket that you are interested in.
Within that bucket, you can choose the application whose data you want to see.
And within that application, you can choose to further drill down to see the topology of any particular server that used the app.
Custom Topology will also include:
A filter to select per Topology Name.
.png)
Note:
Gray lines denote possible paths, while blue lines denote paths that the application traveled.
The map will also show the following in the upper left:
Applications: Total number of applications discovered in this profile
Total Flows: Total number of sessions for the application
Note:
“Total Flows” will only be populated if an application is selected.
You are also able to filter additionally by:
Regions
Client Sites
Server Sites
You can either select an item in the drop-downs, or search by a keyword to easily locate the item within the drop-down.
.png)
This will drill down even further to show more specific topologies that include the asset(s) chosen.
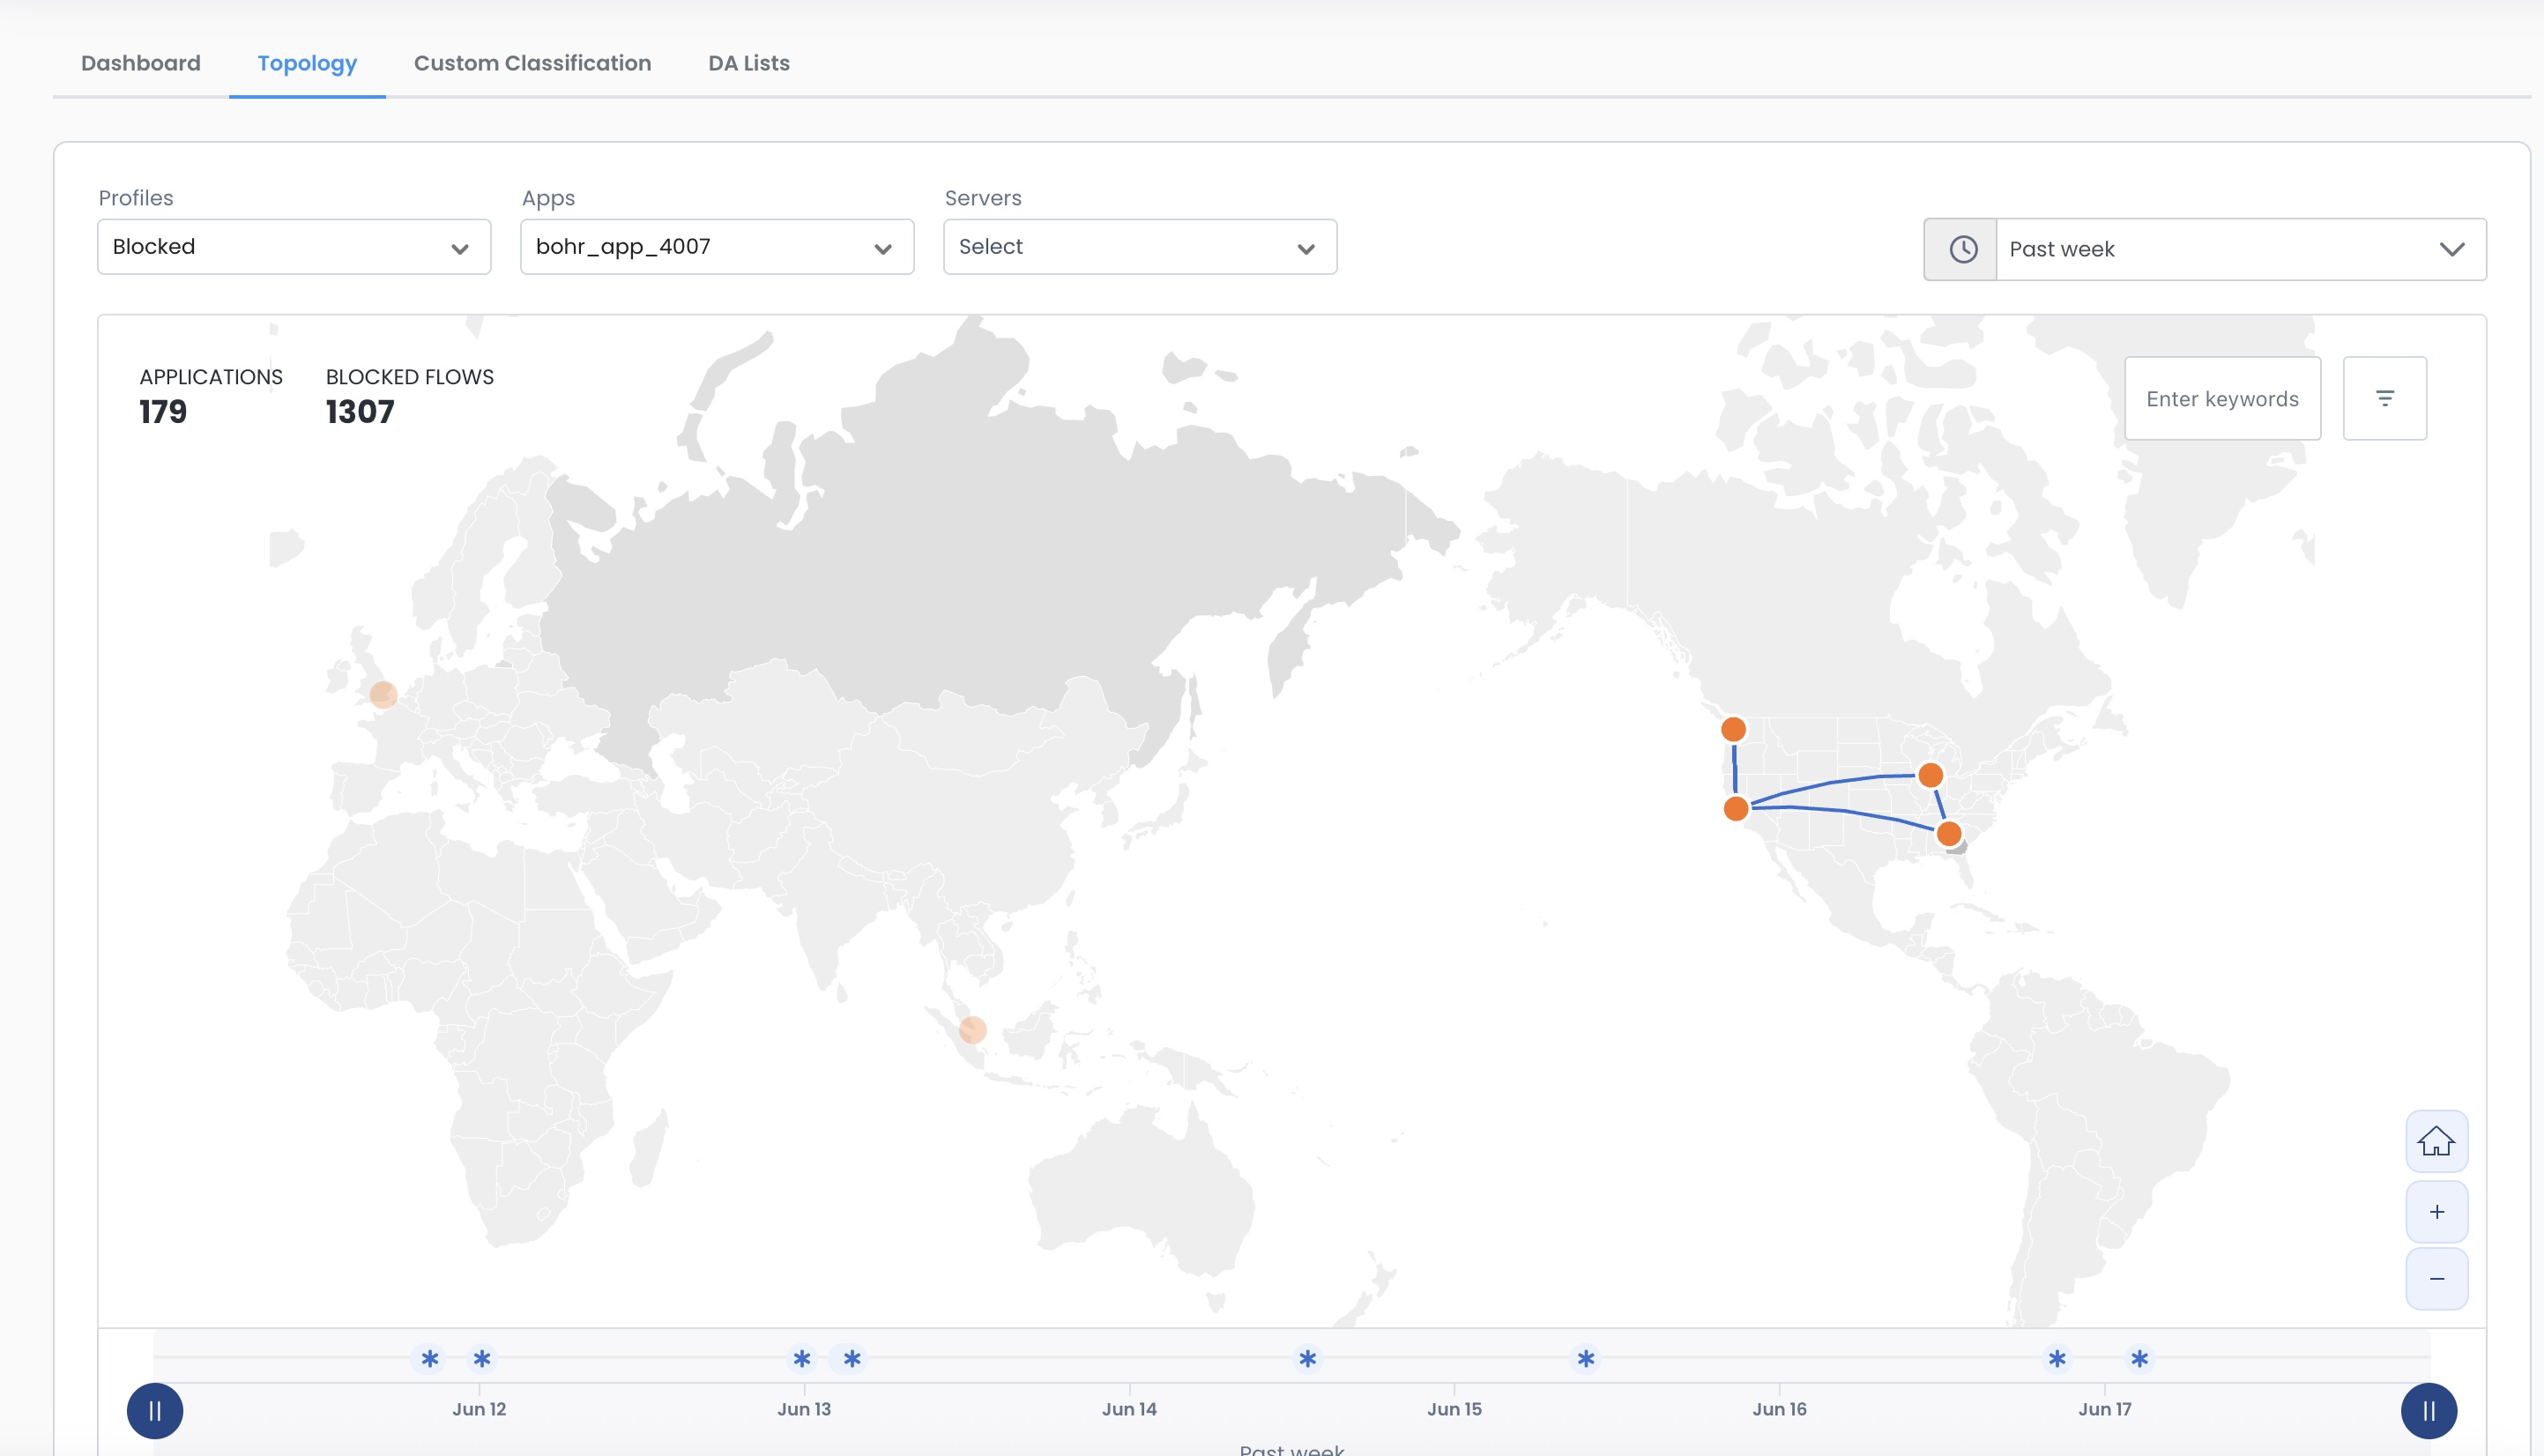
Should you need to fluidly see the topology changes that have occurred, the Slider tool below the map allows you to quickly manipulate the timeframe of the data, to see where the topology may have changed within the selected window of the time picker.
Notice that the slider originates at both ends of the time window; the topology map is at first reflecting all paths and PoPs utilized within that window.
.png)
Adjusting the slider will narrow down the topology to only those paths and PoPs utilized during the specified time.
.png)
Topology Map Information per Profile
The Data Assurance Topology Map will show different aspects of your data topology, depending on the type of profile selected.
You may utilize any of the dynamic aspects of of the map described above in all of the profiles.
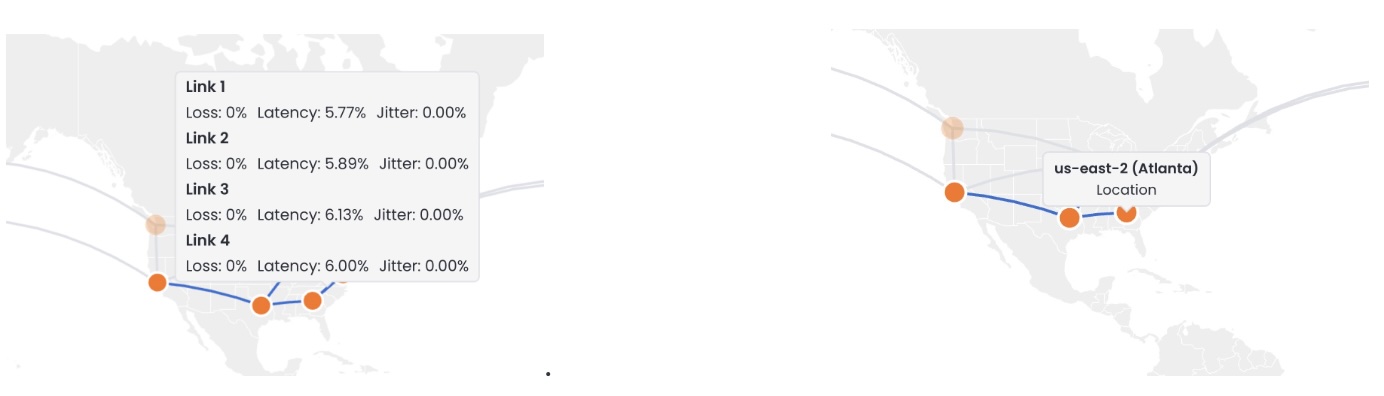
Pathway Topology for Graphiant General Assured Applications
The Topology map will show the paths the applications took to reach your devices.
.png)
Hovering over a path will show its loss, latency, and jitter values; hovering over a location will show the Graphiant PoP through which the data is traveling.
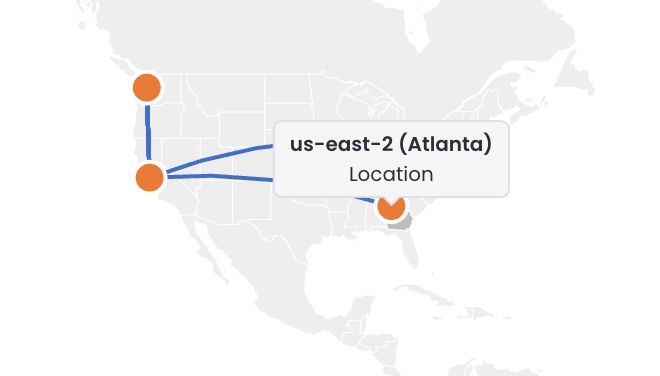
Pathway and Region Topology for General Public Applications
The Topology map will show the paths the applications took to reach your devices, along with the regions they are located within.
.png)
Hovering over a path will show its loss, latency, and jitter values; hovering over a location will show the Graphiant PoP through which the data is traveling; hovering over a region will show the name of the region along with the number of sites consuming the app.
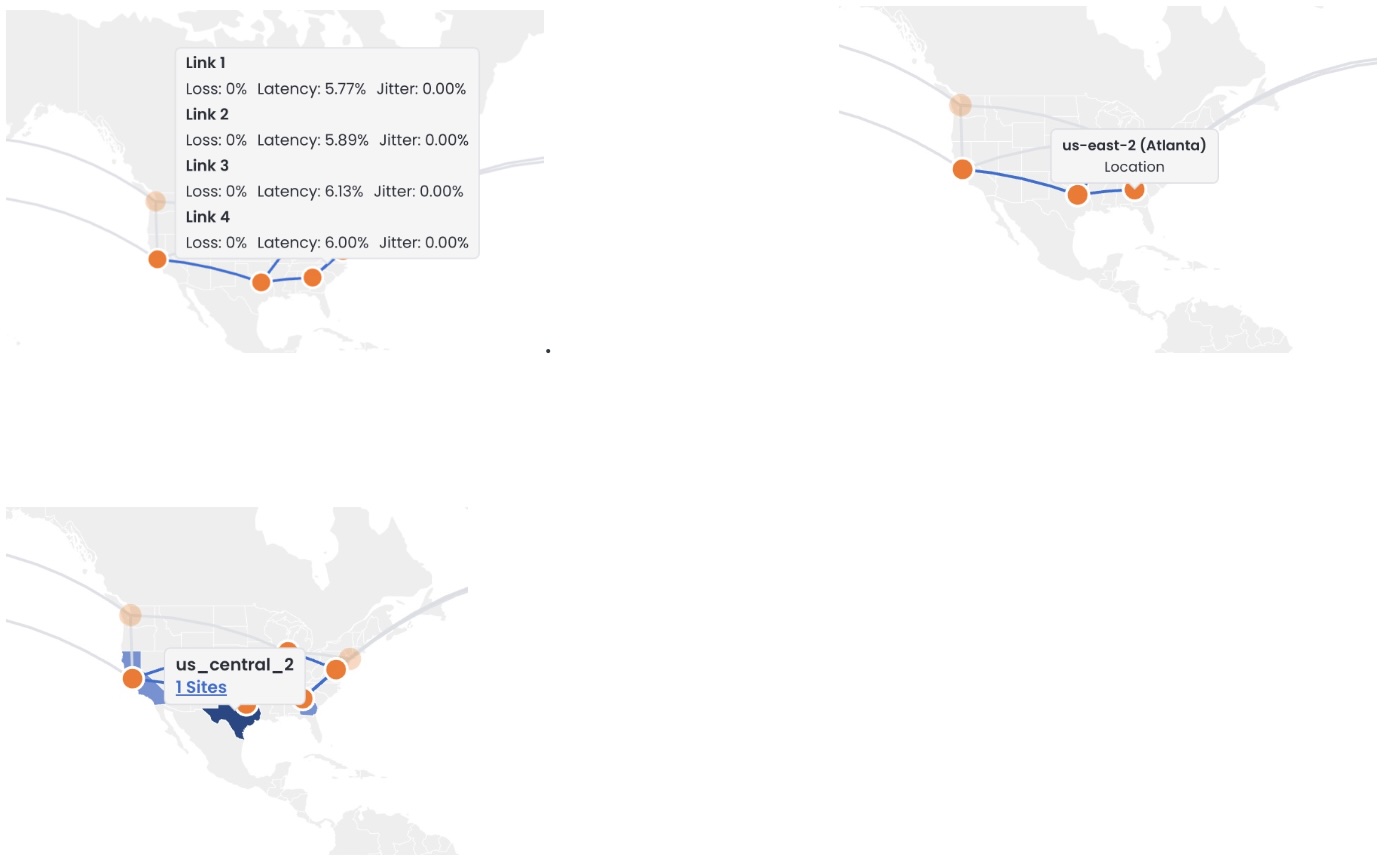
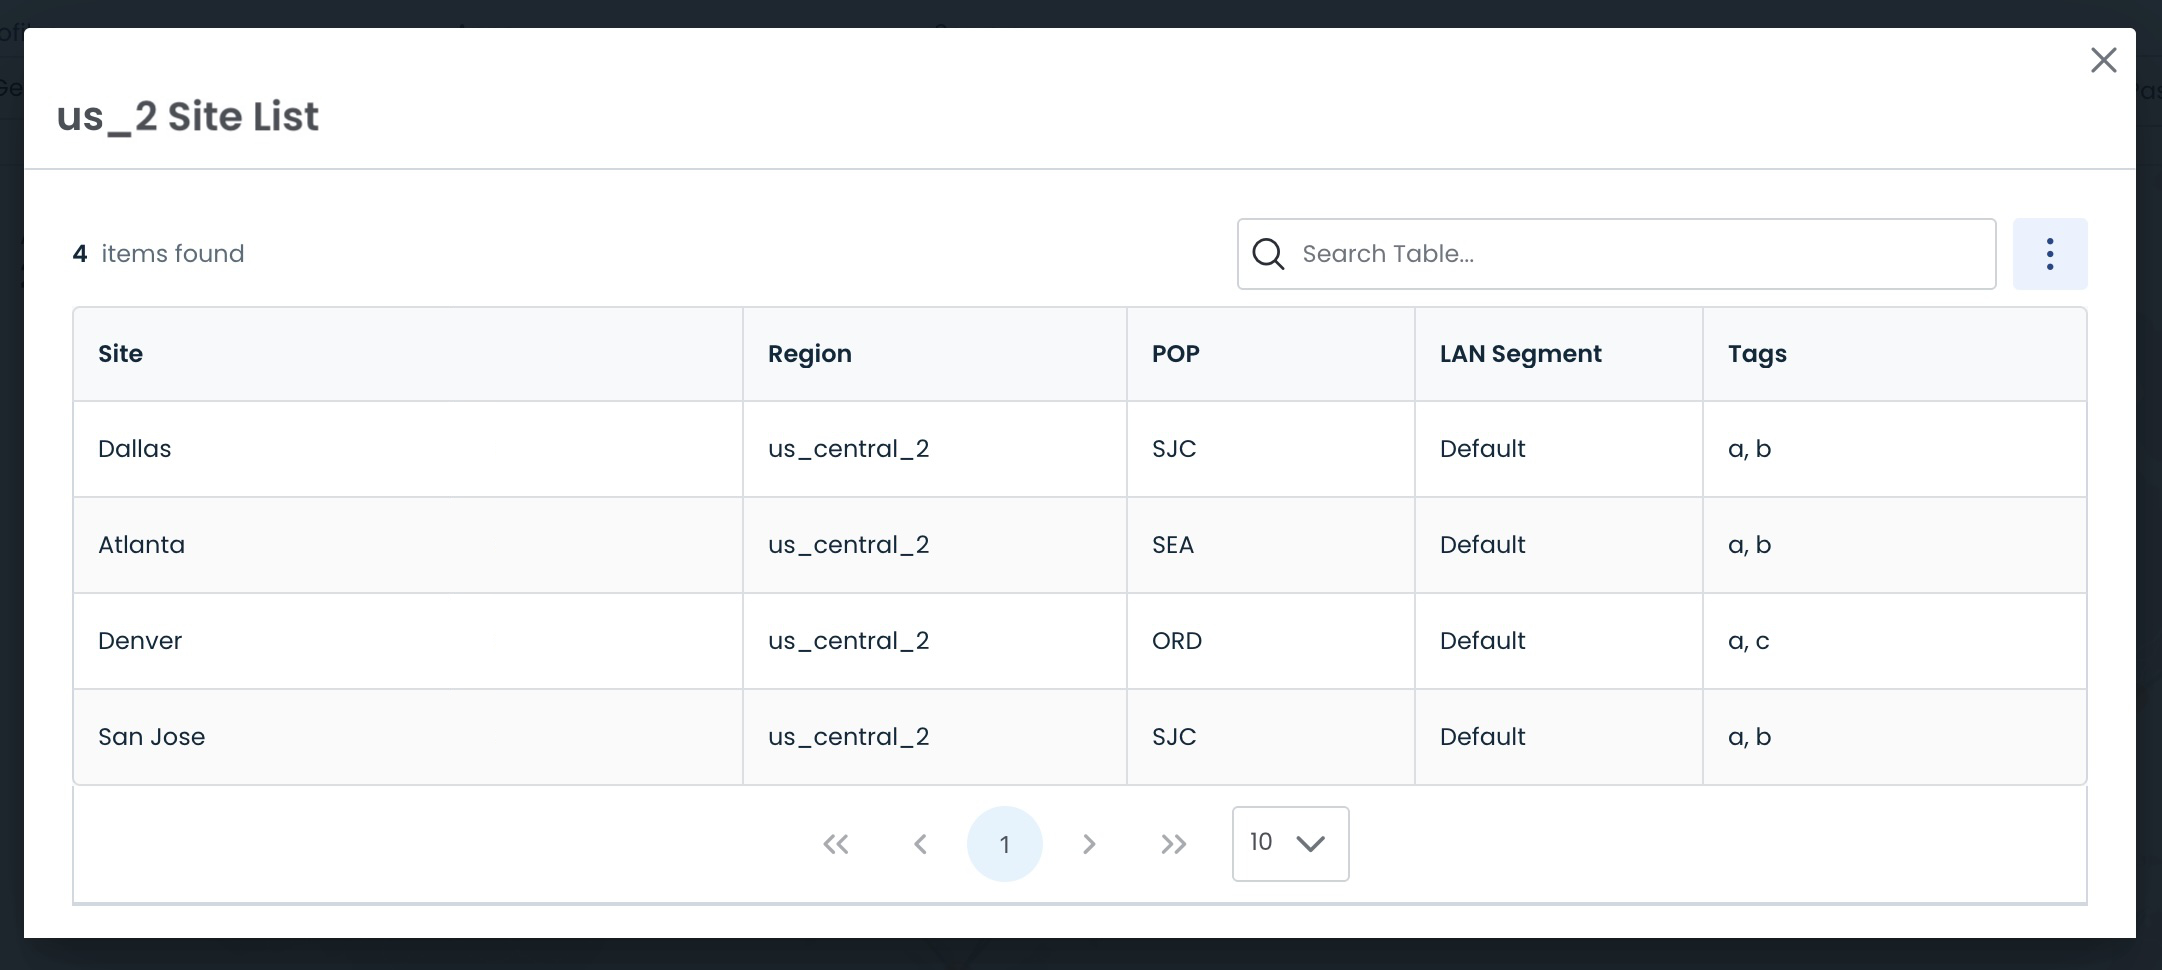
Clicking on the number of sites will open a table with the following information:
Site: Name of the site consuming the app
Region: Location where the devices are located
POP: Graphiant PoP to which the edges are connected
LAN Segment: LAN segment the app is traveling over
Tags: Any tag that is applied to an edge that is consuming the app within the site
.jpg)
Pathway and Region Topology for Enterprise SaaS Applications
The Topology map will show the paths the applications took to reach your devices, along with the regions they are located within.
.png)
Hovering over a path will show its loss, latency, and jitter values; hovering over a location will show the Graphiant PoP through which the data is traveling; hovering over a region will show the name of the region along with the number of sites consuming the app.
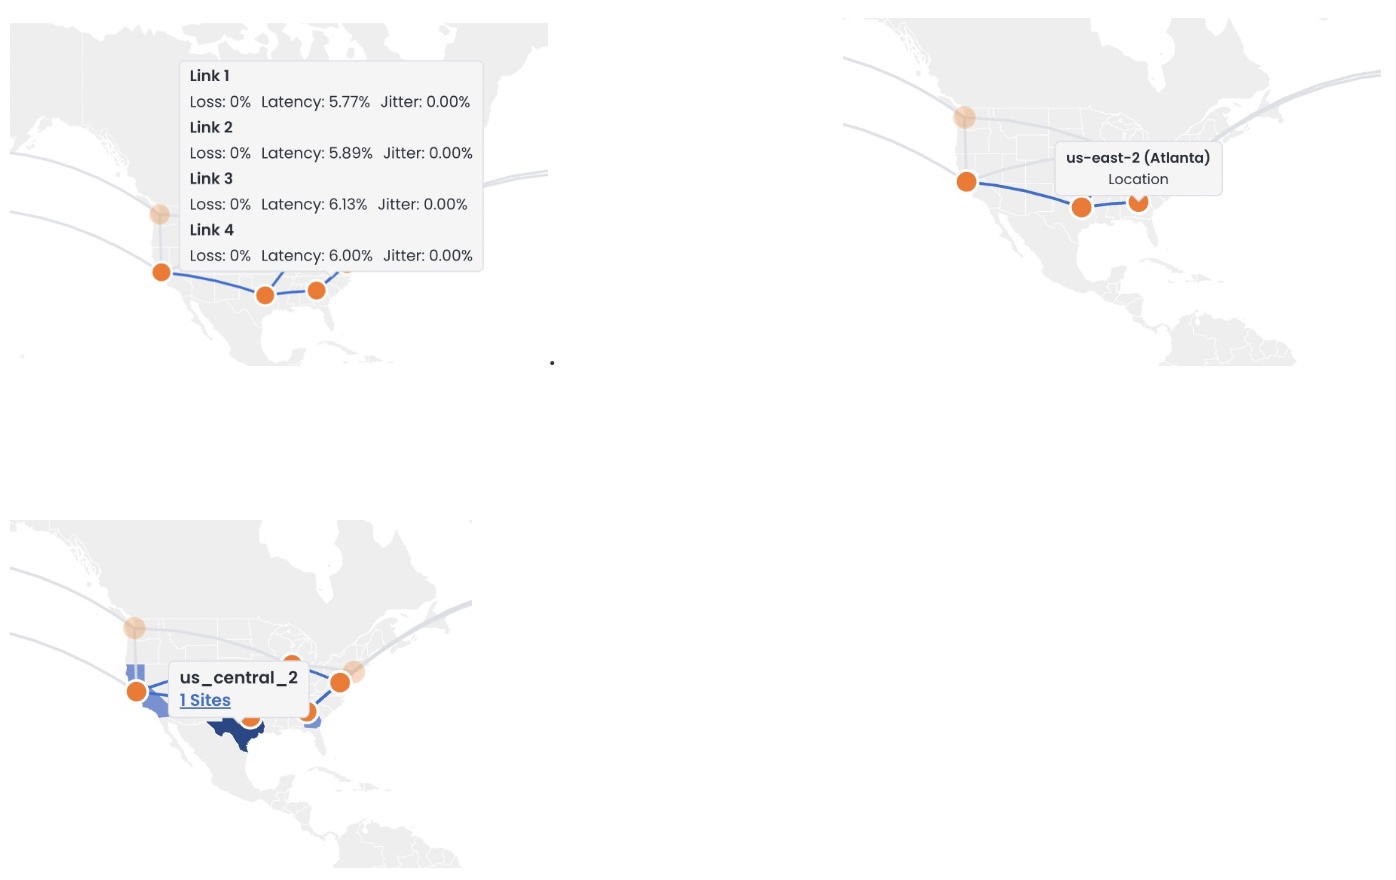
Clicking on the number of sites will open a table with the following information:
Site: Name of the site consuming the app
Region: Location where the devices are located
POP: Graphiant PoP to which the edges are connected
LAN Segment: LAN segment the app is traveling over
Tags: Any tag that is applied to to an edge that is consuming the app within the site
Pathway Topology for AI Applications
The Topology map will show the paths the applications took to reach your devices.
.png)
Hovering over a path will show its loss, latency, and jitter values; hovering over a location will show the Graphiant PoP through which the data is traveling.
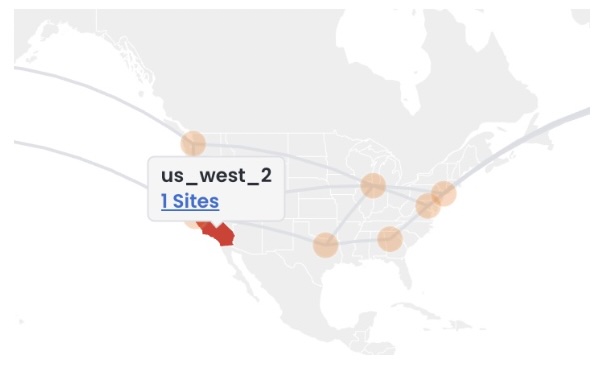
Region Topology for Private Applications
The Topology map will show the regions where the applications are being consumed.
.png)
Hovering over a region will show the name of the region along with the number of sites consuming the app.
Clicking on the number of sites will open a table with the following information:
Site: Name of the site consuming the app
Region: Location where the devices are located
POP: Graphiant PoP to which the edges are connected
LAN Segment: LAN segment the app is traveling over
Tags: Any tag that is applied to to an edge that is consuming the app within the site
Pathway Topology for Unsecure Applications
The Topology map will show the paths the applications took to reach your devices.
Hovering over a path will show its loss, latency, and jitter values; hovering over a location will show the Graphiant PoP through which the data is traveling.
Pathway Topology for Unsecure Applications
The Topology map will show the paths the applications took to reach your devices.
.png)
Hovering over a path will show its loss, latency, and jitter values; hovering over a location will show the Graphiant PoP through which the data is traveling.
Pathway Topology for Blocked Applications
The Topology map will show any locations that encountered and blocked the applications.
Hovering over a location will show the Graphiant PoP at which the application was detected and blocked.
How Can I Find out Details About a Device in My Network That is Consuming a Particular Application?
If you would like to drill down and see the details of each session for device in your network that is consuming an application, start by pulling up the topology map for that application.
Click on the desired site in the table below the topology map.
.png)
A table will appear of all the IP addresses in your network that have consumed the application.
Select the IP address that you want to investigate.
.png)
This will bring up a list of every session from that device where it utilized the application.
If you click on a session:
.png)
You will see a summary of the details of the session, including:
Visual of the session path: Shows every step (zoom in / out / fit-to-screen ["home" button] will adjust the visual for ease of use):
Your network device IP address
The site within the network in which the device is located
Your local internet carrier at that site
The Graphiant PoP to which the request enters the Graphiant Core
The Graphiant PoP from which the request exits the Graphiant Core
The local internet carrier at the remote site
The site in the applications network in which the application is located
The application that was consumed
Client IP Information
Client Details
Server Details
.png)
Note:
Scroll down further to the bottom of the modal to see the Server Details.
.png)
Data Assurance Reports
Should you desire to have a downloaded report of the Data Assurance information, it can be generated right from the Graphiant Portal.
To access the report, click on 'Maintain' in the sidebar; select 'Reports' in the dropdown.
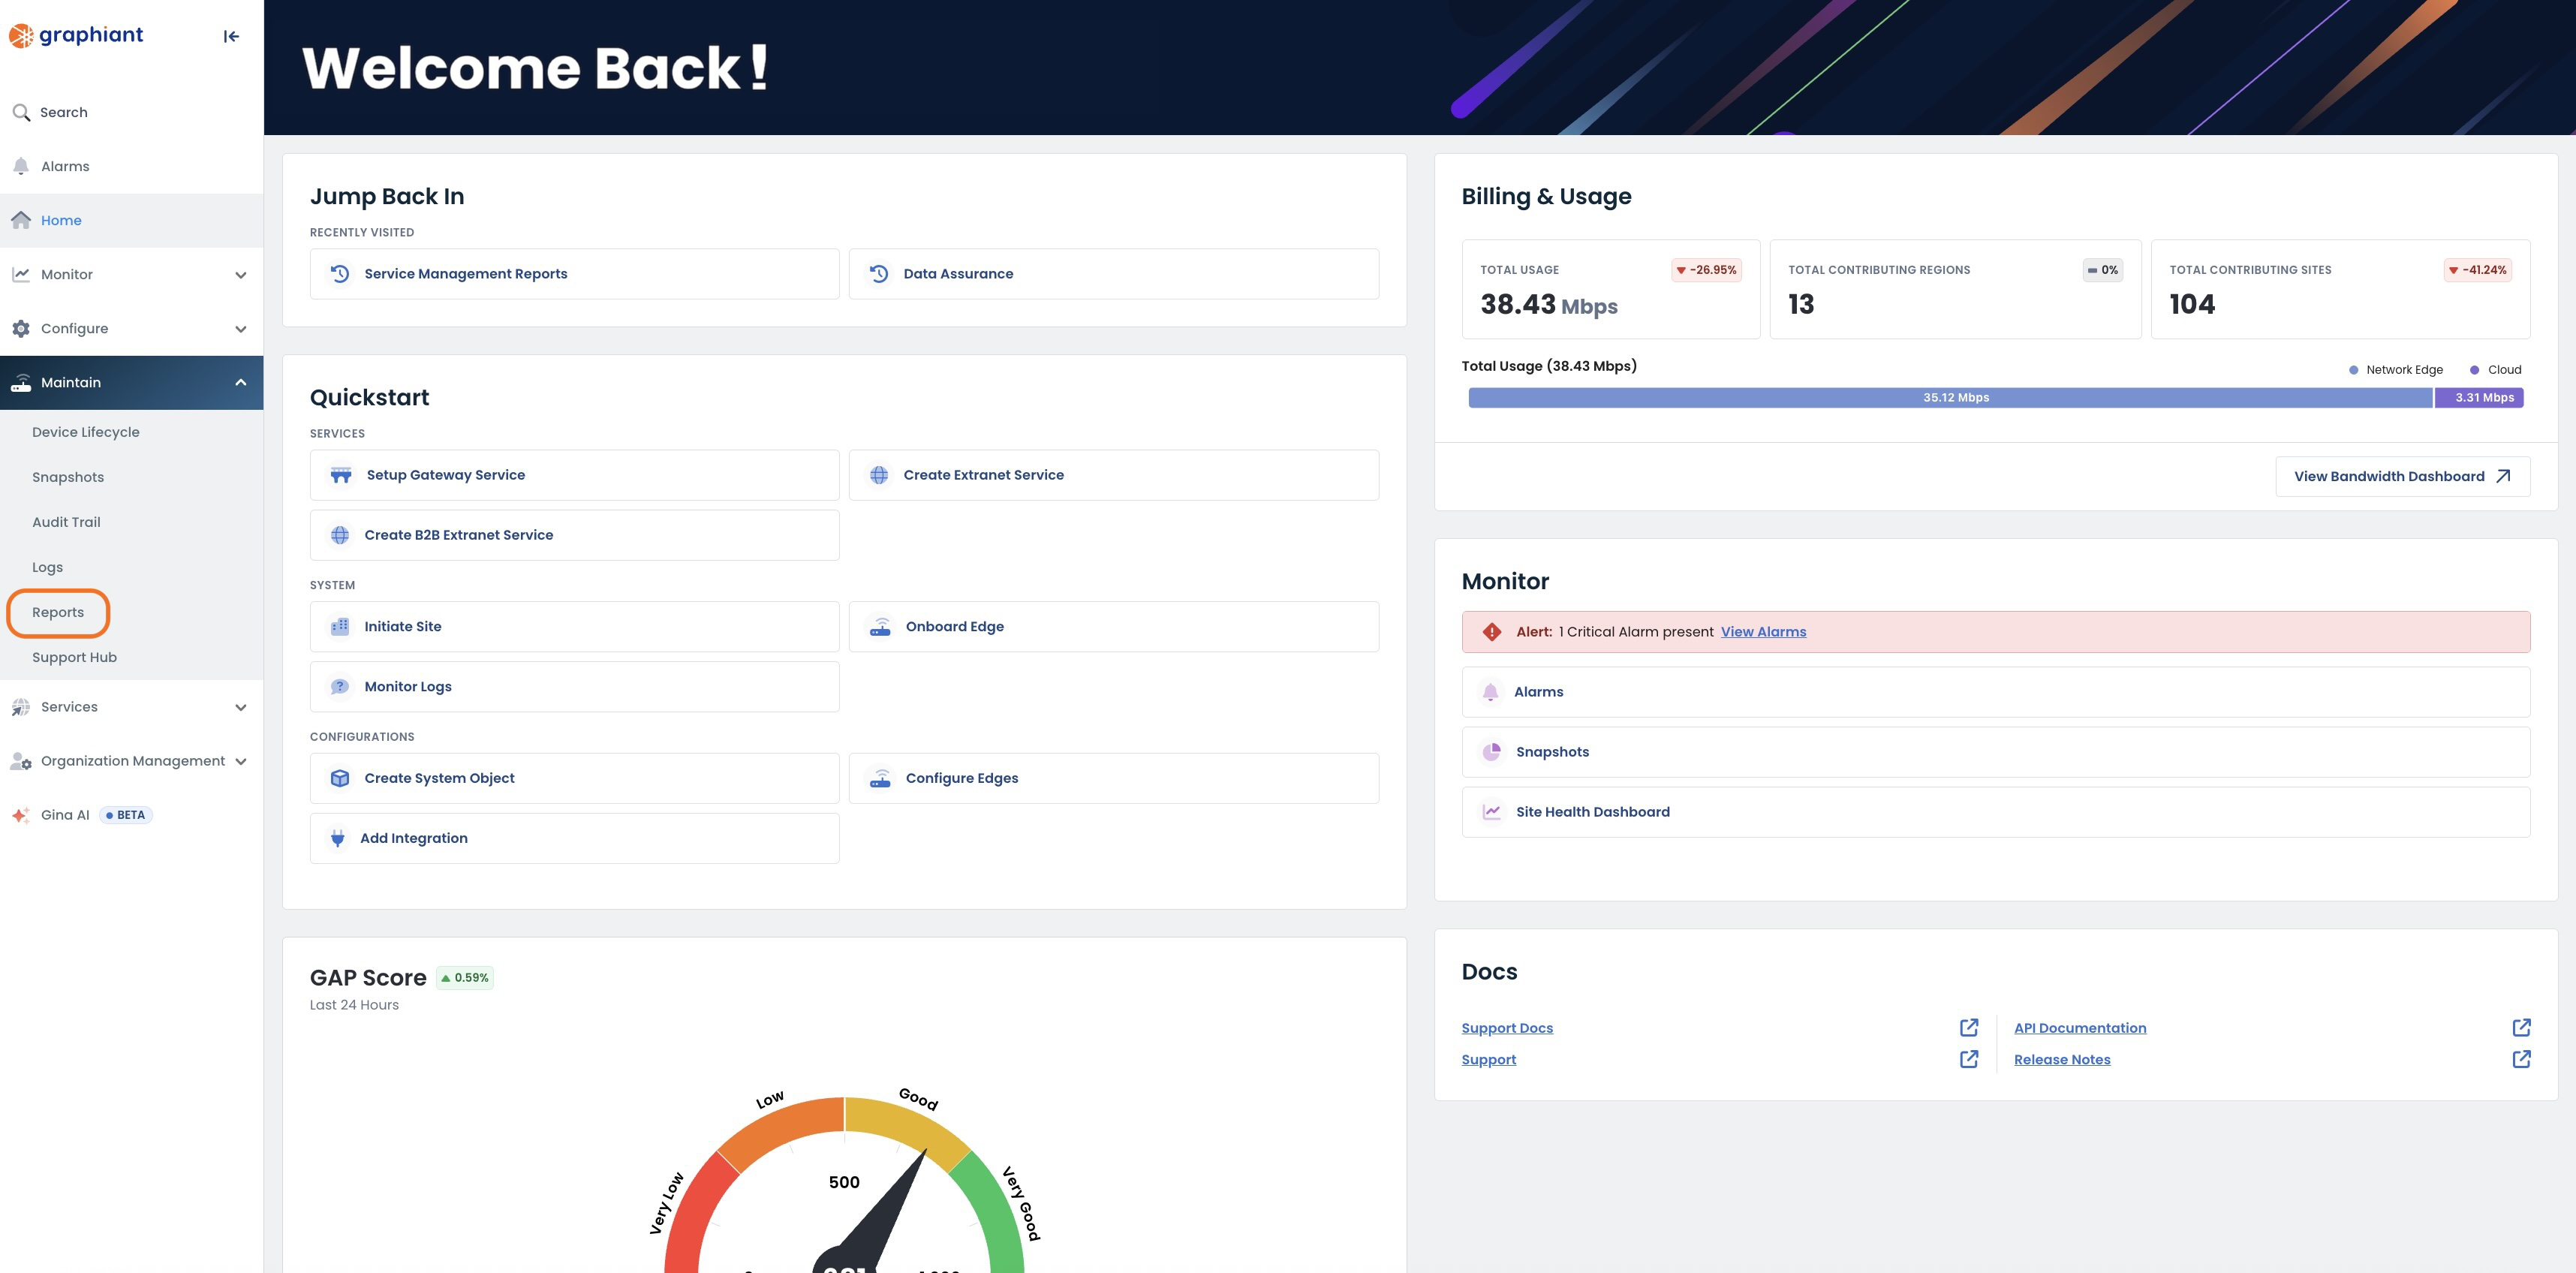
Click 'Generate Report'.
.png)
A modal will open for you to customize the report.
.png)
Fill out the following fields:
Select Report Type: (currently Data Assurance is the only report available)
Select Time Period: for which you would like the data collected
Email (optional): if you would like to receive a downloadable copy emailed to you
.png)
Click 'Generate'.
.png)
A green banner will appear letting you know that the creation of the report was successful.
The report will be listed in the "Previous Reports" table.
.png)
To download the report, click the 'Download' symbol to the right of the desired report.
.png)
'Confirm' that you want to download the report.
.png)
The report will consist of two pages:
Page 1:
GAP Score
Risk Matrix
Score Factors
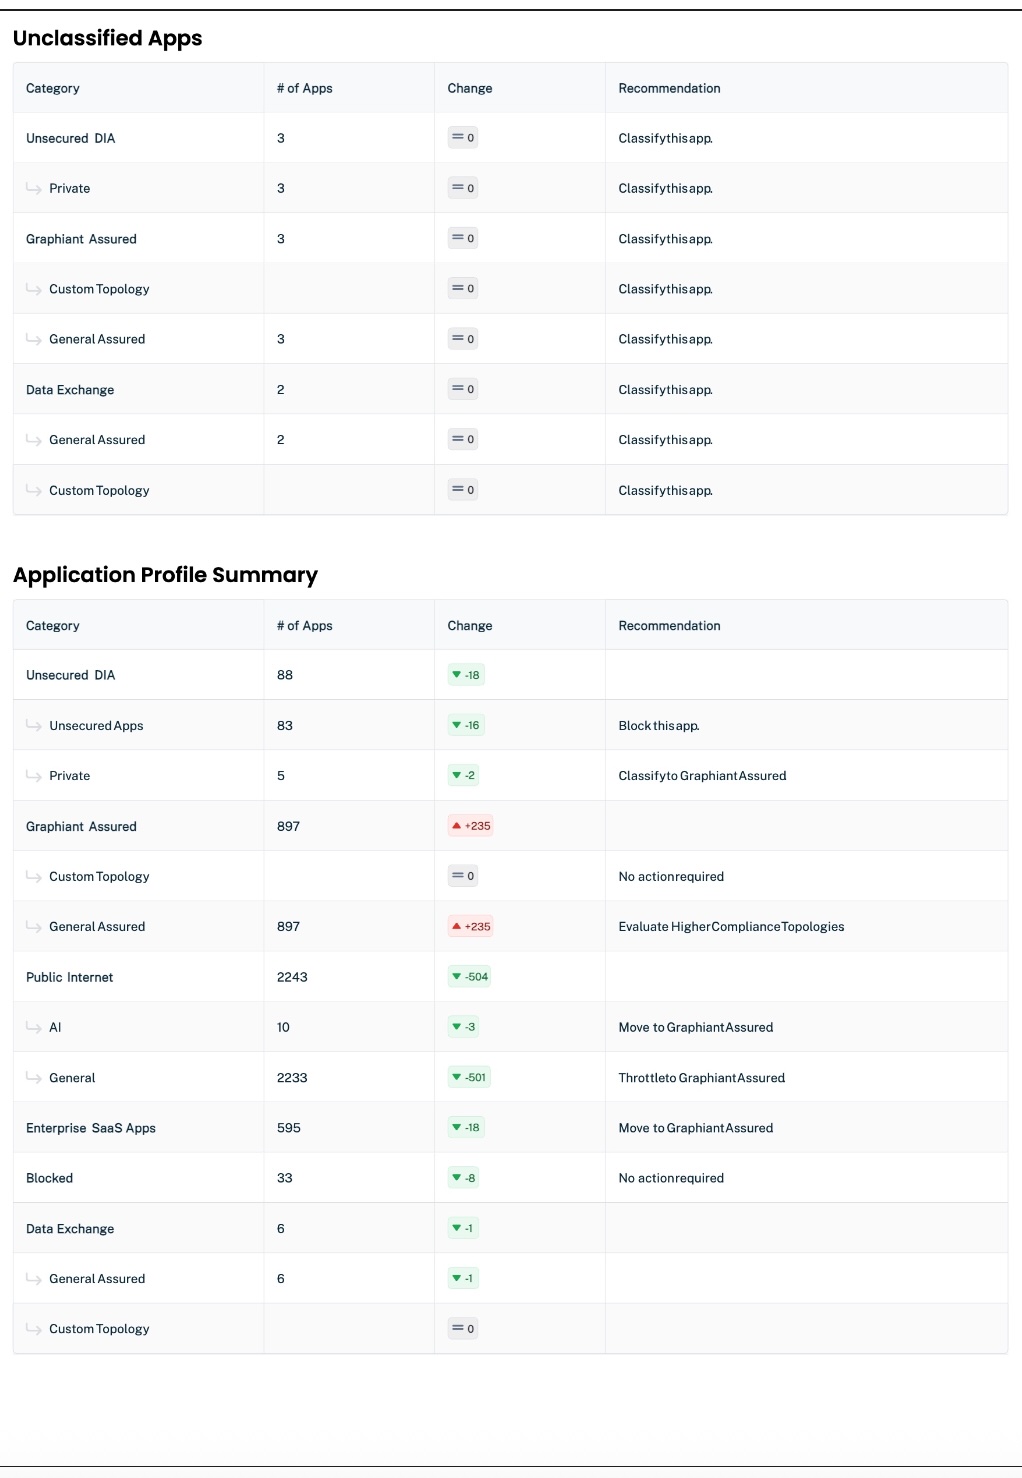
Page 2:
Unclassified Applications Table:
Tells you:
How many unclassified apps you have, and in what category
If the number has increased or decreased between the times selected for the report
Graphiant's recommendation for that app to secure your network.
Application Profile Summary Table:
Tells you:
Number of applications in each category
If the number has increased or decreased between the times selected for the report
Graphiant's recommendation for that app to secure your network.