As a Service Provider, you are able to see the topology of your network that your tenants are able to utilize.
Your data in motion is backed with Real-Time Visibility, as well as a forensic look back.
Graphiant's Topology shows you:
The paths that data traversed at any given point in time
The Cores your network are using
These are the PoP’s that are available for your tenants, and they will see this view of their traffic from their Data Assurance page within their Graphiant Portal.
You will only be able to see your network topology:
Each tenants’ topology is only visible to them directly.
Locating Your MSP Network Topology
To view your topology, from your Graphiant Portal Landing page, select ‘Topology’ from the sidebar.
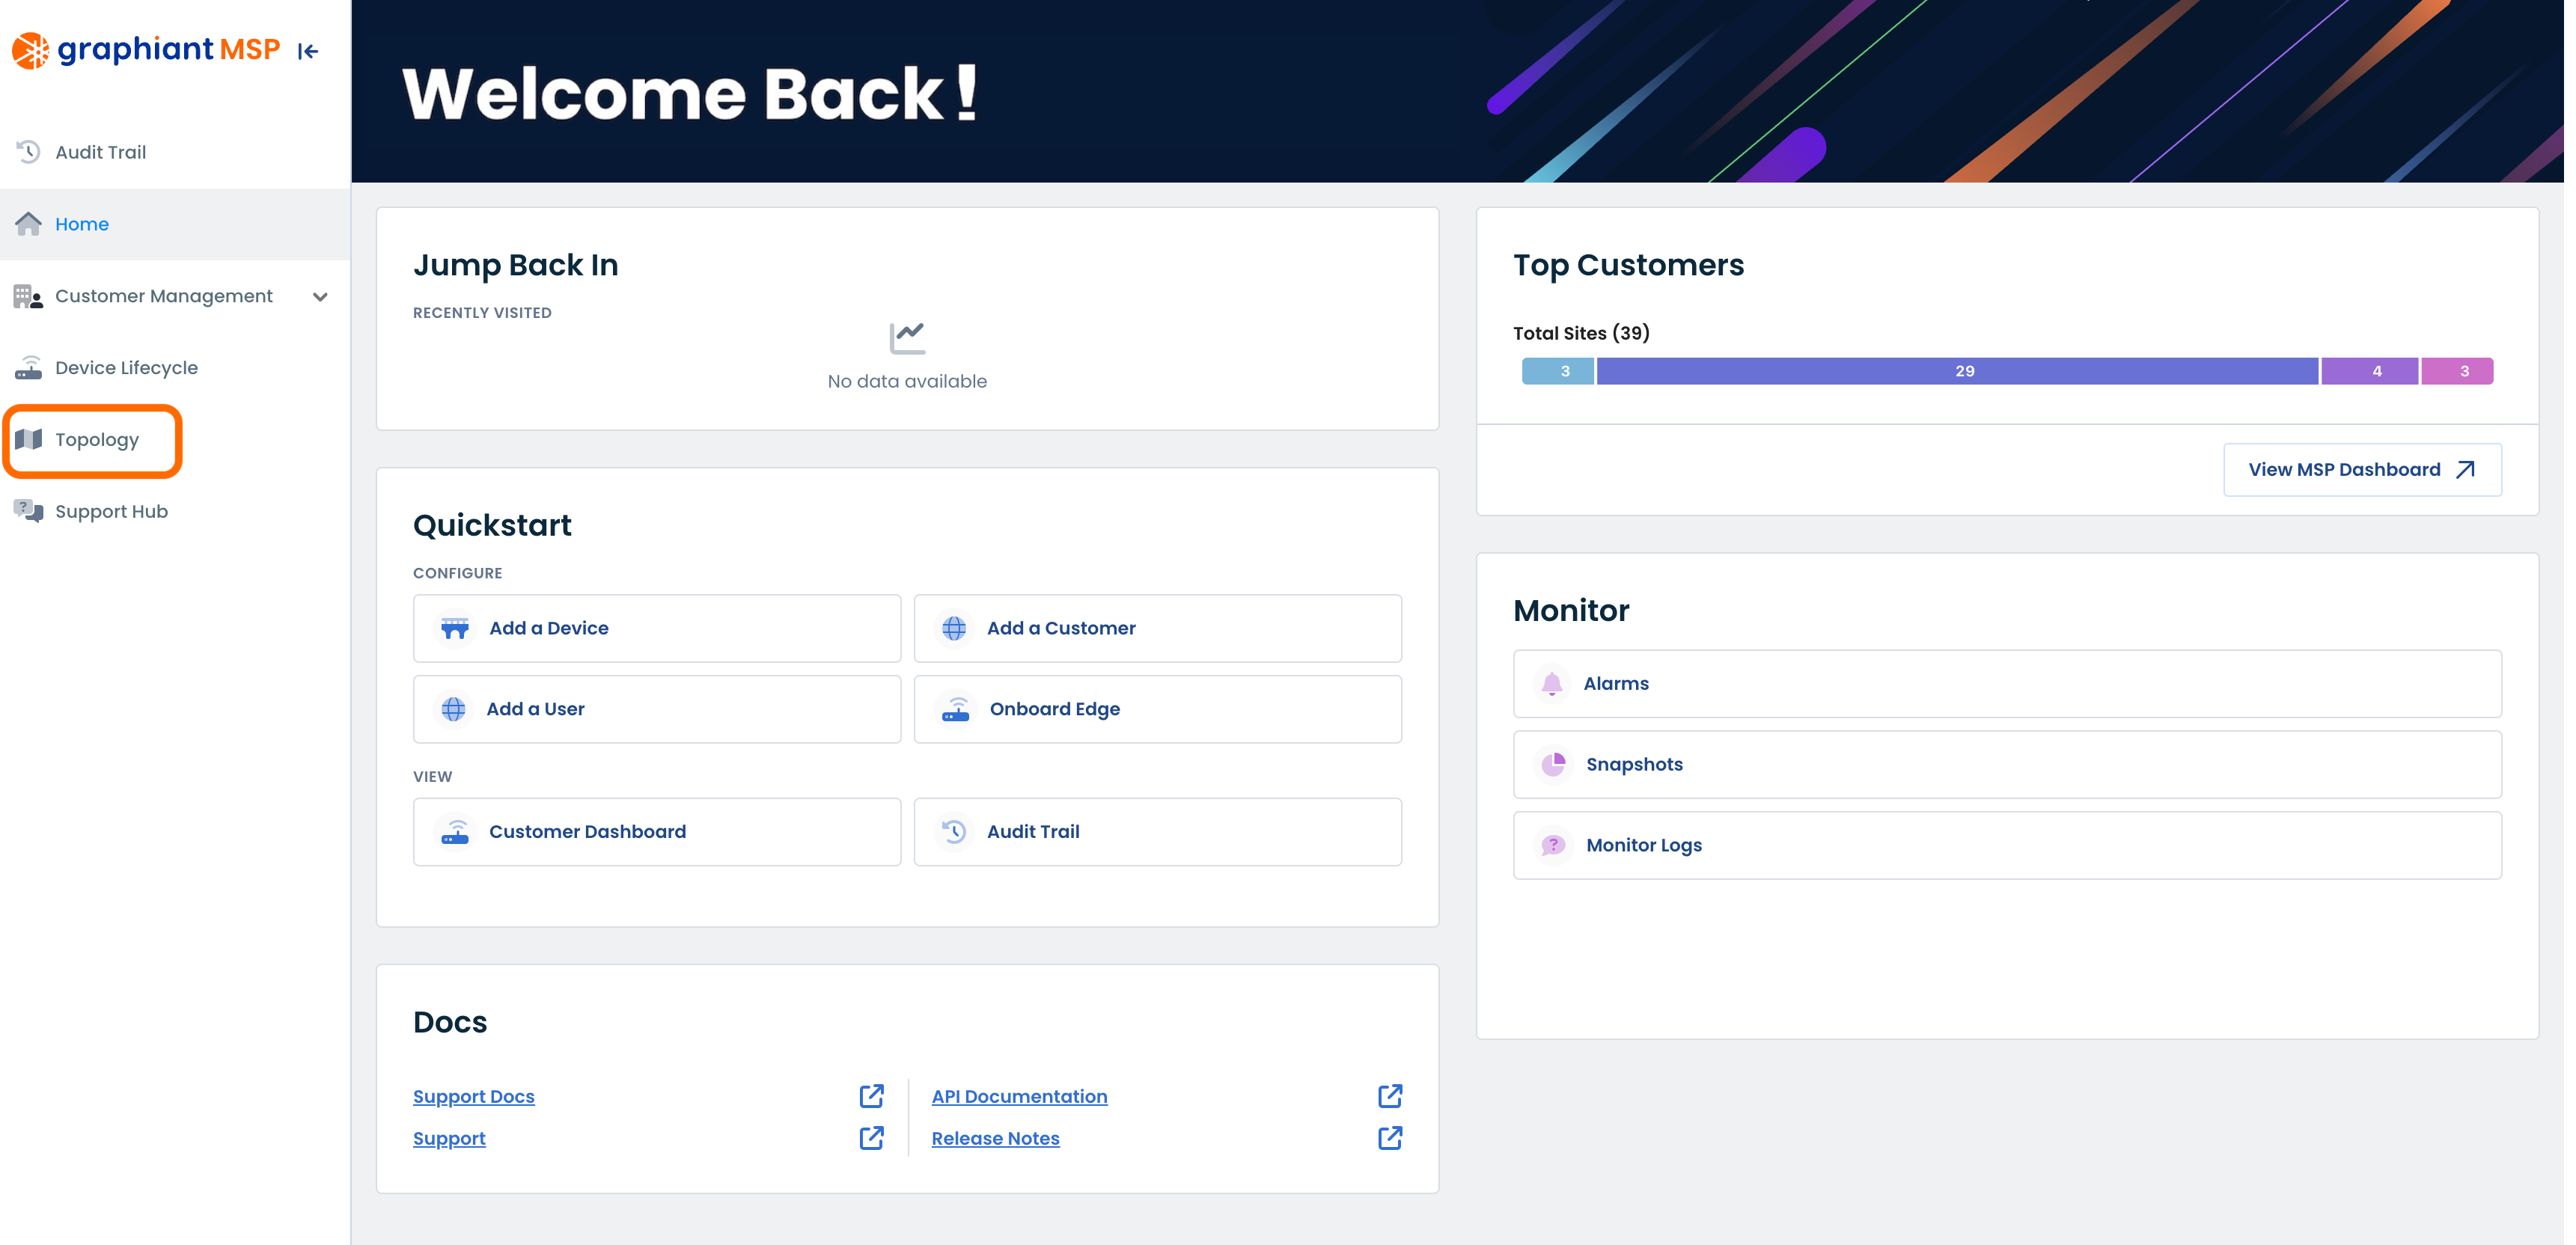
This will open the Topology map for your network.
From here you will be able to see the paths that your tenants’ data is taking within your network.
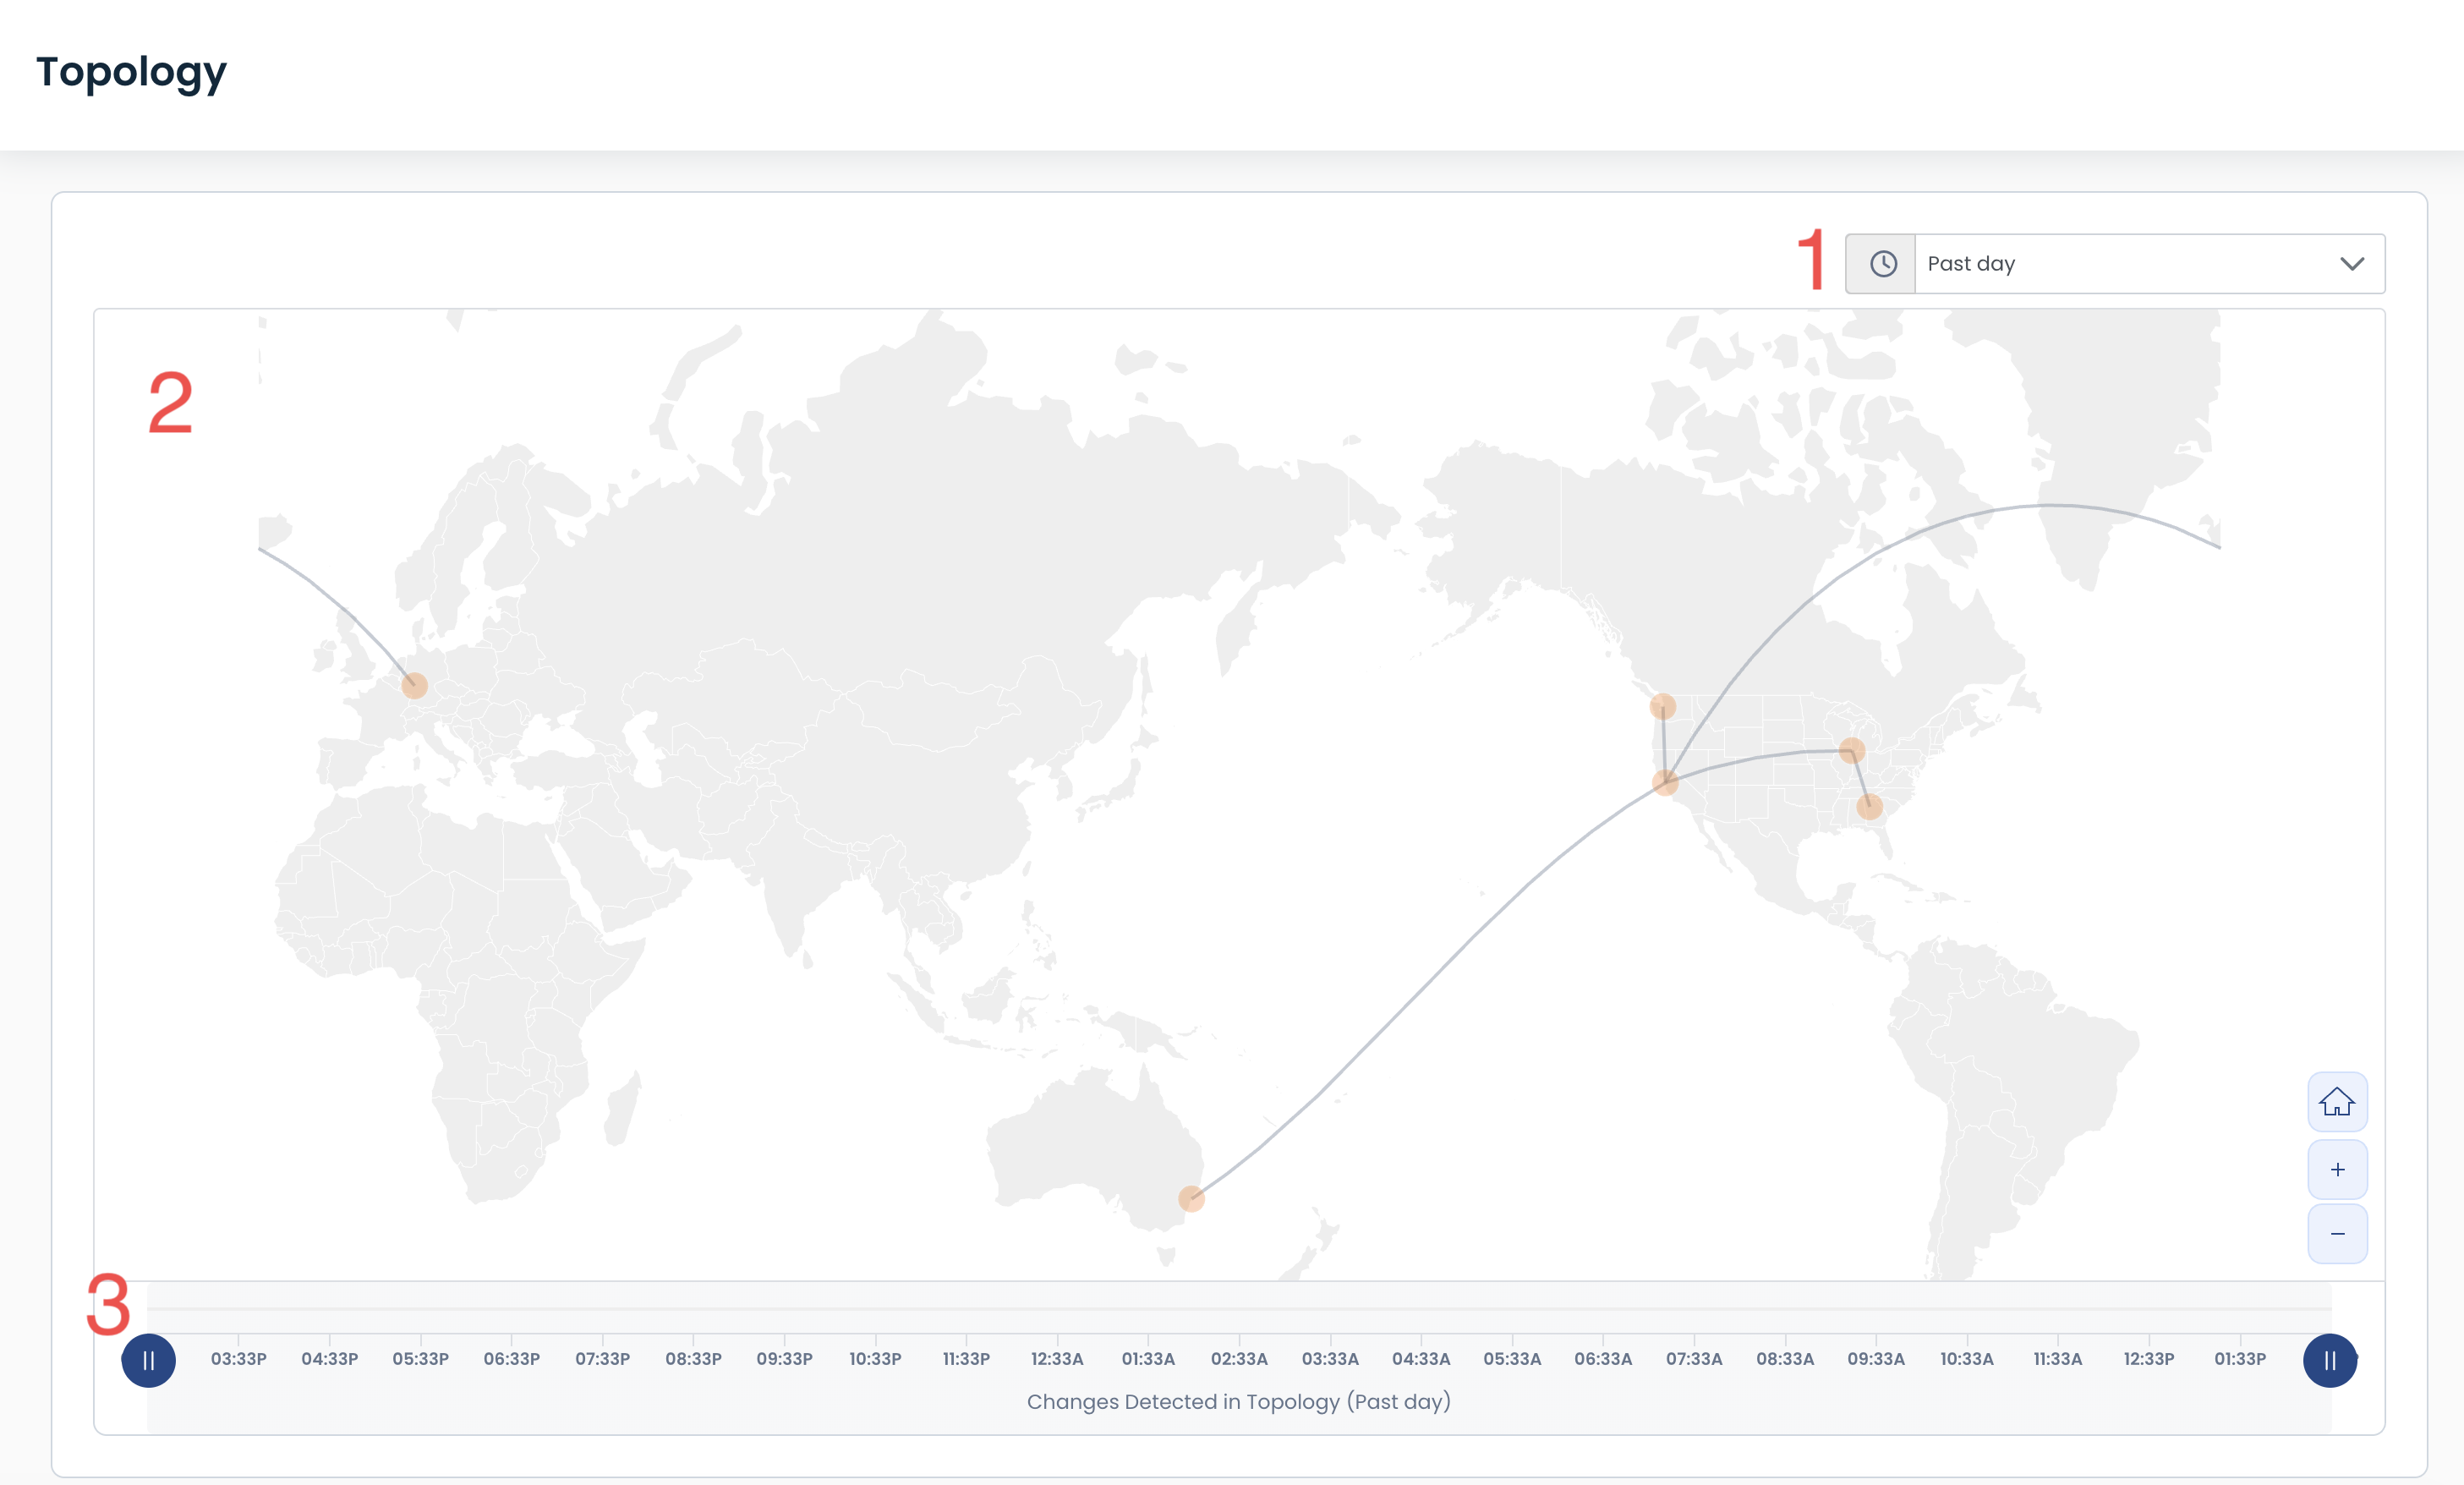
The Topology map is laid out in three sections:
Time Picker: Information selected here will determine the information shown on the entirety of the page.
Topology Map: This visual shows the pathways, regions, and sites through which the data is traveling through your network.
Topology Slider: These endpoints are movable so that you can visualize the differences in the topology changes, denoted by stars in the timeline.
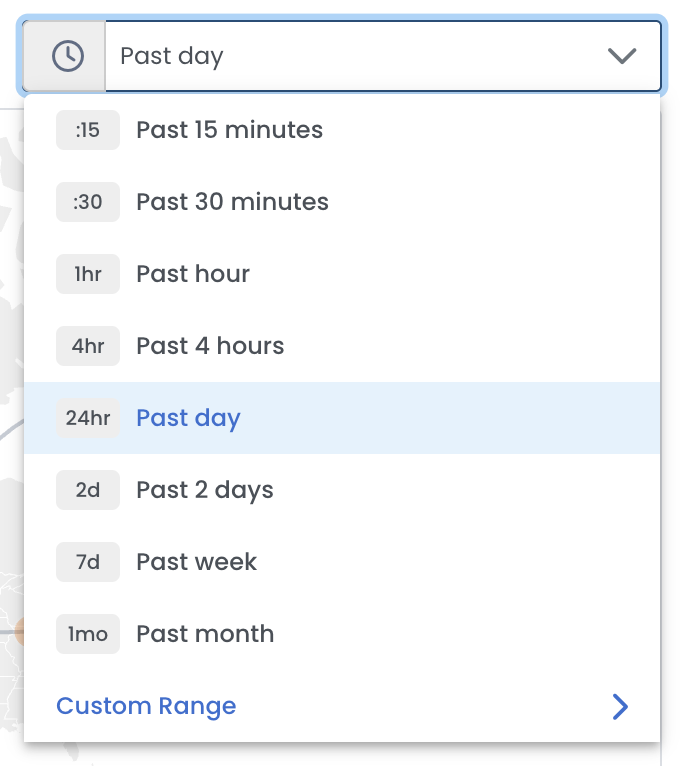
Topology Time Picker
Using the time picker, you can adjust theTopology map to give all information about the topology of your data starting at the present time, and going back anywhere from the past 15 min up to a month, or even a custom time frame of your choosing.
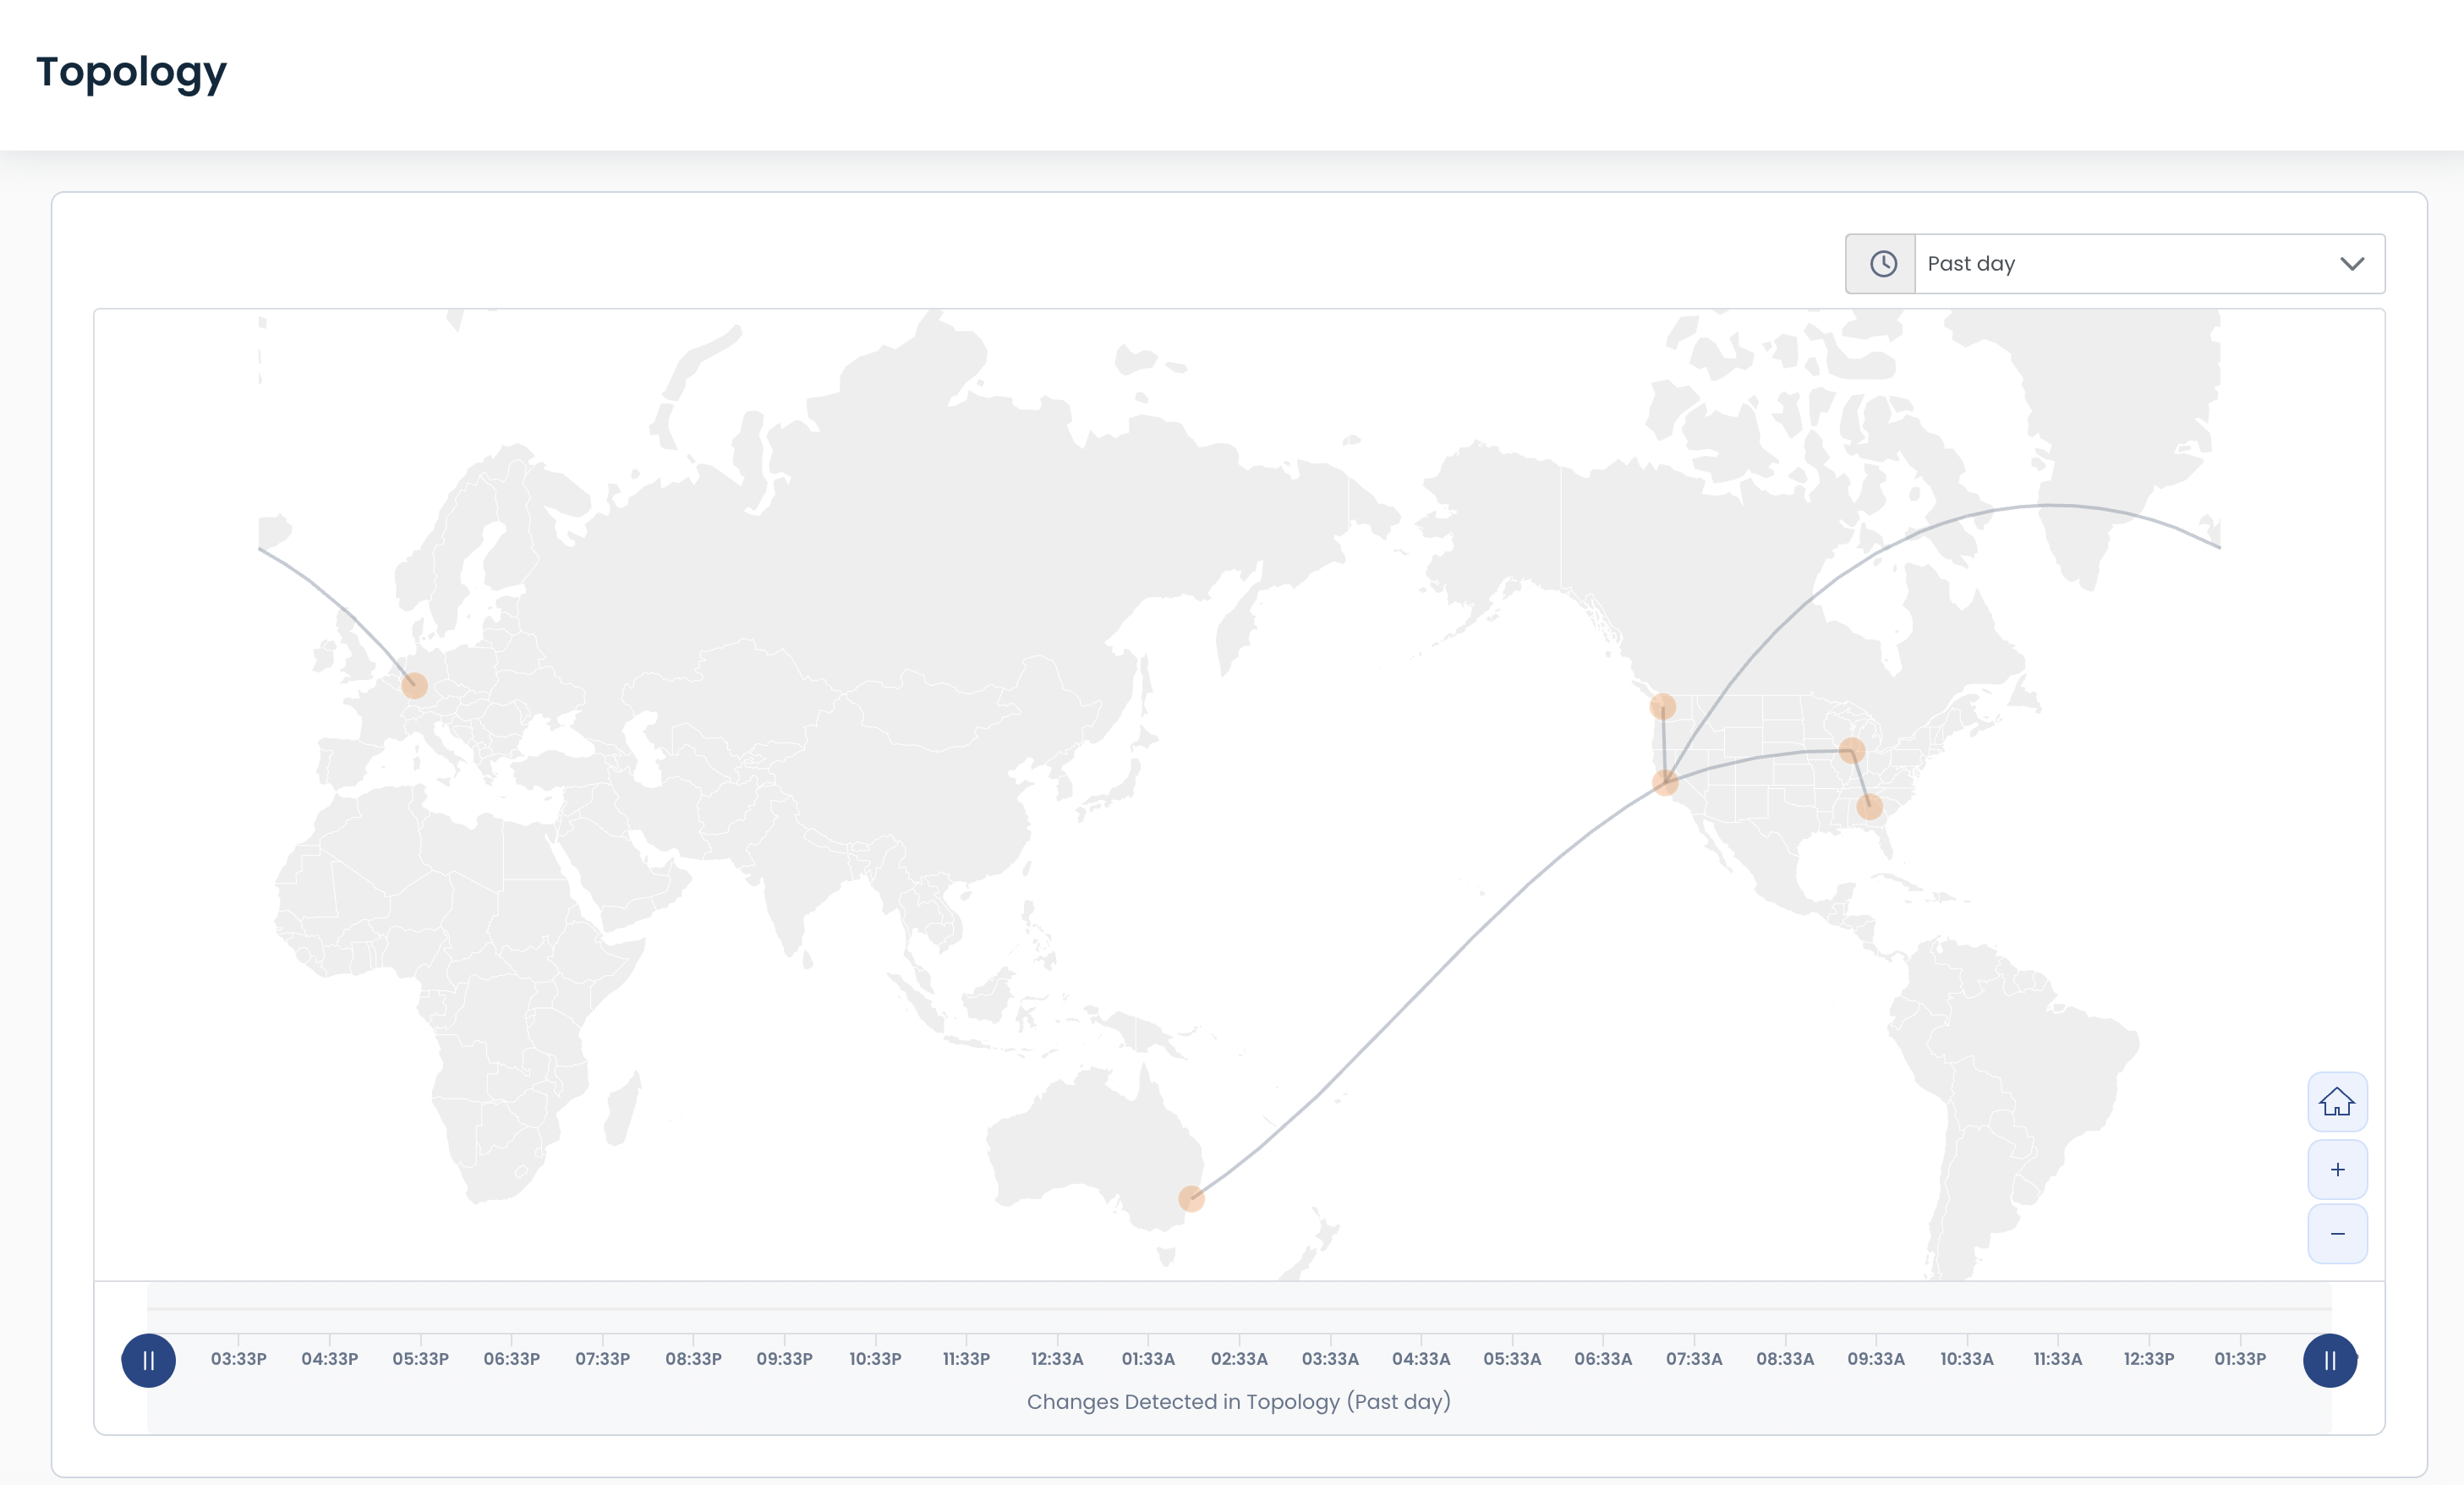
Topology Map
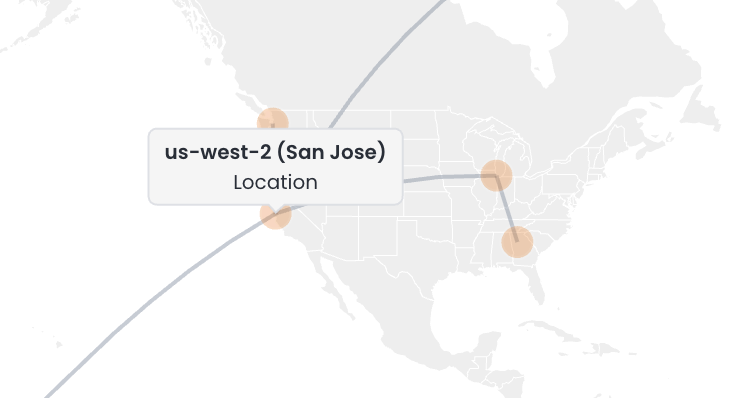
The topology map will show all PoPs within your network, as well as the routes the data has taken.
.png)
Hovering over a location will show the Graphiant PoP through which the data is traveling.
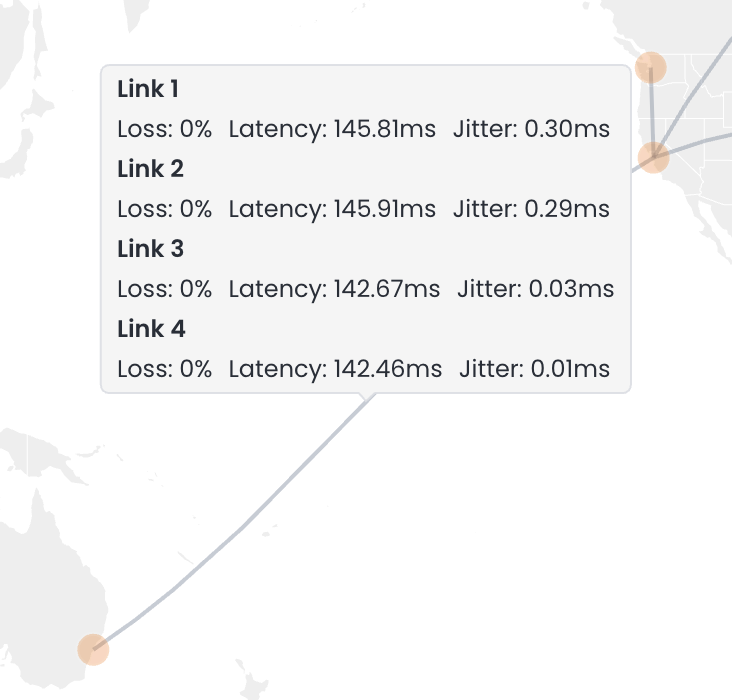
Hovering over a path will show its loss, latency, and jitter values.
Topology Slider
Should you need to fluidly see the topology changes that have occurred, the Slider tool below the map allows you to quickly manipulate the timeframe of the data, to see where the topology may have changed within the selected window of the time picker.
Adjusting the slider will narrow down the topology to only those paths and PoPs utilized during the specified time.

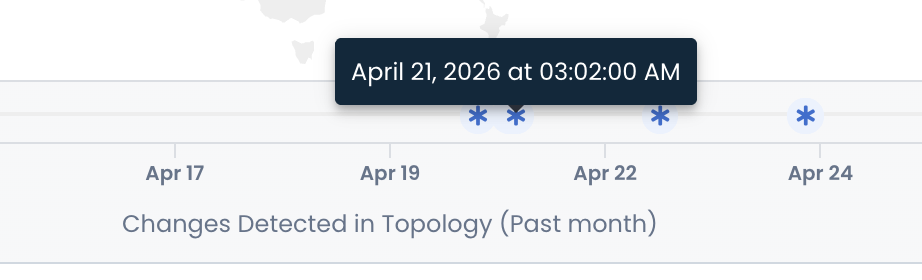
Hovering over any topology change point will give you the exact date and time, and the map will reflect the new topology.