What is the Edge Monitoring Dashboard?
The Edge Monitoring Dashboard provides a centralized view of an individual Edge, including connectivity, application activity, and circuit performance. This page is designed to give your operators a quick, actionable understanding of the health of your Graphiant Edges.
You can use the Edge Monitoring Dashboard for:
Quick Edge health validation
Troubleshooting connectivity issues
Monitoring application and traffic trends
Validating segmentation behavior
Identifying anomalies or high-usage endpoints
Locating the Edge Monitoring Dashboard within the Graphiant Portal
From the Home screen, navigate to the Edge Configuration screen by clicking 'Monitor' in the sidebar; select 'Site Health Dashboard'.
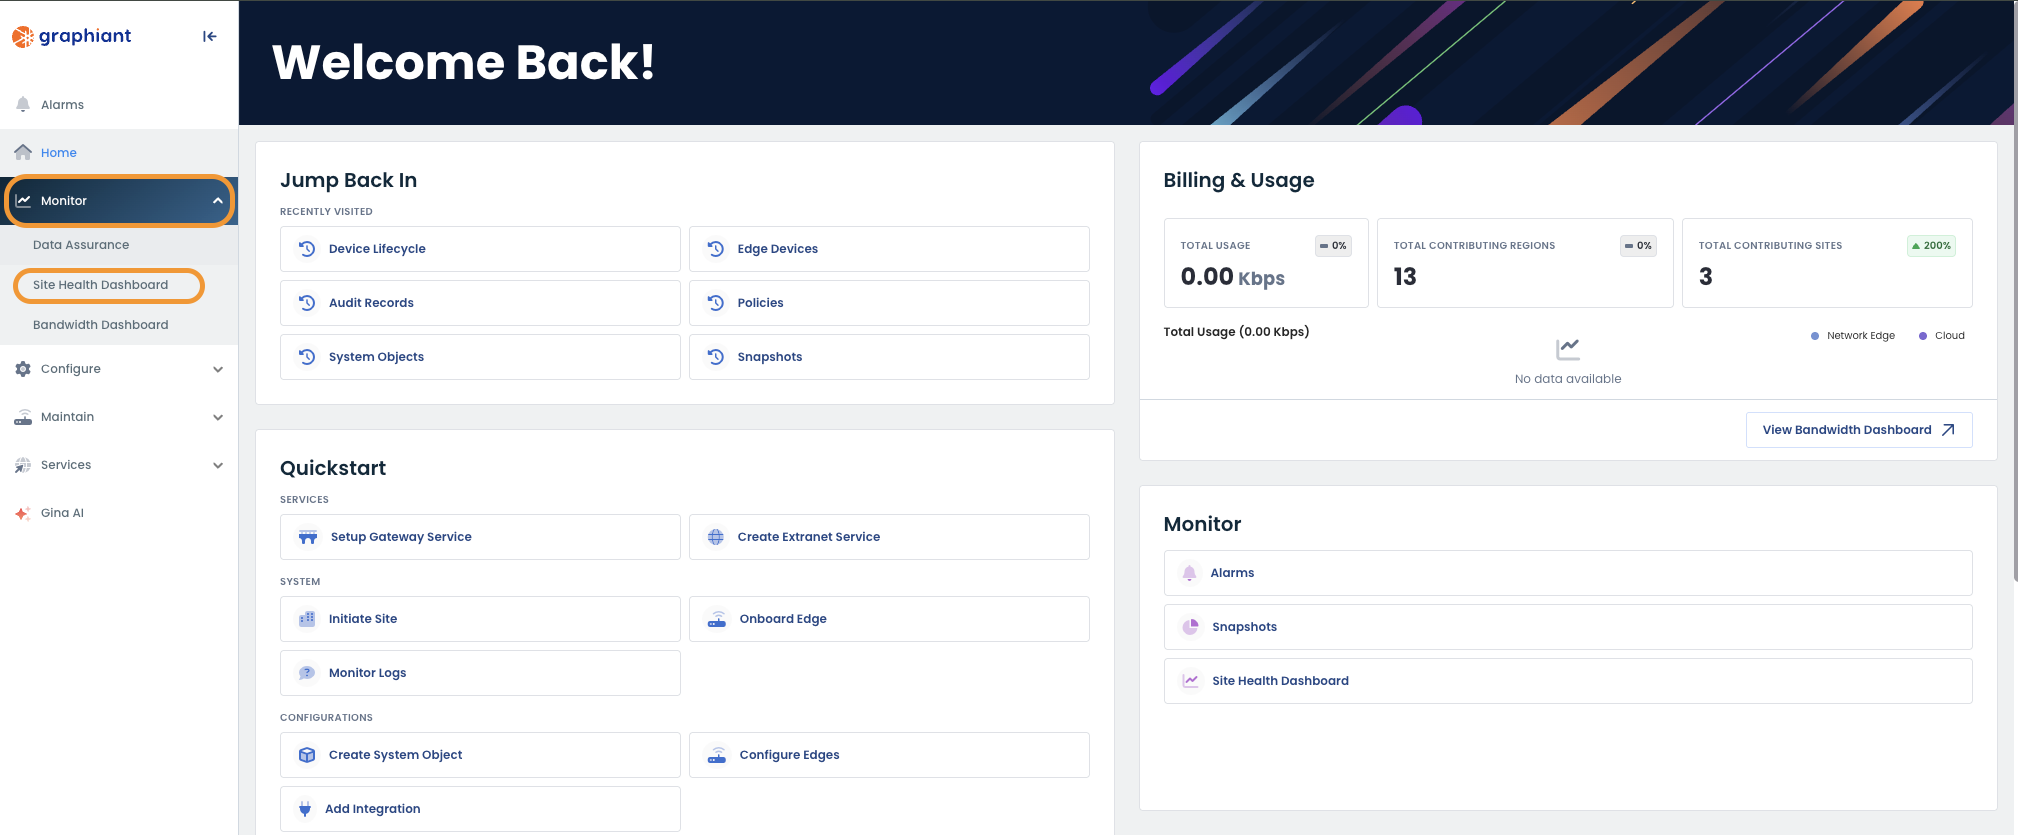
This will take you to the Site Health Dashboard. Scroll down to see the Network Devices Section.
.png)
Under the column 'Hostname,' select the device which you want to monitor.
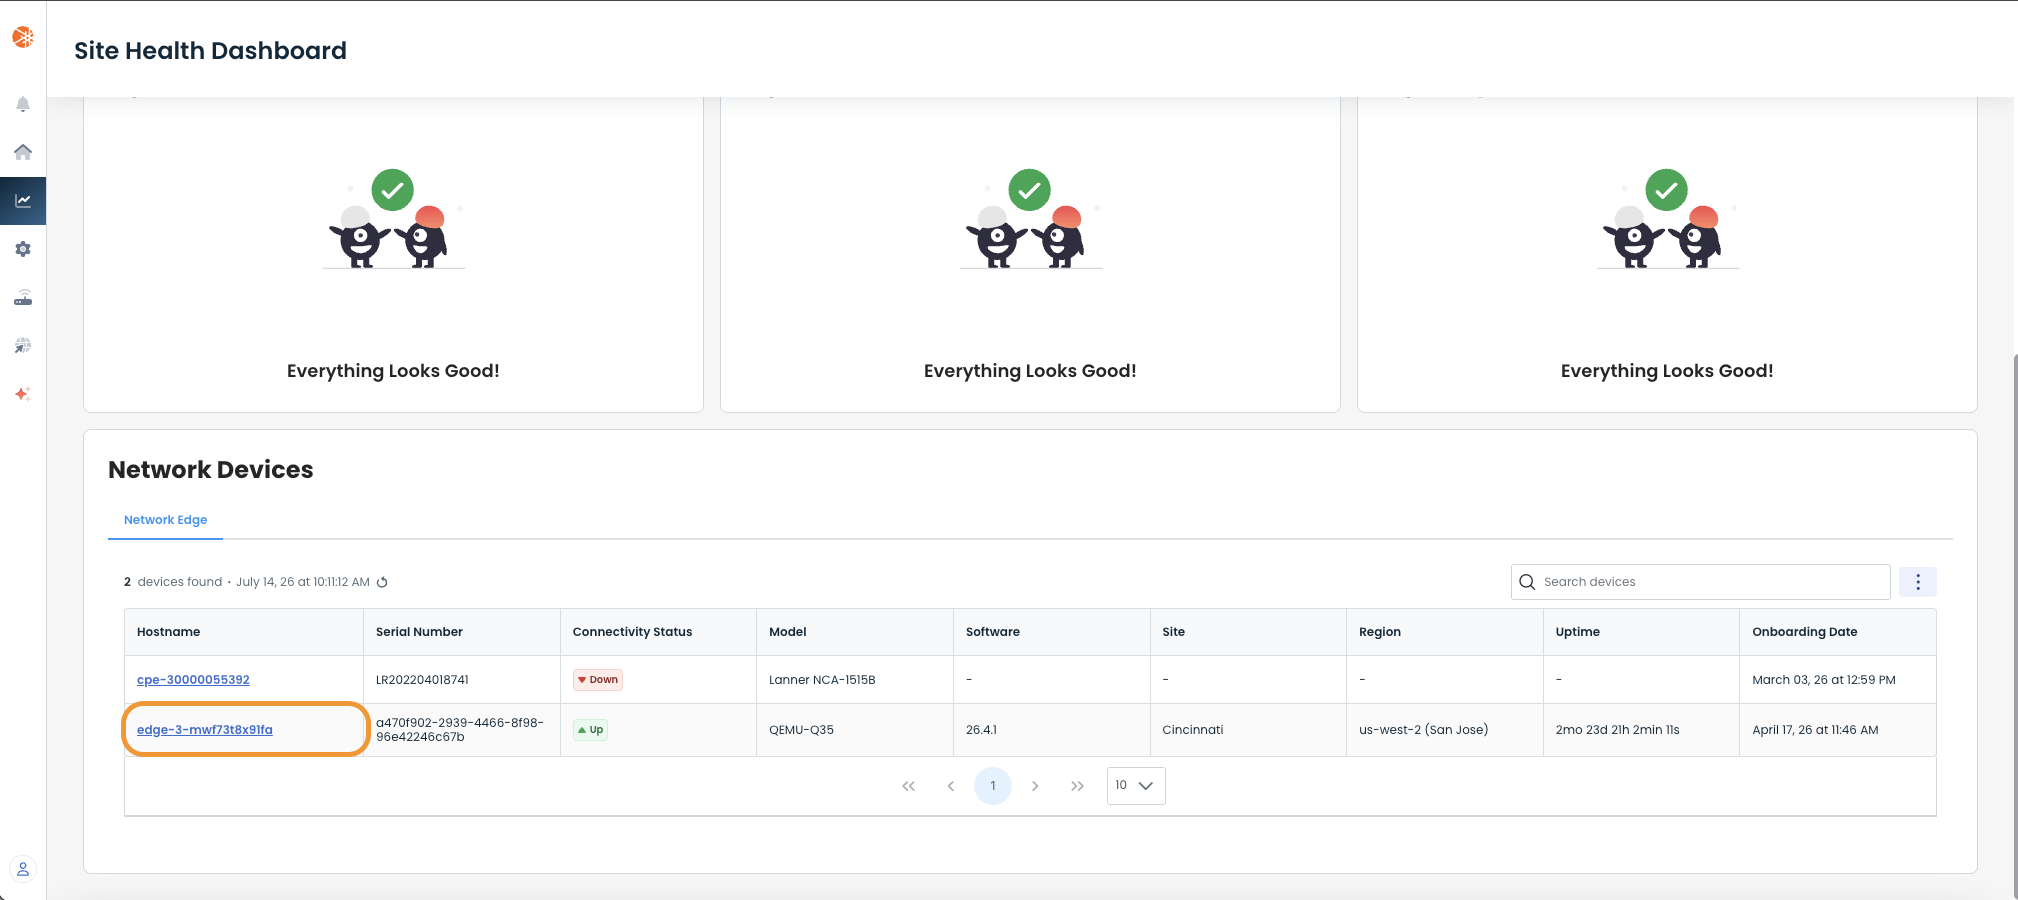
You will now be in the Monitoring Dashboard for that Edge.
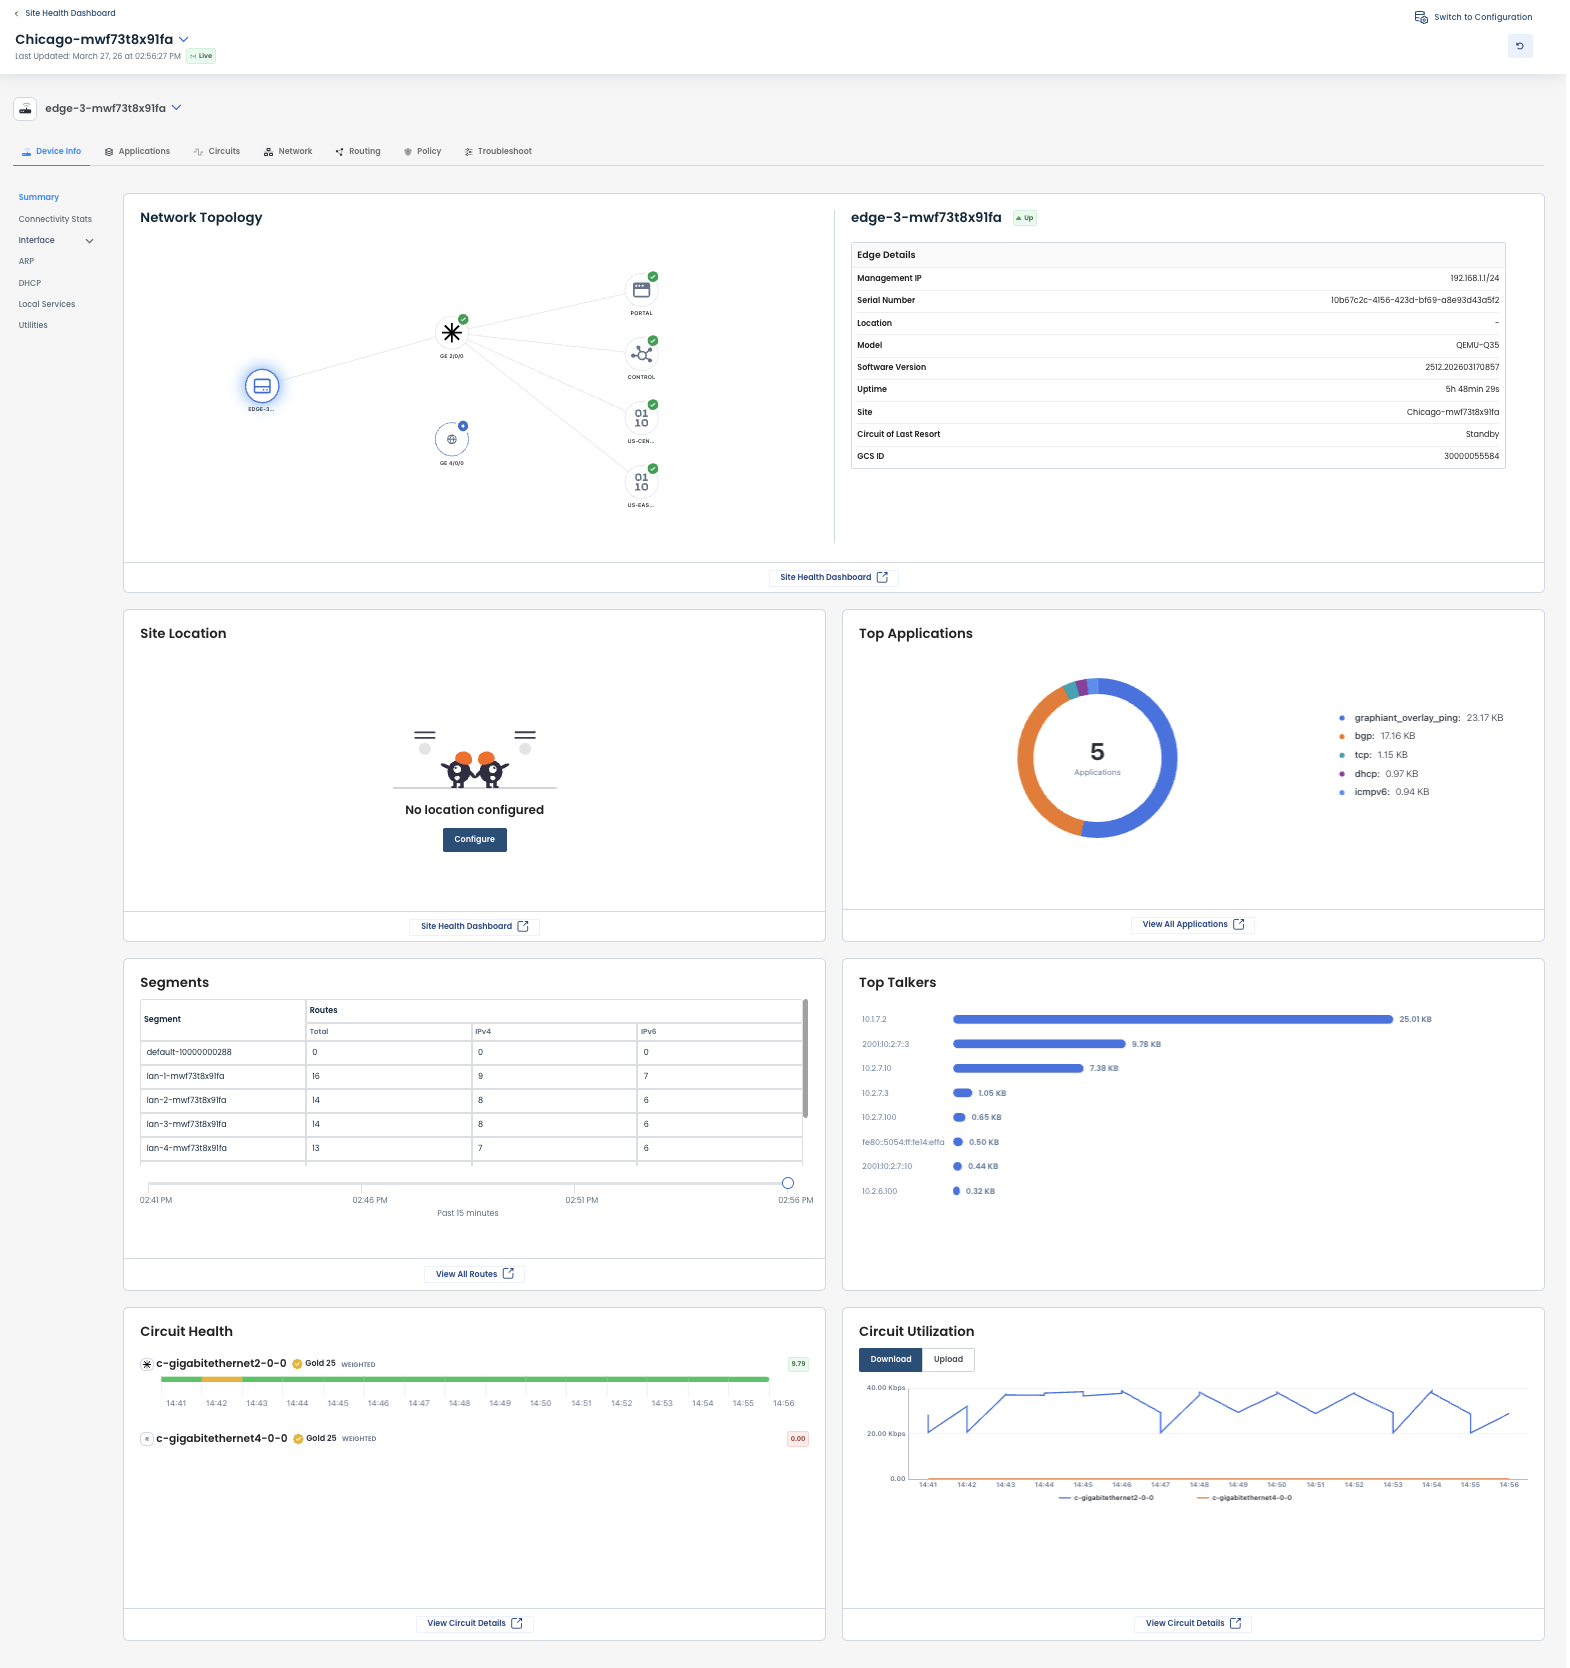
Navigating the Edge Monitoring Dashboard
The Edge Dashboard is organized into sections. Each section includes quick-view data regarding your Edge and, where applicable, a link to more details.
.png)
Should you desire to view details on a different Edge, or even a different Site, you can select that right from here by:
Edge: Select from the dropdown next to the Edge name at the top left.
Site: Select from the dropdown next to the Site name at the top left.
.png)
.png)
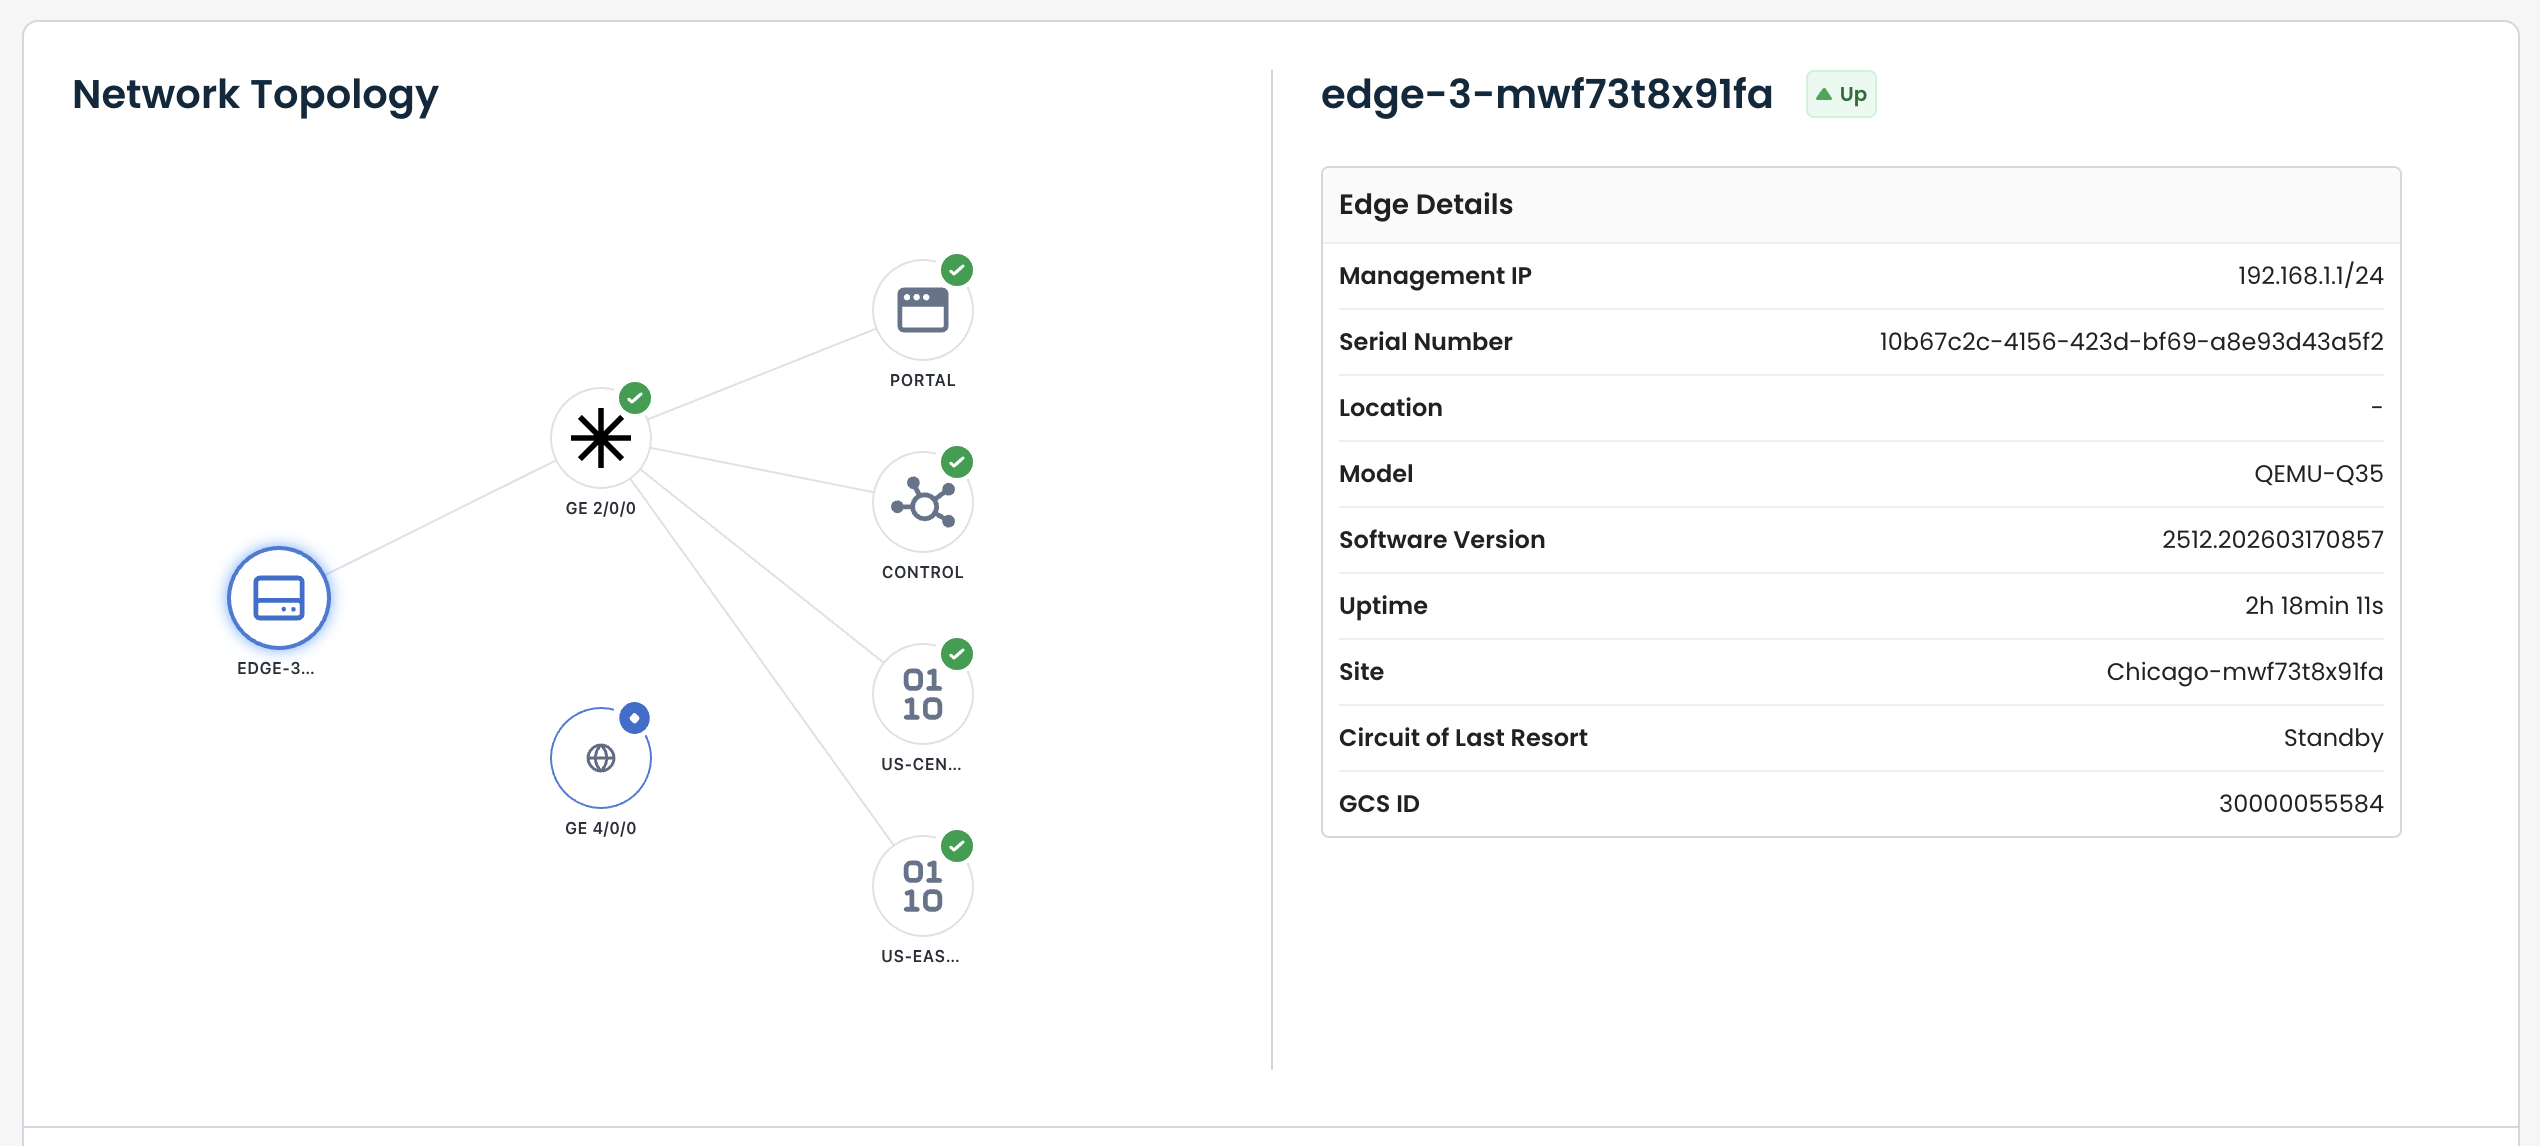
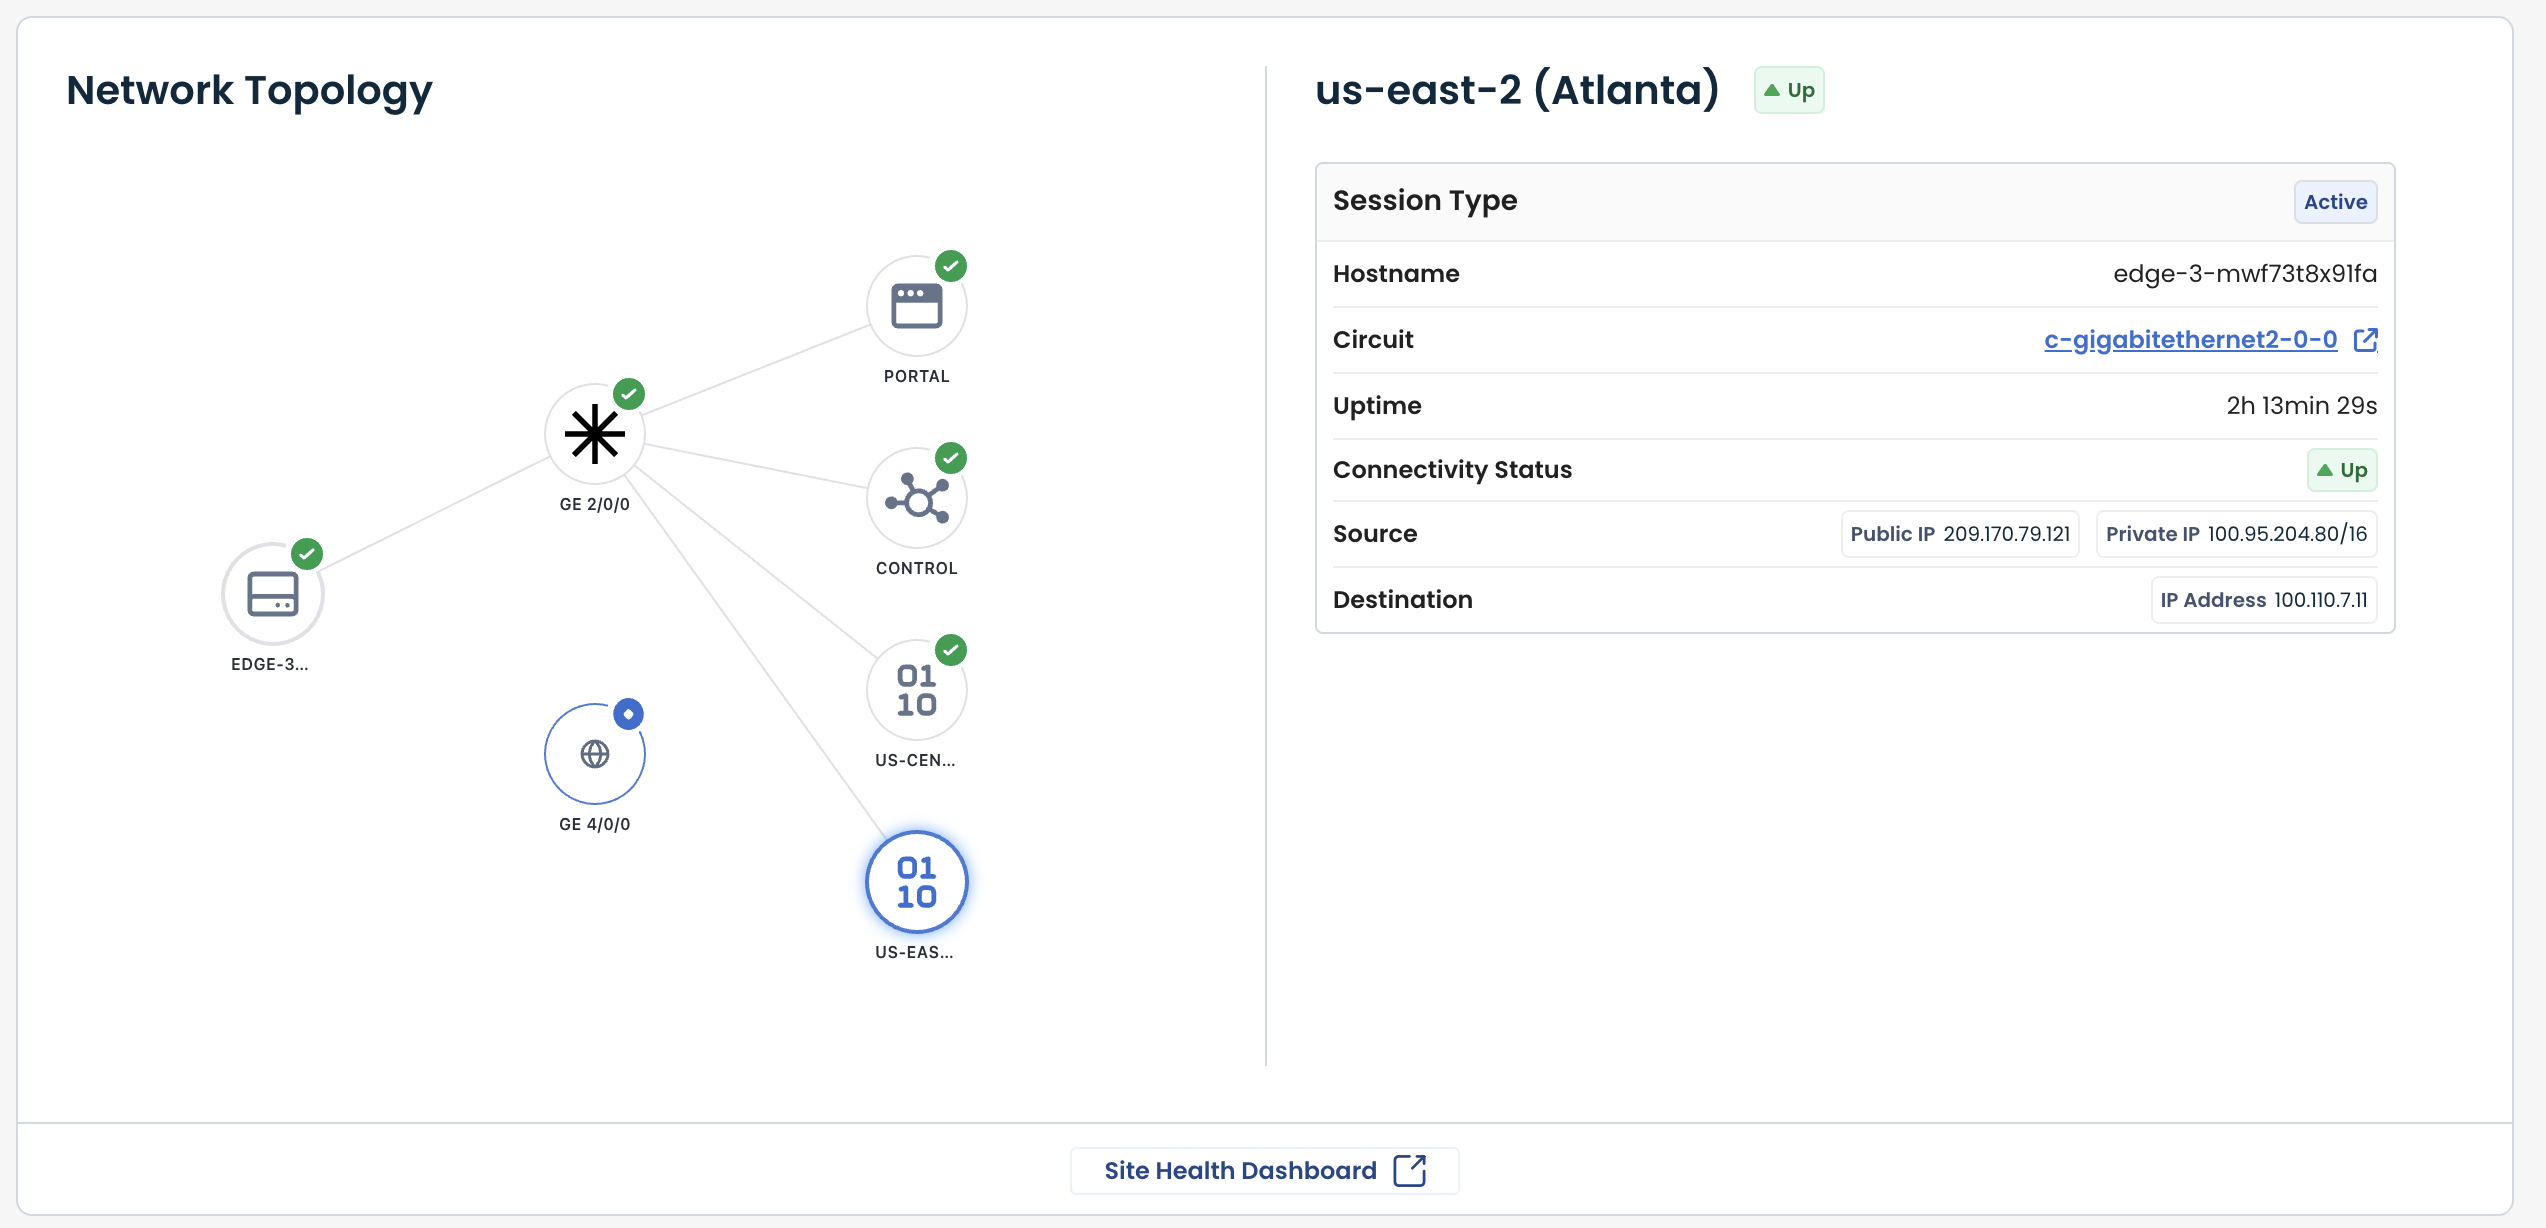
Network Topology
The Network Topology section shows a visualization of how the Edge connects to the Graphiant fabric.
This view can to used to quickly confirm that the Edge is properly connected to the fabric and ensure that all expected paths are active.
Displays the selected Edge and connected components
Indicates connection health using status icons
Allows you to select any of the components to view details
The highlighted component determines the details shown to it’s right.
Note:
The link to the Site Health Dashboard at the bottom of this section can be used to further check site and connectivity information.
Edge Details
If the Edge is selected, the Details shown will be
Status: Whether the Edge itself is Up or Down
Management IP: Allows admin access to the Edge
Serial Number: Hardware identifier assigned to the Edge device
Location: Physical or geographic location where the Edge is deployed
Model: Hardware model/type of the Edge device
Software Version: Current version of software running on the Edge
Uptime: Amount of time the Edge has been continuously operational since the last reboot
Site: Assigned site within the Graphiant Portal of the Edge
Circuit of Last Resort: Whether a COLR is configured; if so if is it active or on standby
GCS ID: Unique identifier used by Graphiant to manage and track the Edge within the platform
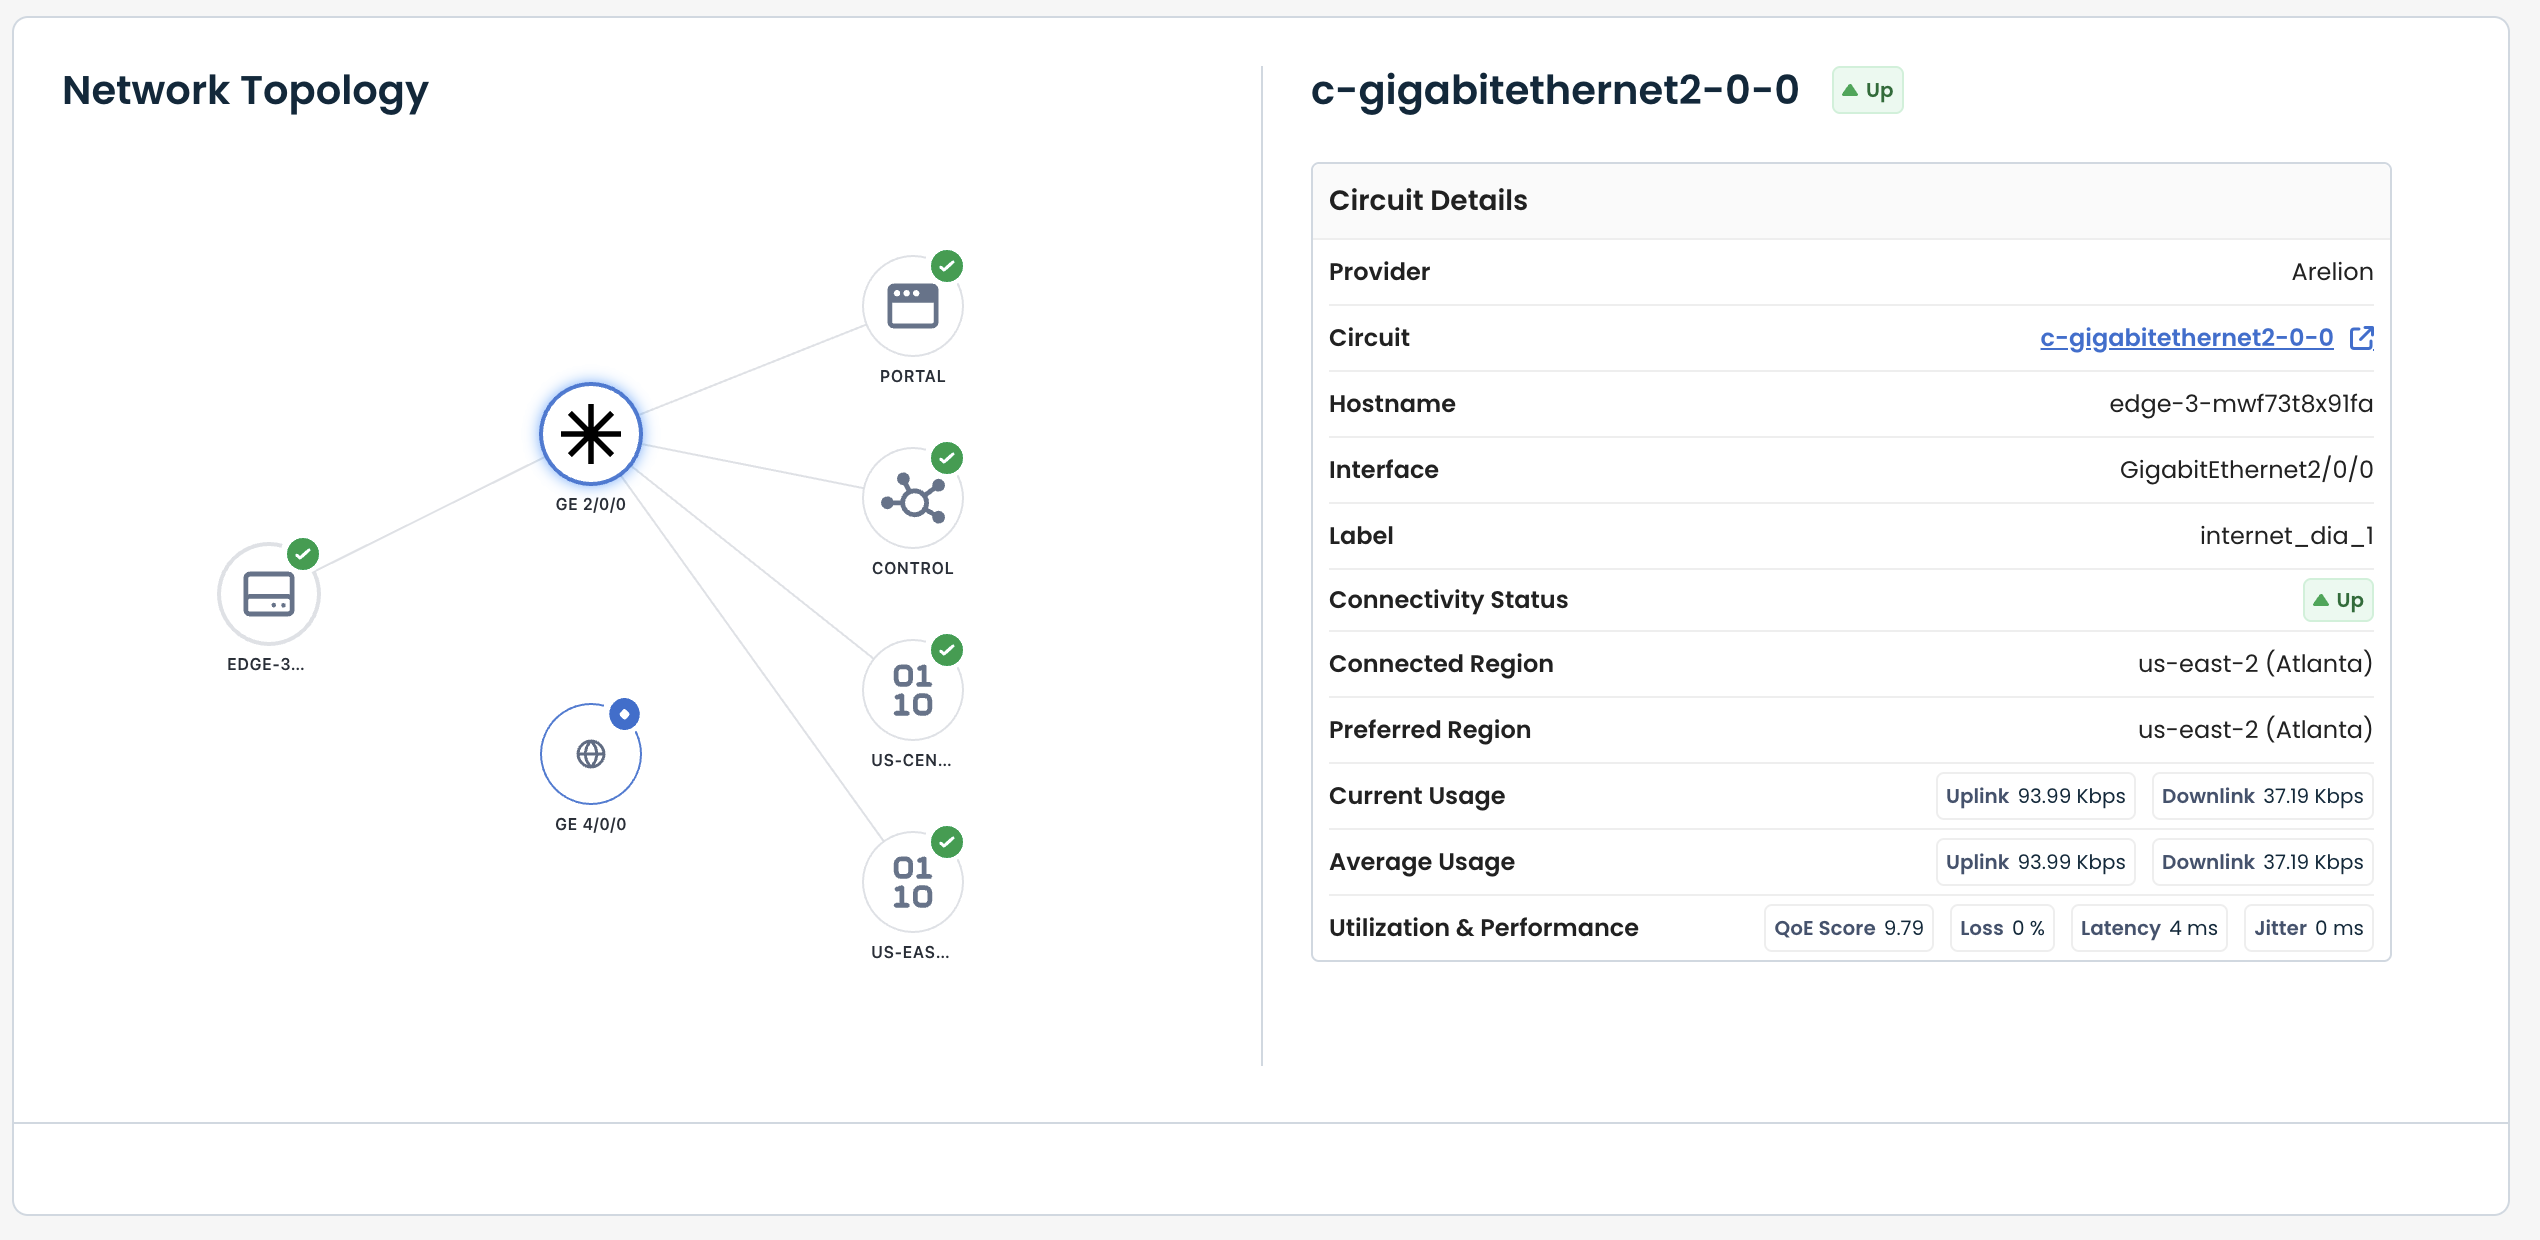
Circuit Details
If a Circuit is selected, the Details shown will be:
Provider: Network service provider delivering the circuit connectivity
Circuit: Name of the circuit associated with the Edge interface
Hostname: Name of the Edge device
Interface: Interface on the Edge used for the circuit
Label: User-defined name for the circuit to aid identification
Connectivity Status: Whether the Circuit itself is Up or Down
Connected Region: Graphiant region to which the circuit is currently connected
This is determined by your SLA requirements from the Edge to the Graphiant Core
Preferred Region: Configured primary region for the circuit connection
Current Usage: Real-time bandwidth usage for uplink and downlink traffic
Average Usage: Average bandwidth usage over a recent time period
Utilization & Performance: Summary of circuit performance metrics, including :
QoE score
Packet loss
Latency
Jitter
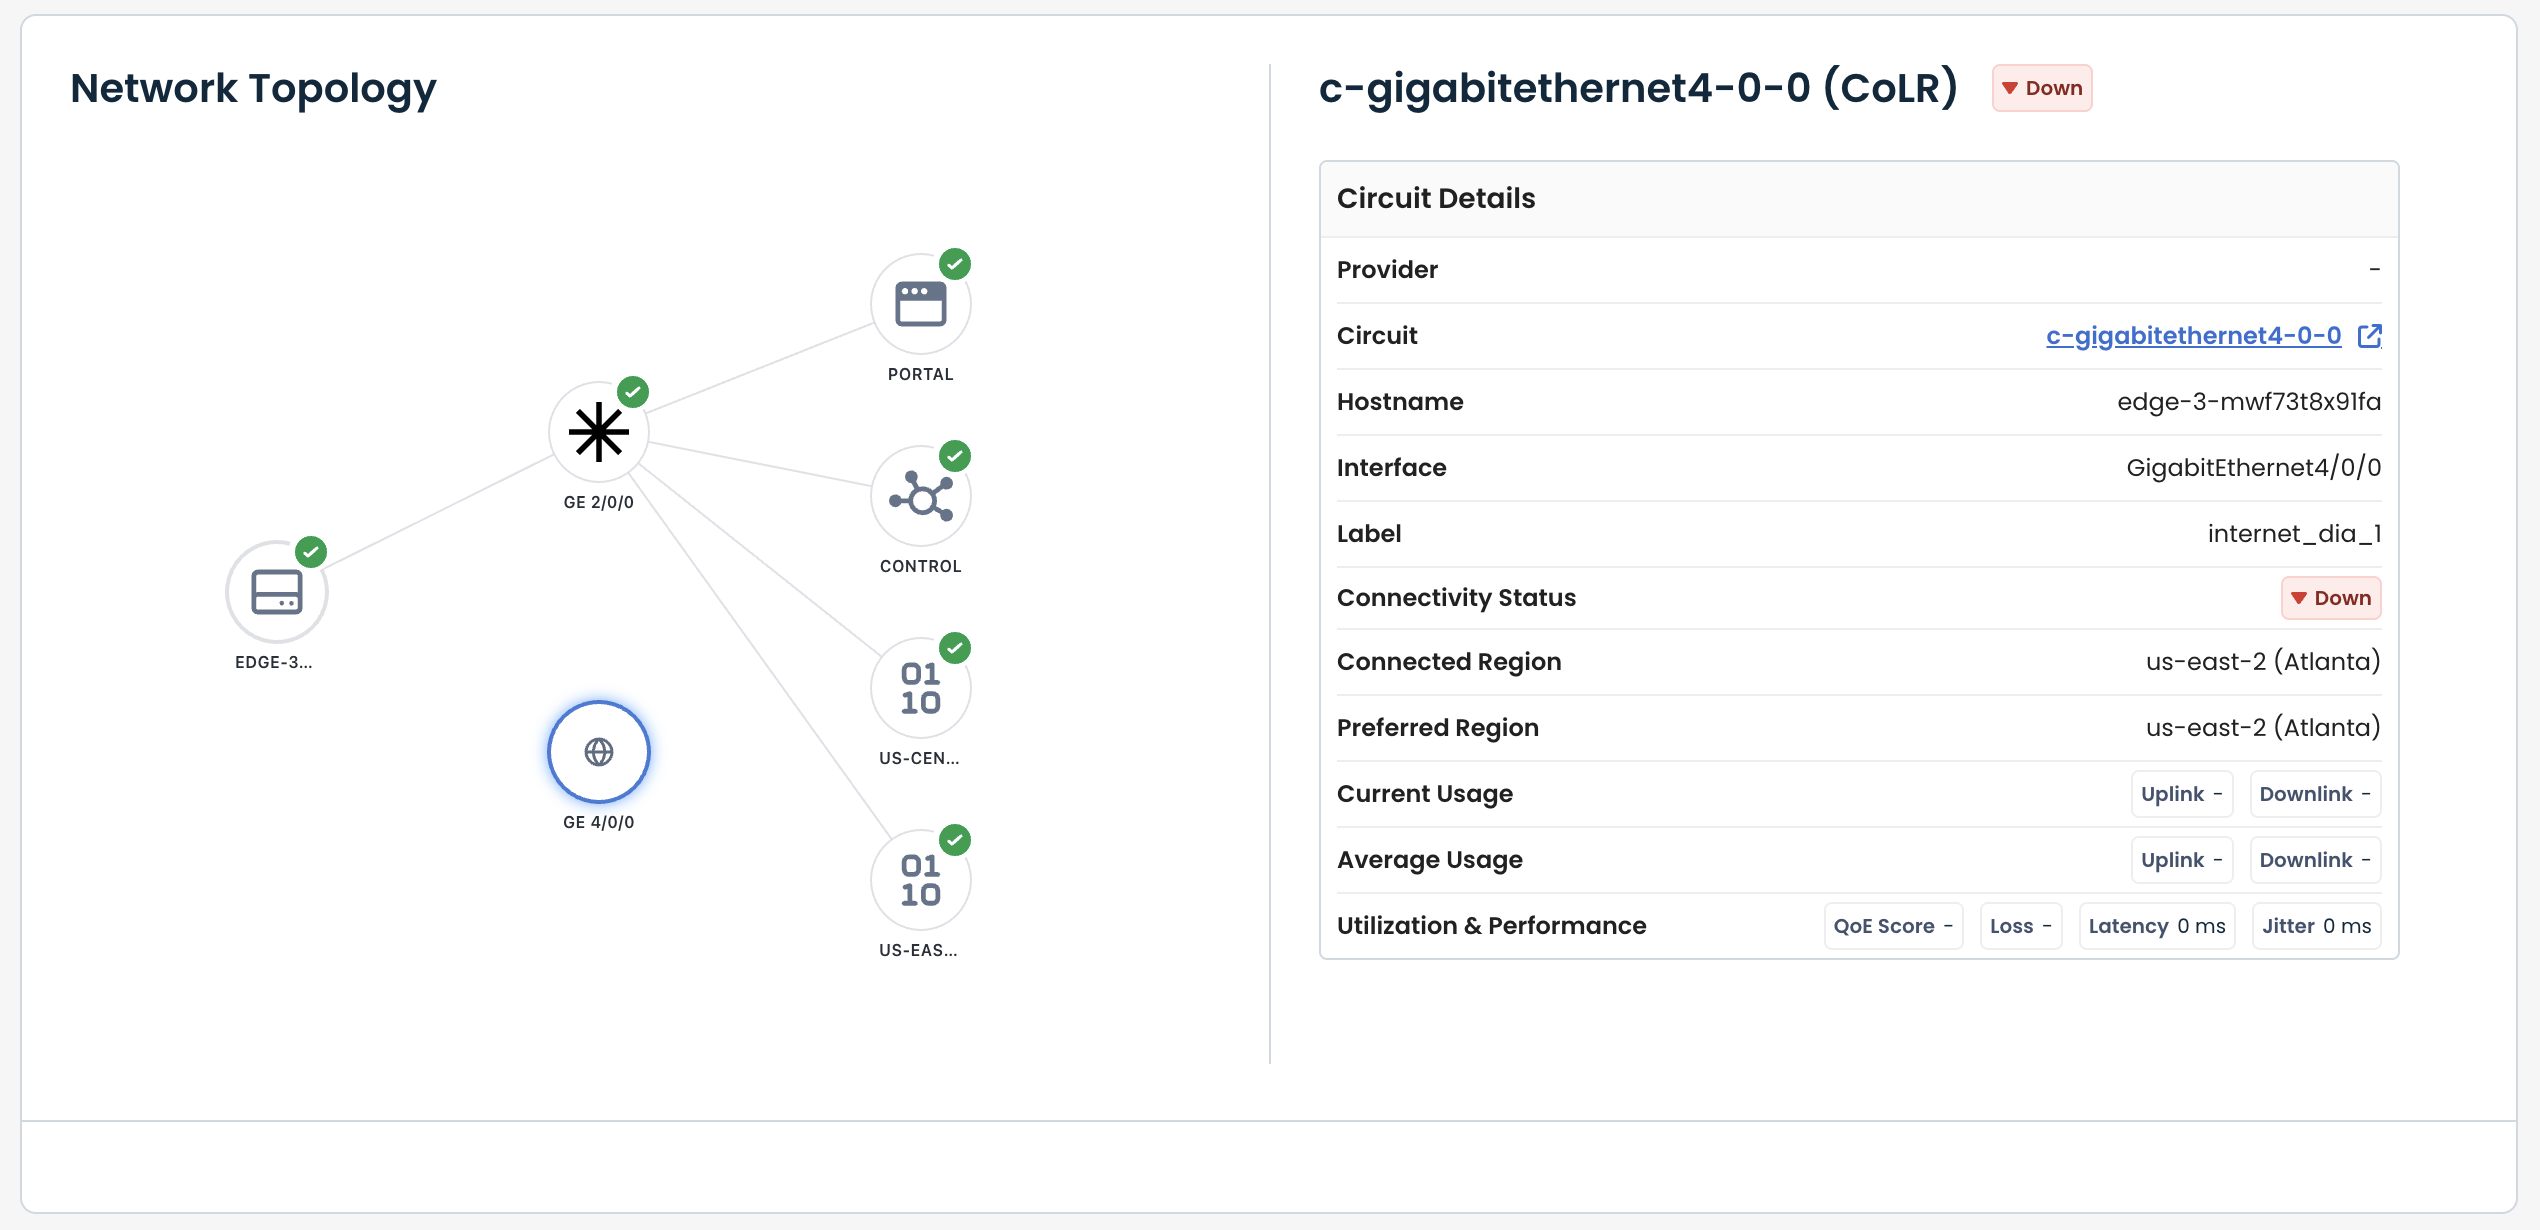
Note:
If there are multiple circuits connected to the Edge, each one will be represented in the Network Topology.
Any circuit selected will give the above details.
If Circuit of Last Resort is selected and it is not in use:
That circuit will show as “Inactive” and it will have no connections.
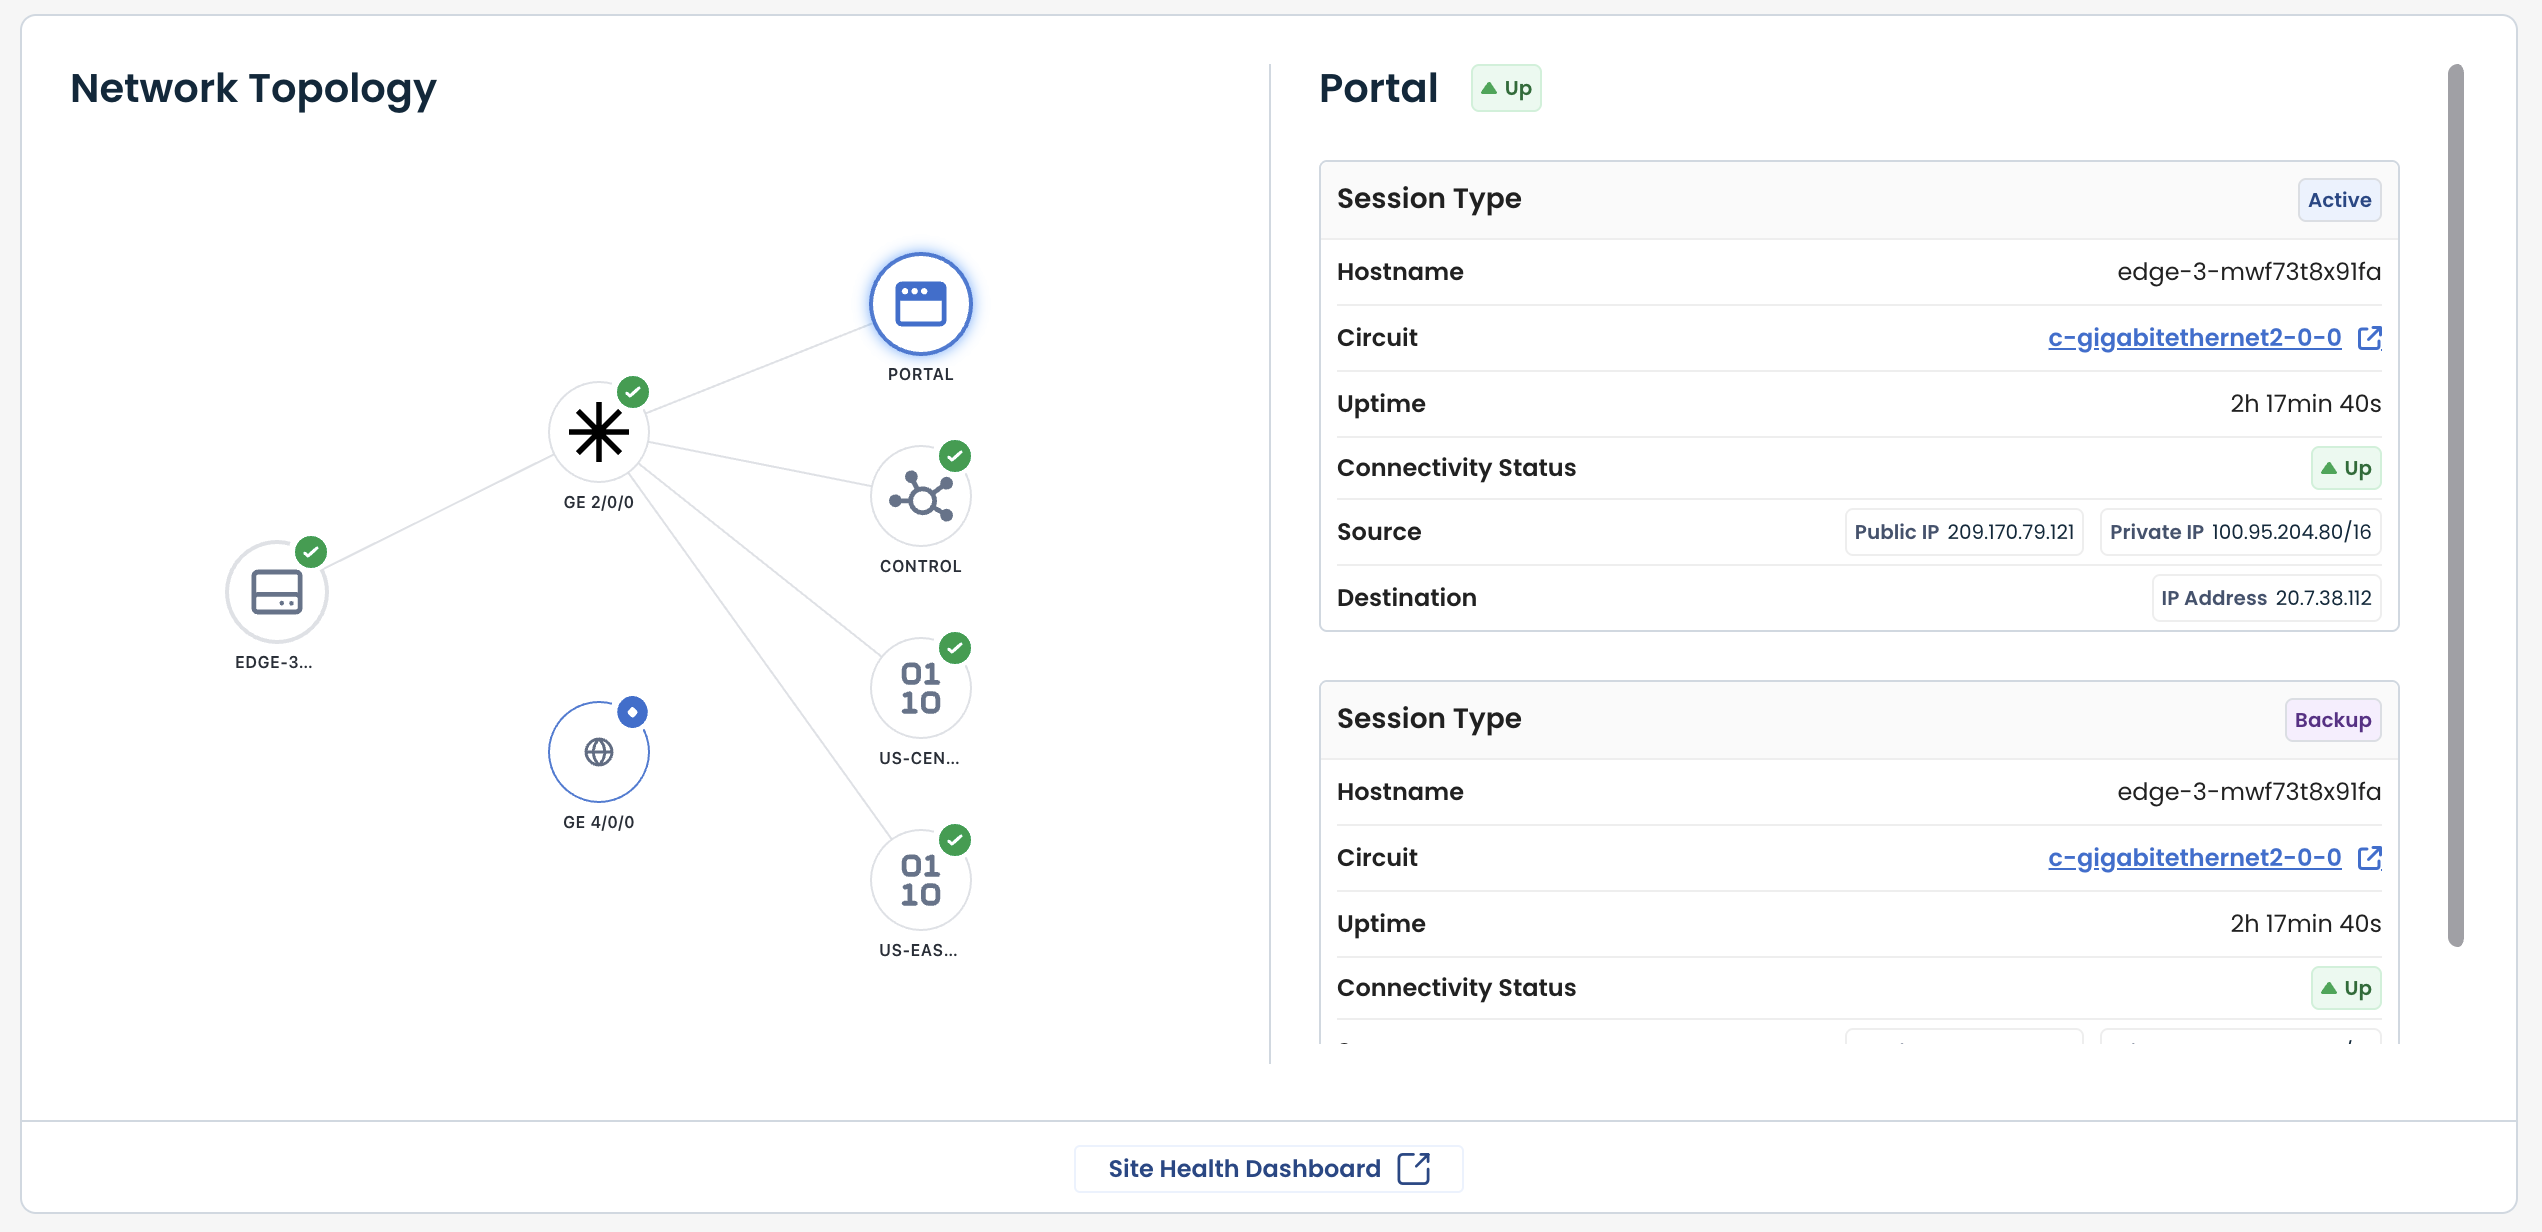
Portal Details
If Portal is selected, the Details shown will be for every session:
Session Type: Indicates the type and current state of the session (Active or Backup)
Hostname: Name of the Edge participating in the session
Circuit: Name of the circuit used for the session
Uptime: Duration the session has been continuously active
Connectivity Status: Current operational state of the session (Up or Down)
Source: Originating IP information for the session, including public and/or private addresses
Destination: Target IP address for the session
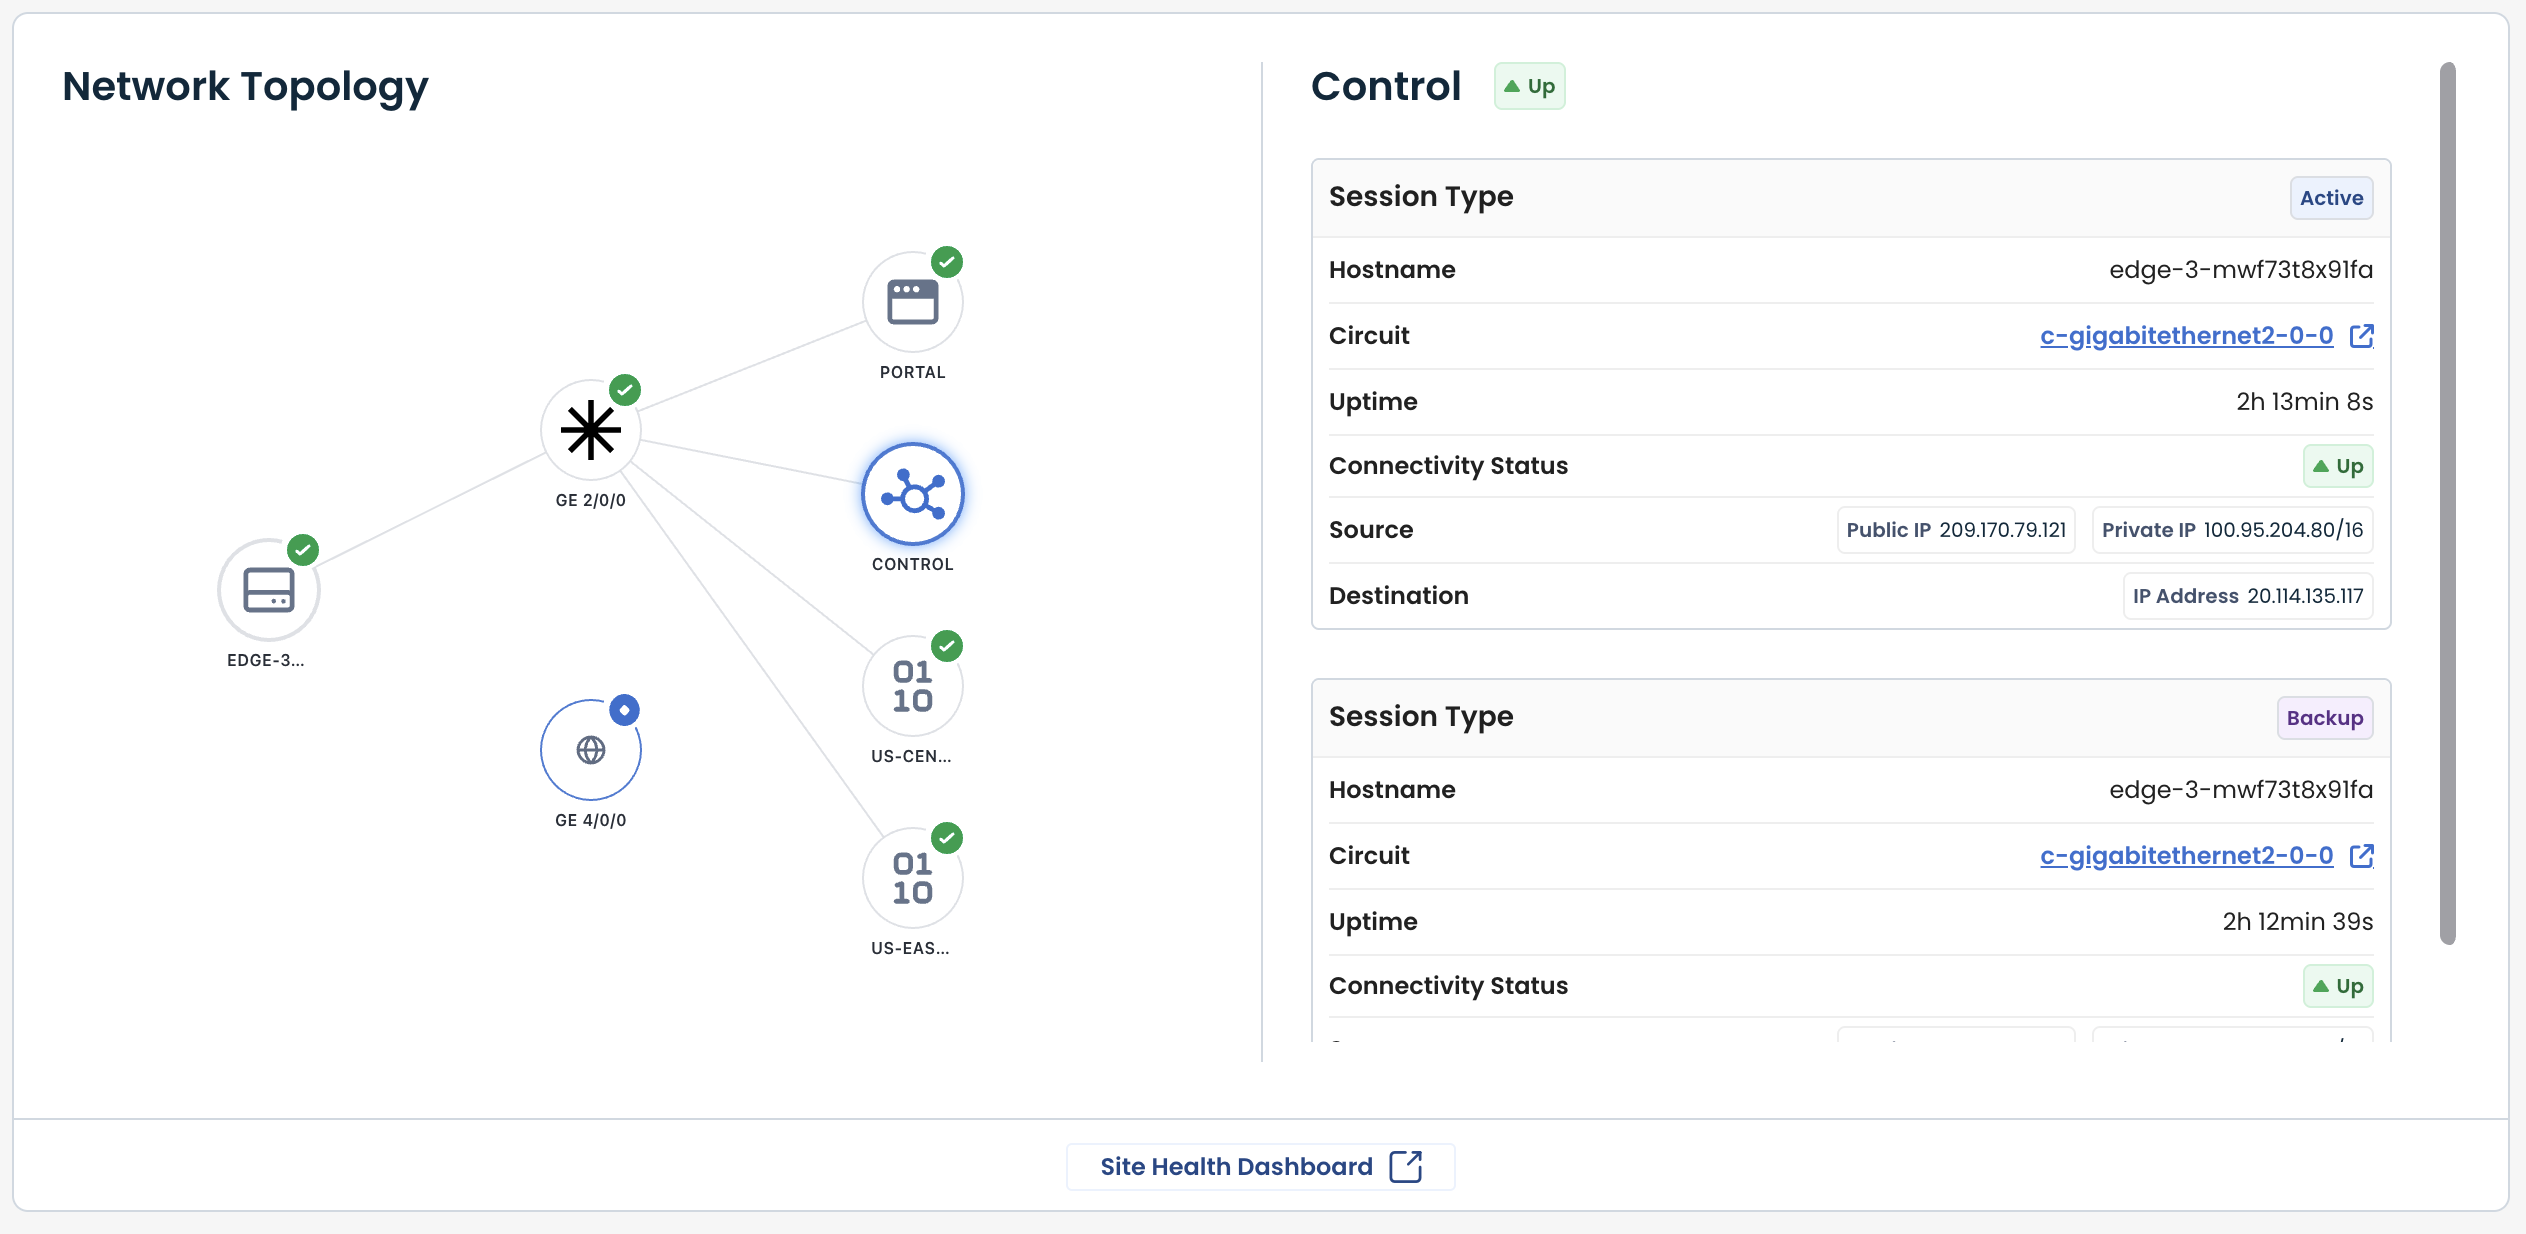
Control Details
If Control is selected, the Details shown will be for every session:
Session Type: Indicates the type and current state of the session (Active or Backup)
Hostname: Name of the Edge participating in the session
Circuit: Name of the circuit used for the session
Uptime: Duration the session has been continuously active
Connectivity Status: Current operational state of the session (Up or Down)
Source: Originating IP information for the session, including public and/or private addresses
Destination: Target IP address for the session
Region Details
If a Region is selected, the following Details will be shown:
Session Type: Indicates the type and current state of the session (Active or Backup)
Hostname: Name of the Edge participating in the session
Circuit: Name of the circuit used for the session
Uptime: Duration the session has been continuously active
Connectivity Status: Current operational state of the session (Up or Down)
Source: Originating IP information for the session, including public and/or private addresses
Destination: Target IP address for the session
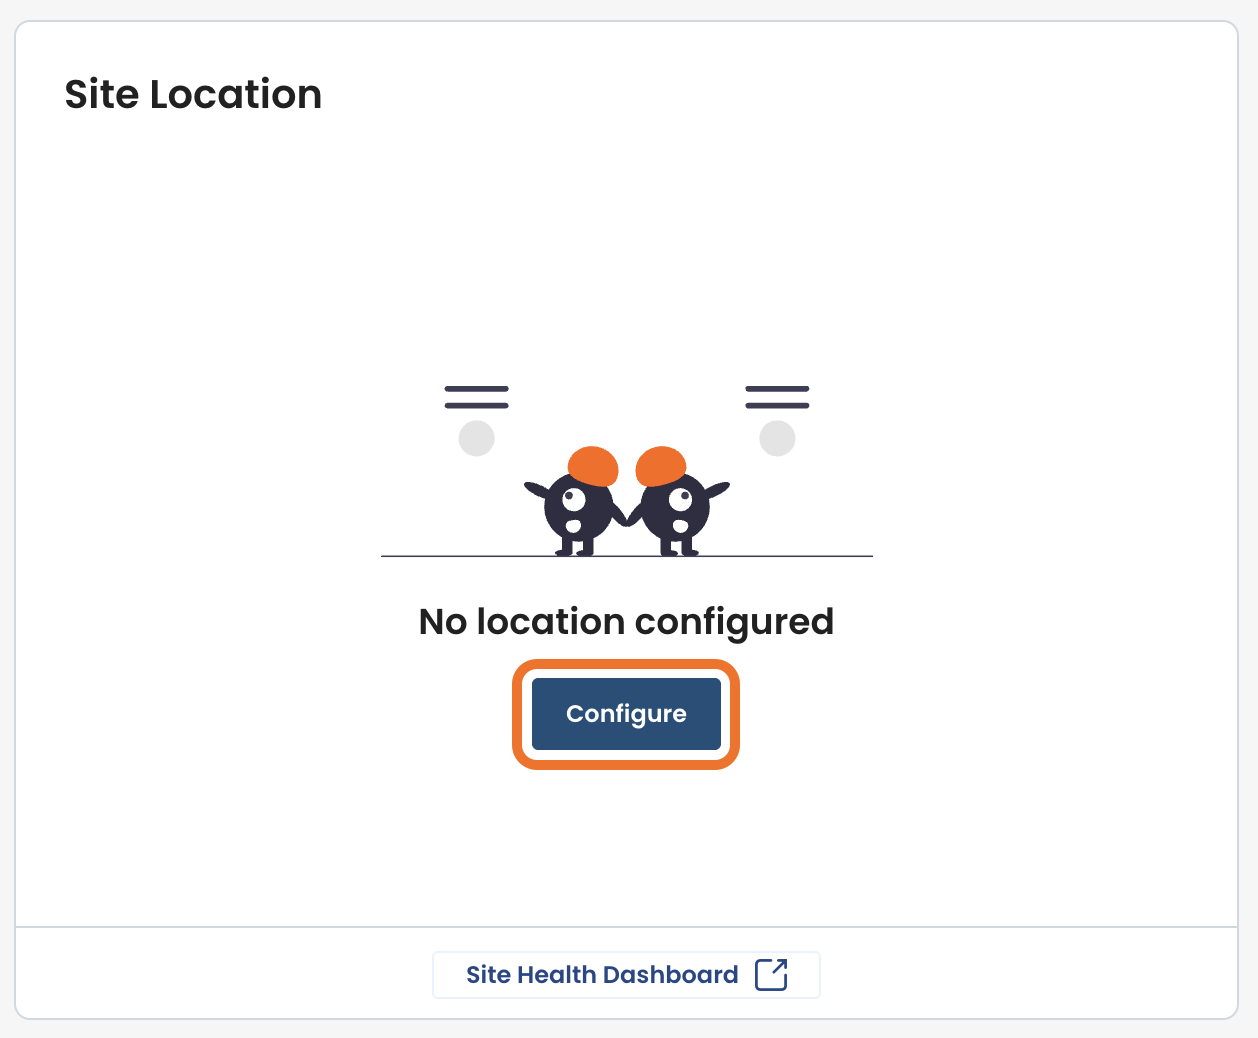
Site Location
The Site Location section displays the configured physical location of the Edge.
If the location is not configured:
A message will state “No location configured”.
To configure a location, click ‘Configure’, and enter the desired address.
Configuring the site location improves operational context, especially in multi-site environments.
Note:
The link to the Site Health Dashboard at the bottom of this section can be used to further check site and connectivity information.
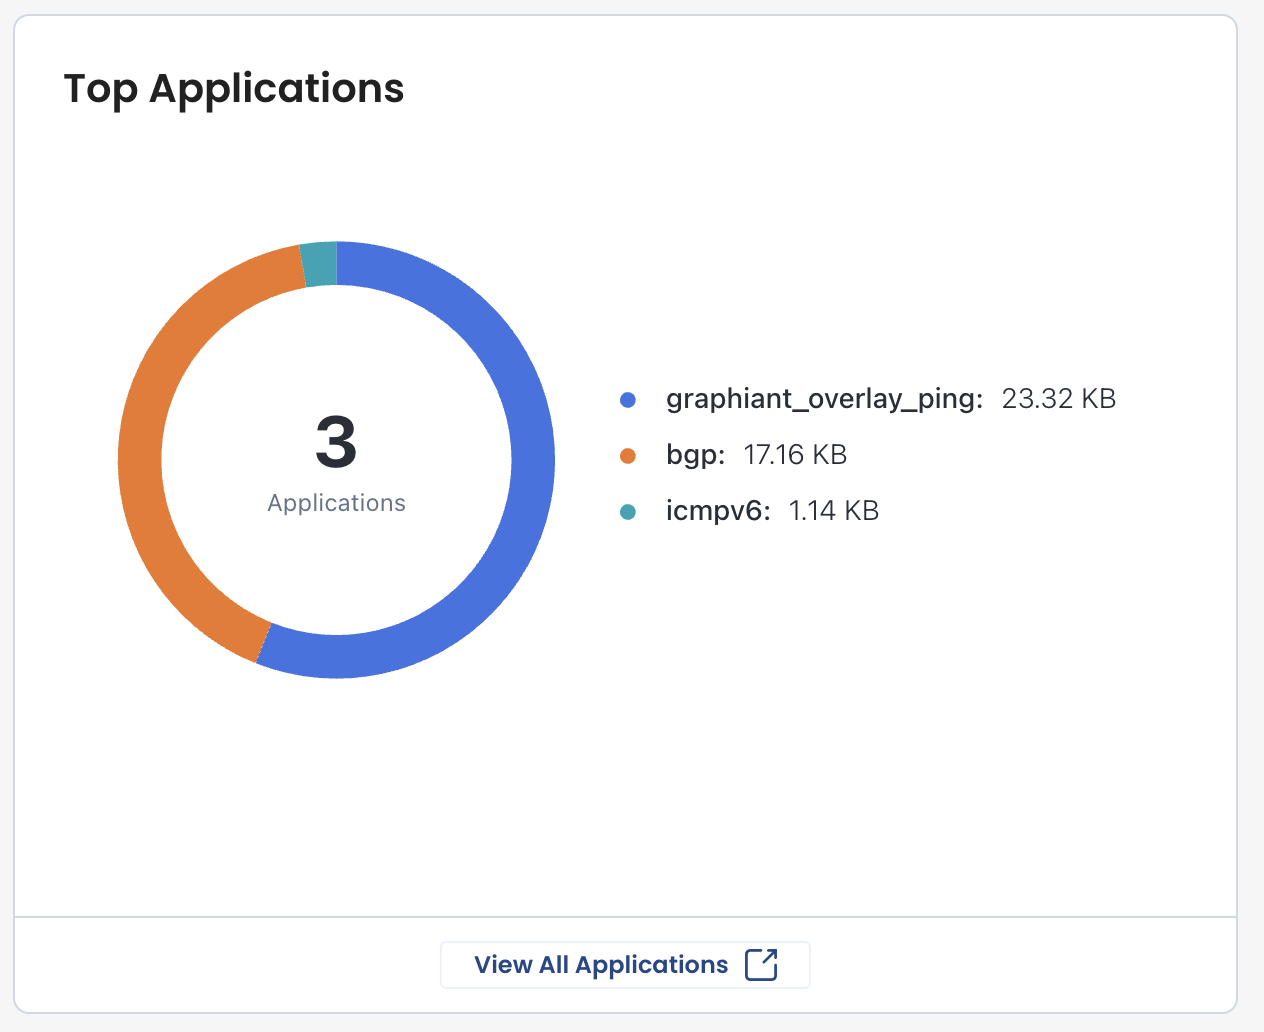
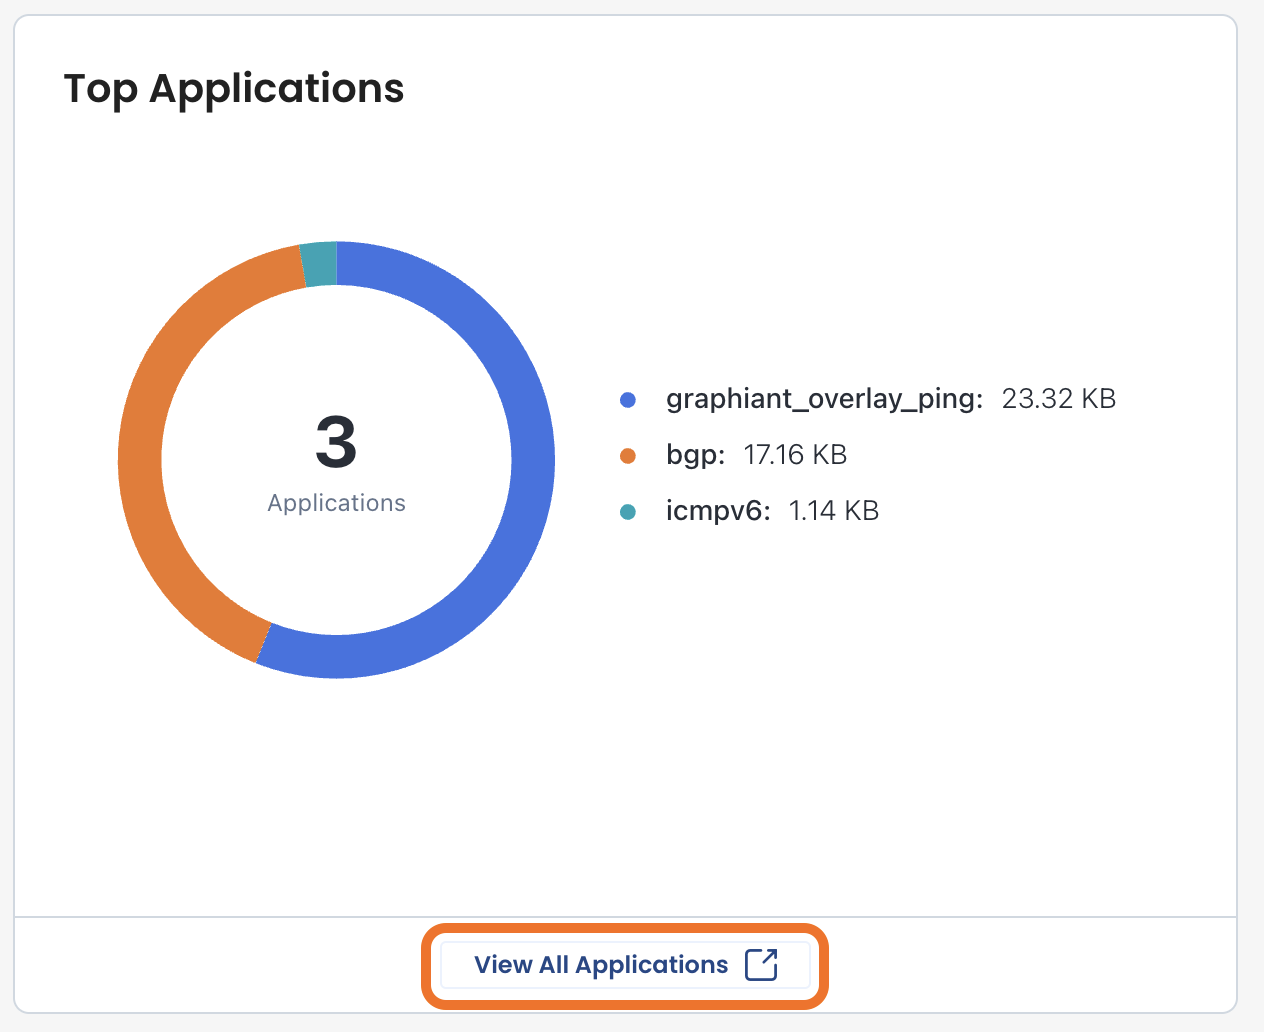
Top Applications
The Top Applications section provides a visual breakdown of app usage, showing the distribution of application traffic and the most active apps by volume.
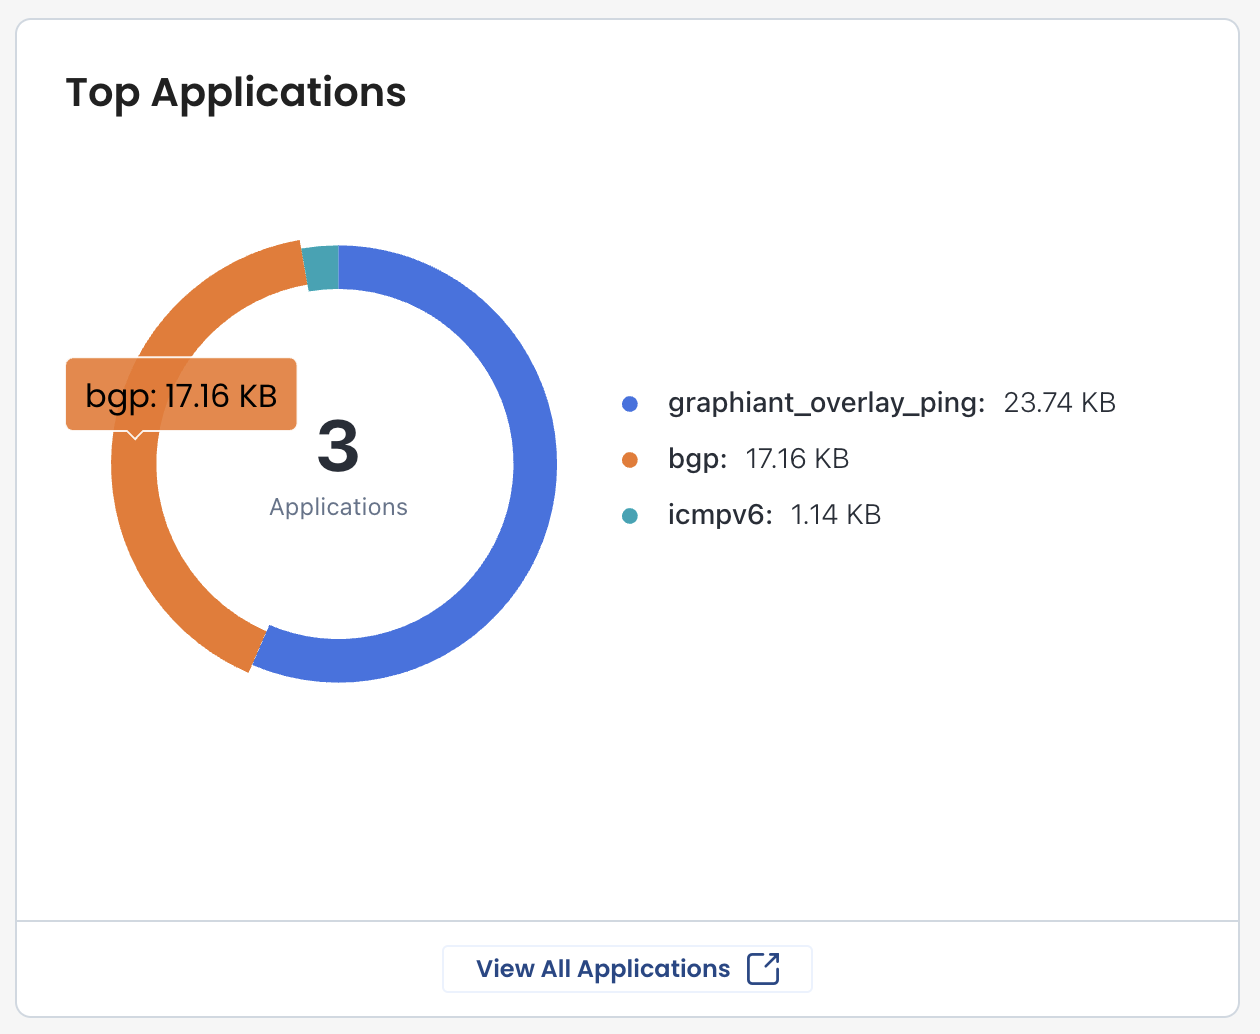
Hovering over any section of the donut chart will provide a quick look at the volume of traffic that has been utilized by that specific application.
Use this donut chart to quickly identify:
Dominant traffic patterns
Unexpected application usage
Workload change
Potential misuse of network resources
To view every application used by this Edge click ‘View All Applications’ at the bottom.
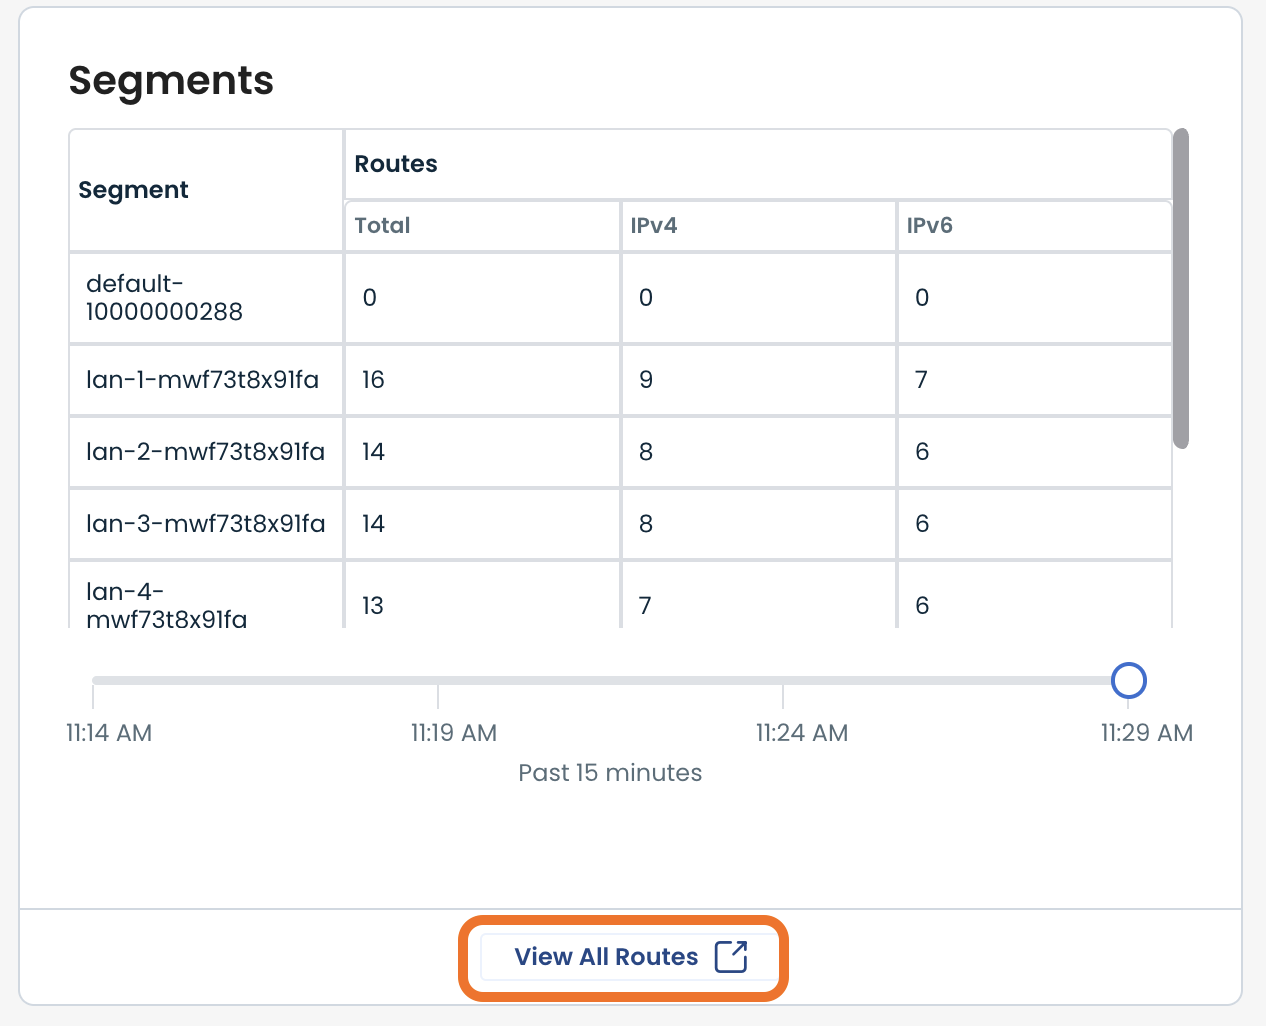
Segments
The Segments section summarizes segmentation and routing activity.
Here you can see each LAN segment along with its routes — total, IPv4, and IPv6.
Using the slider at the bottom will give you a snapshot view of the routes for that time.
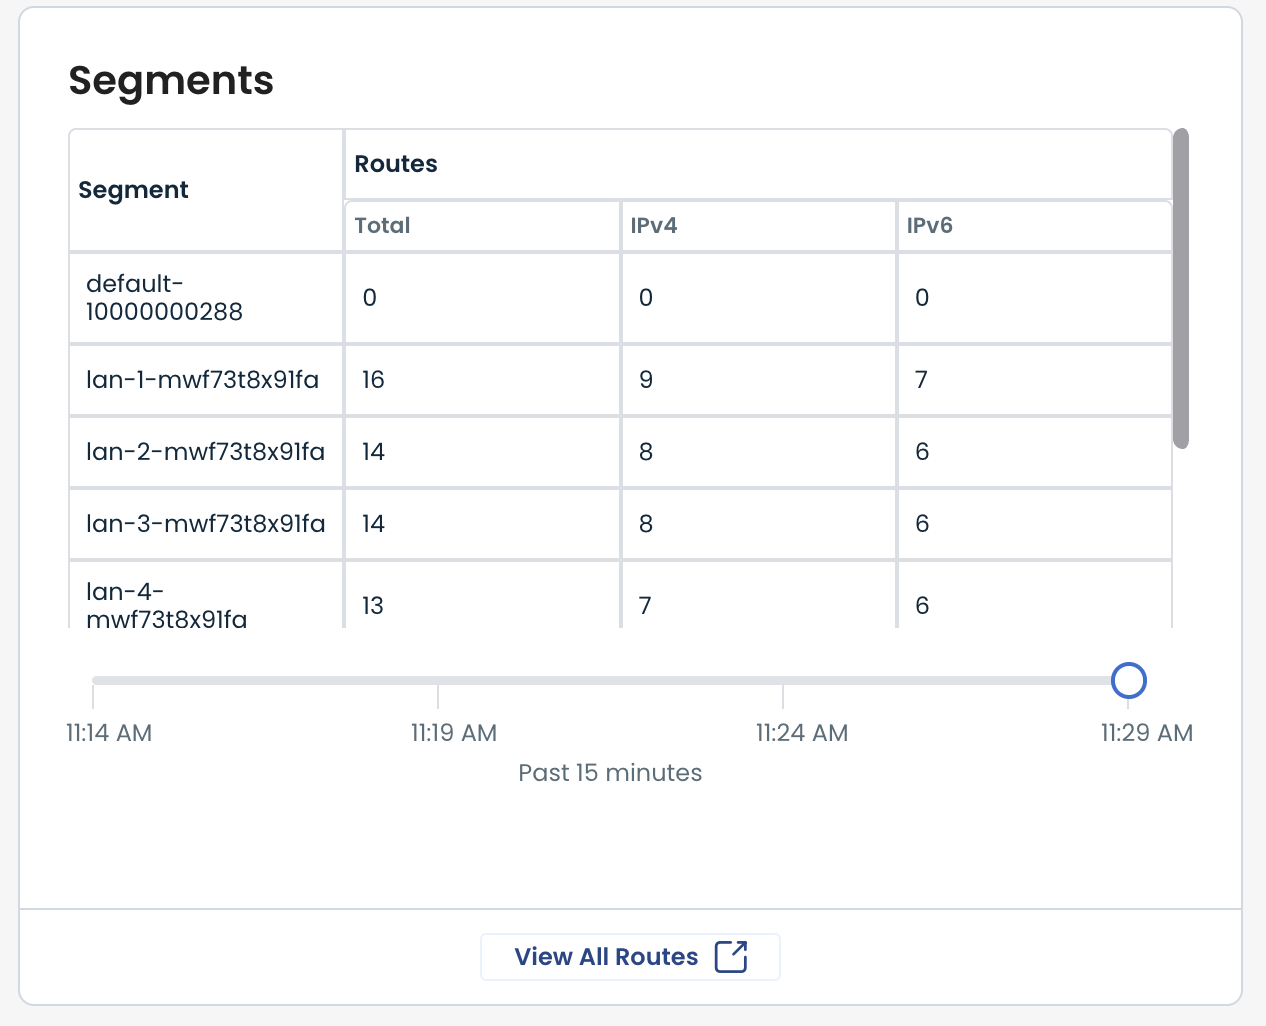
To see all routes and their details, click ‘View All Routes’ at the bottom.
Top Talkers
The Top Talkers section identifies the highest traffic-generating endpoints to which the Edge has communicated.
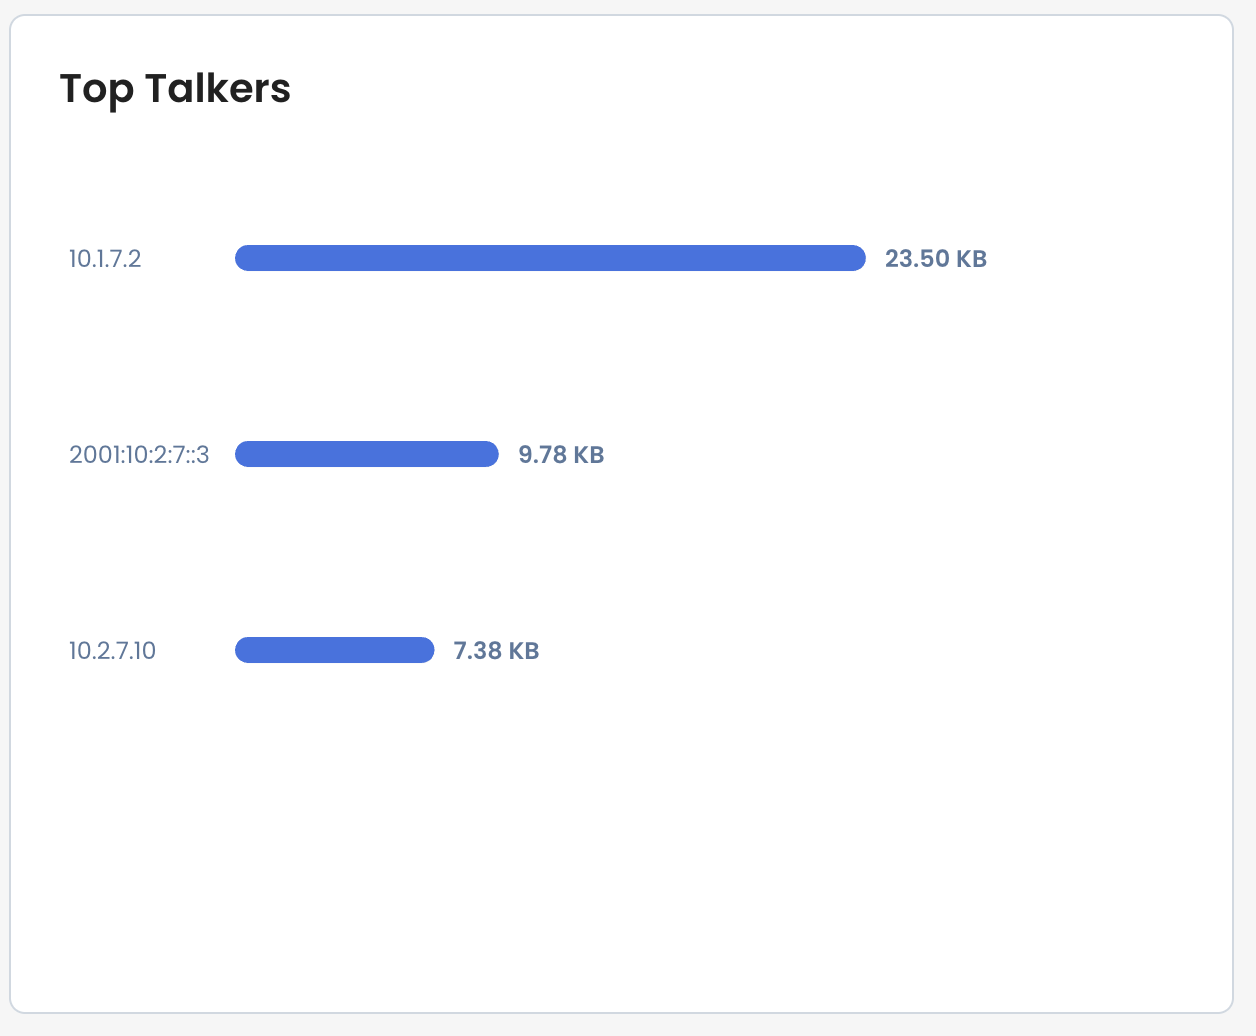
This can be useful for quickly identifying heavy users or investigating abnormal traffic spikes.
Unexpected top talkers may indicate misconfigured devices, large data transfers, or potential security concerns.
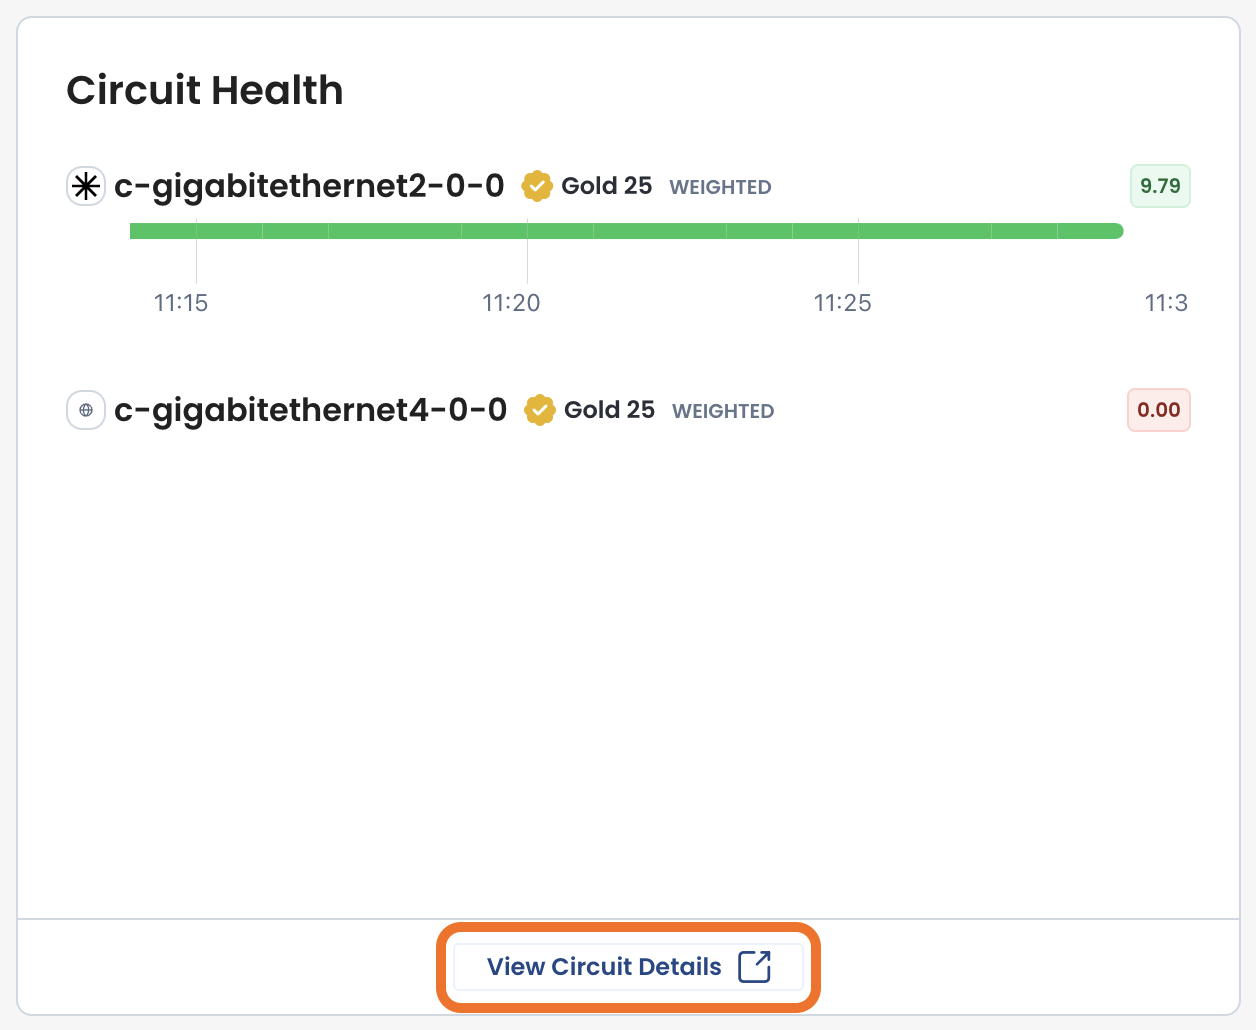
Circuit Health
The Circuit Health section shows the operational status of Edge circuits over time, and shows each circuit’s health and timeline of stability.
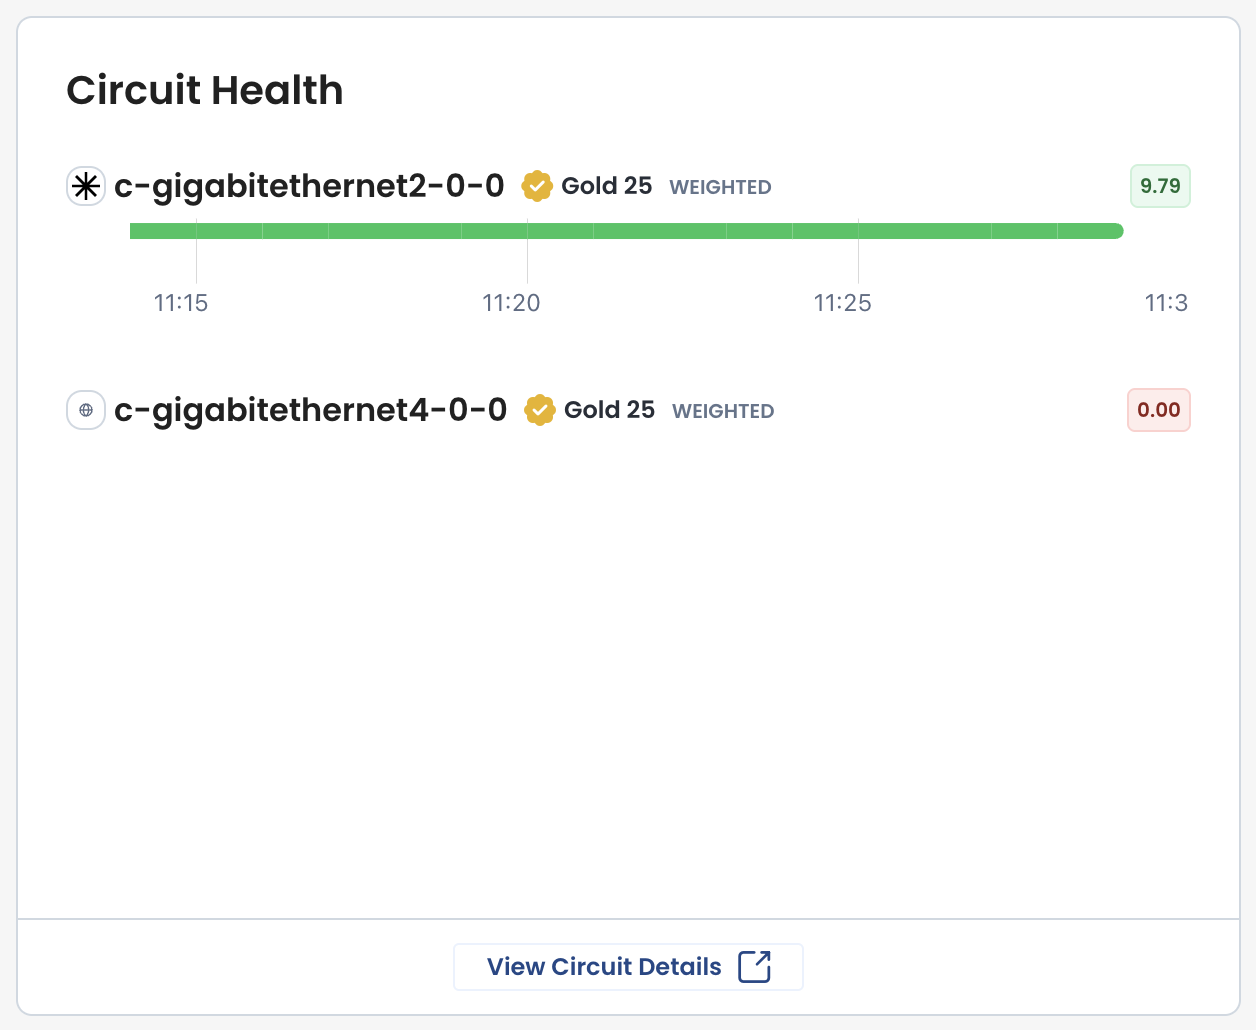
To get further information on the circuits, click ‘View Circuit Details’ at the bottom.
Circuit Utilization
The Circuit Utilization section tracks bandwidth usage over time.
Here you can see both ingress and egress traffic trends.
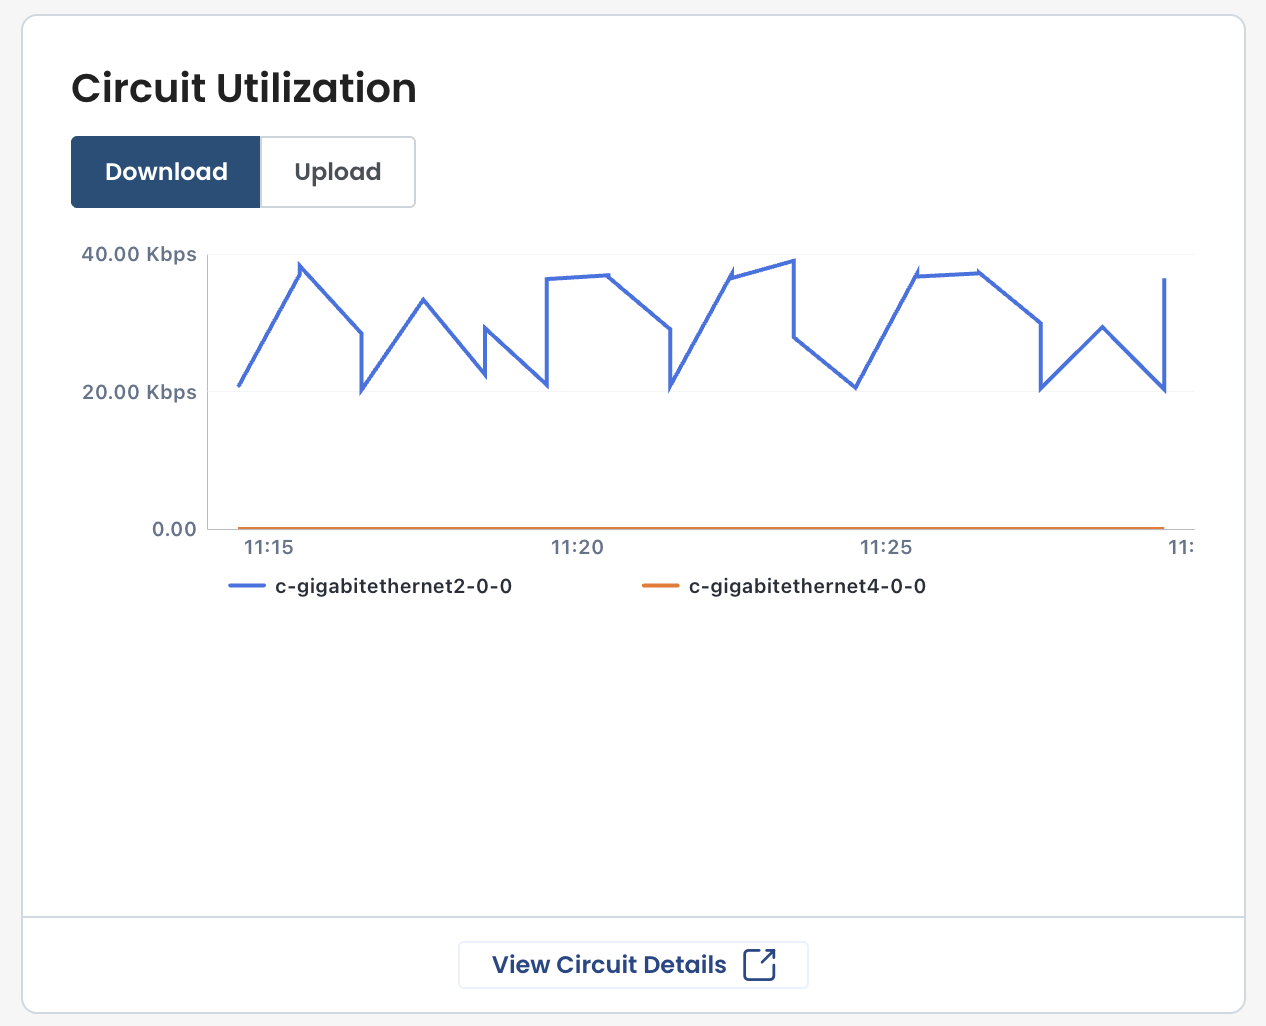
To get further information on the circuits, click ‘View Circuit Details’ at the bottom.
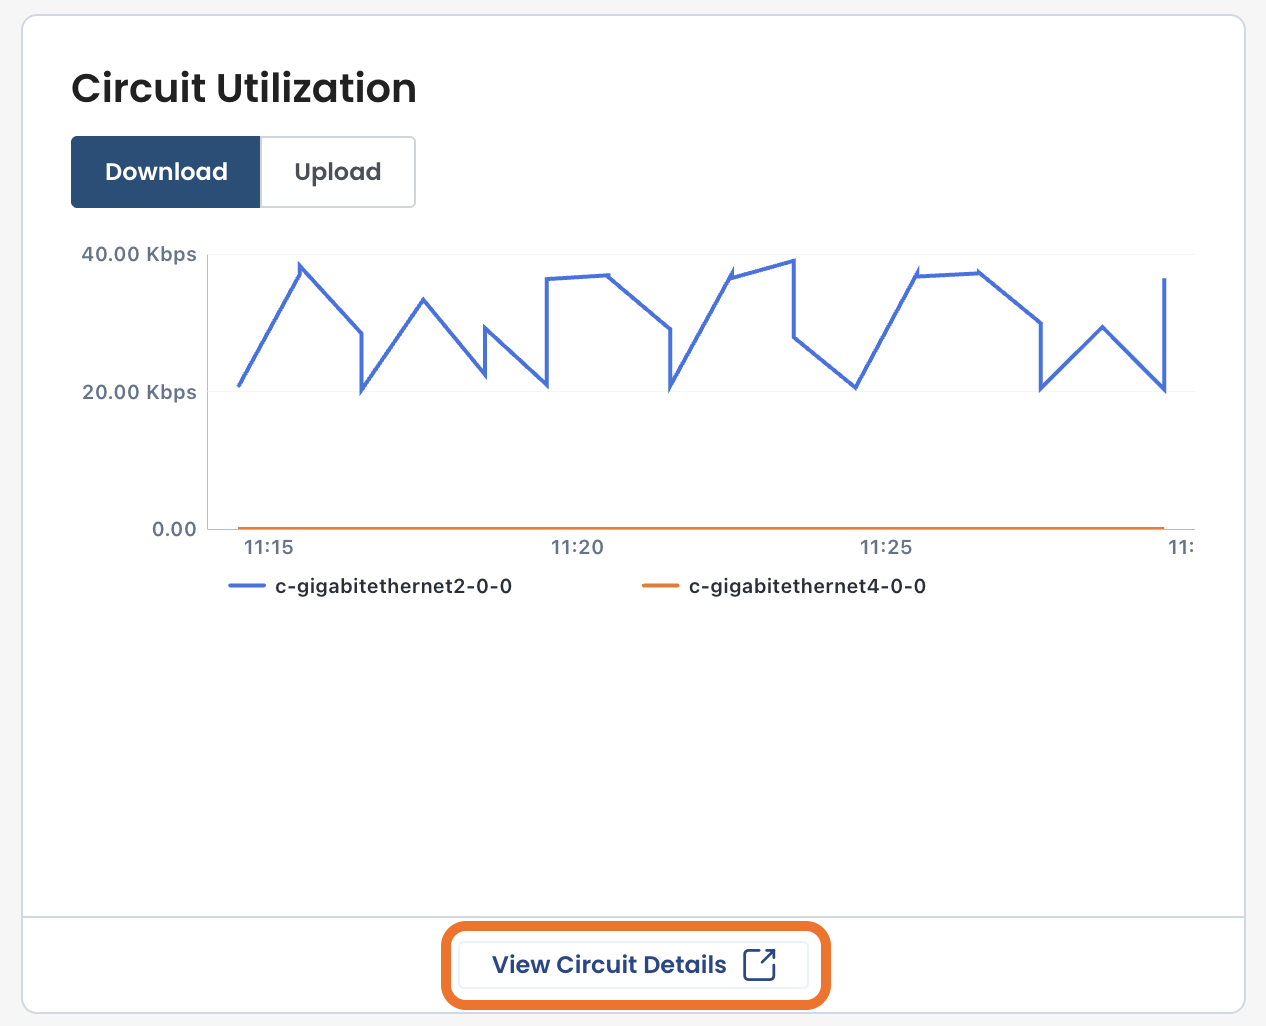
Use this panel to identify peak usage times and determine if additional capacity is needed.
Sustained high utilization may lead to performance degradation and should be evaluated for scaling.