Graphiant performs failover testing on a yearly basis and publishes the performance results.
The failover recovery time for each event is calculated using both Ping and iPerf3 TCP.
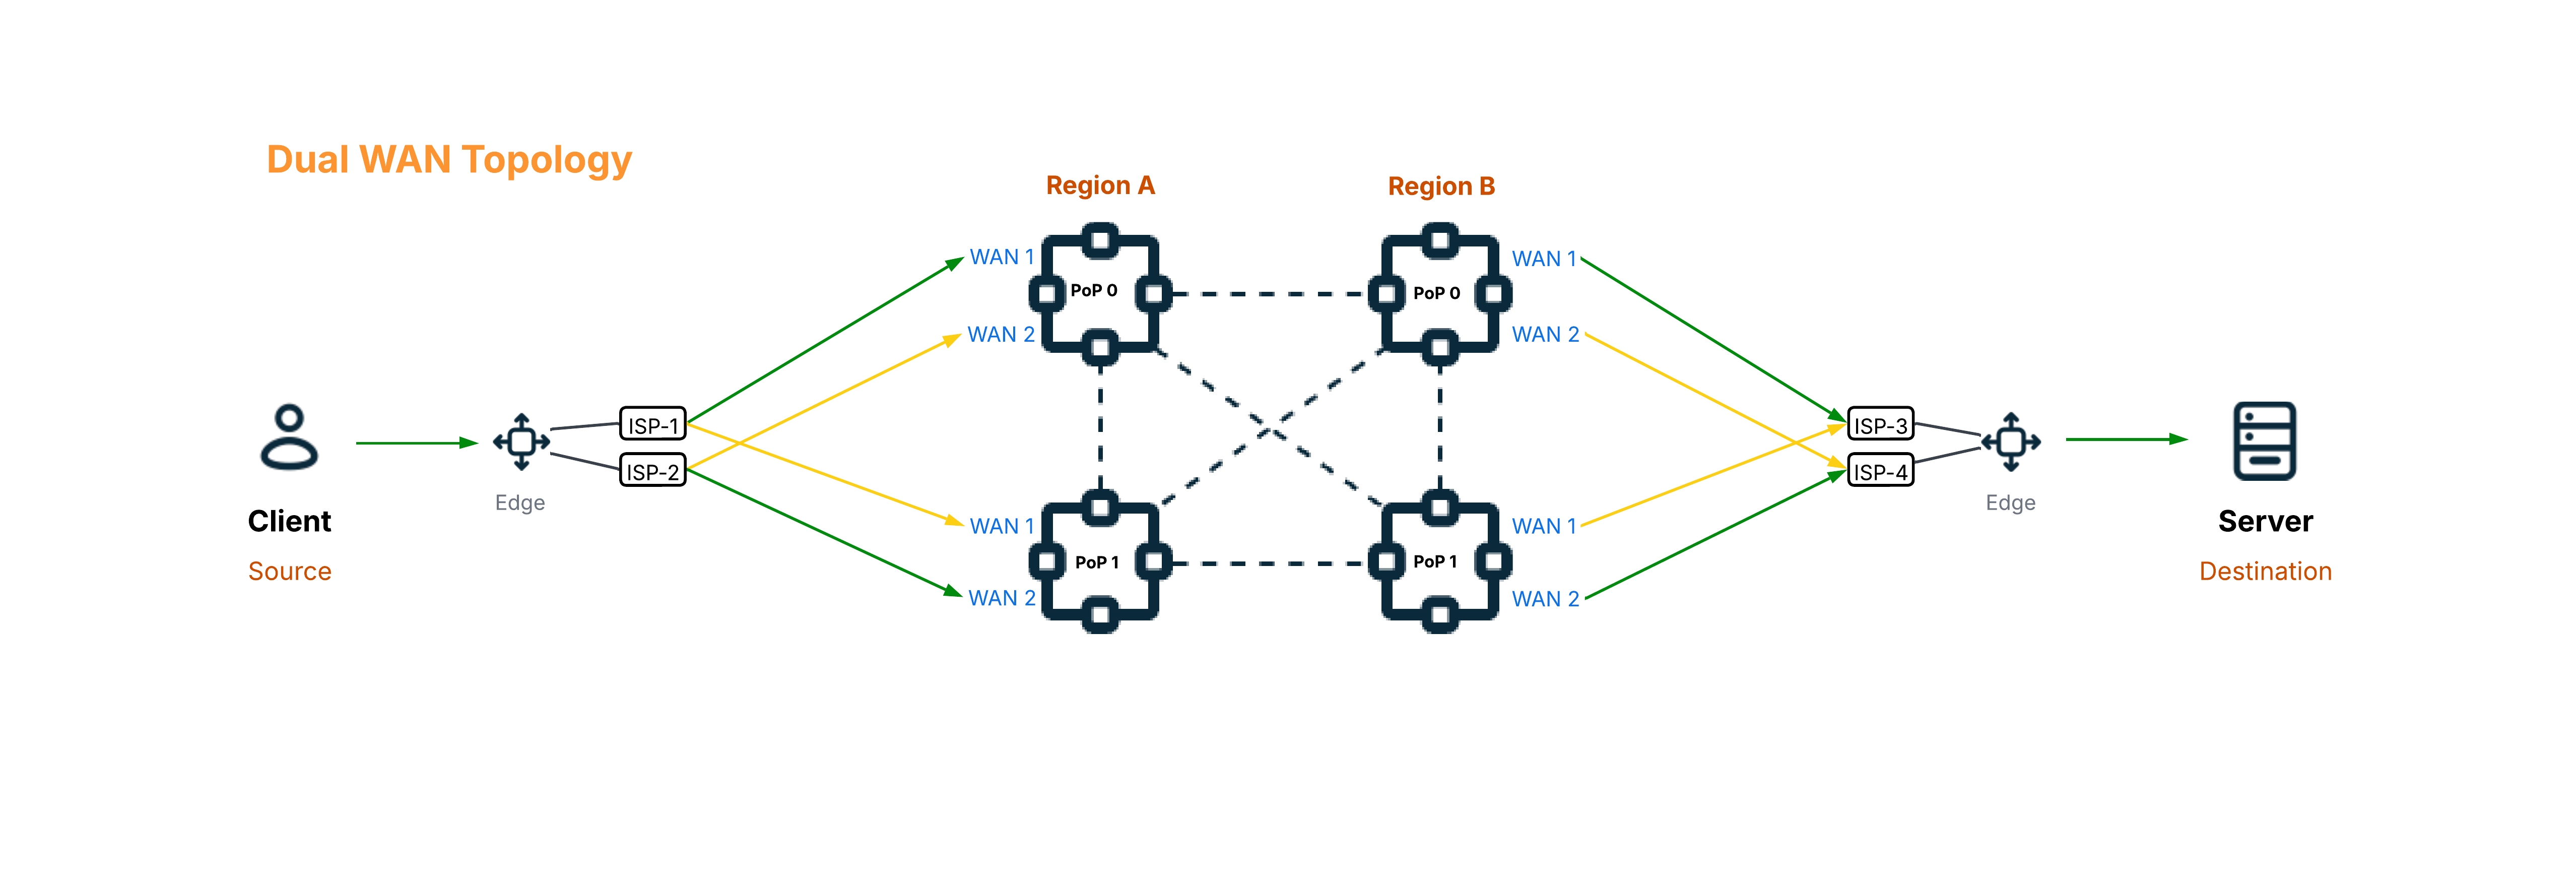
Initial Topologies
The two base topologies tested are as follows, where:
Green arrows = Primary path
Yellow arrows = Backup path
.png)
Tests Performed
The failover tests performed measure recovery time for:
Three events performed sequentially, cumulatively building on each prior event:
WAN Circuit Failure (Event 1)
PoP Failure (Event 2)
Region Failure (Event 3)
A simultaneous test of all three above events occurring at once:
Immediate Region Failure (Event 4)
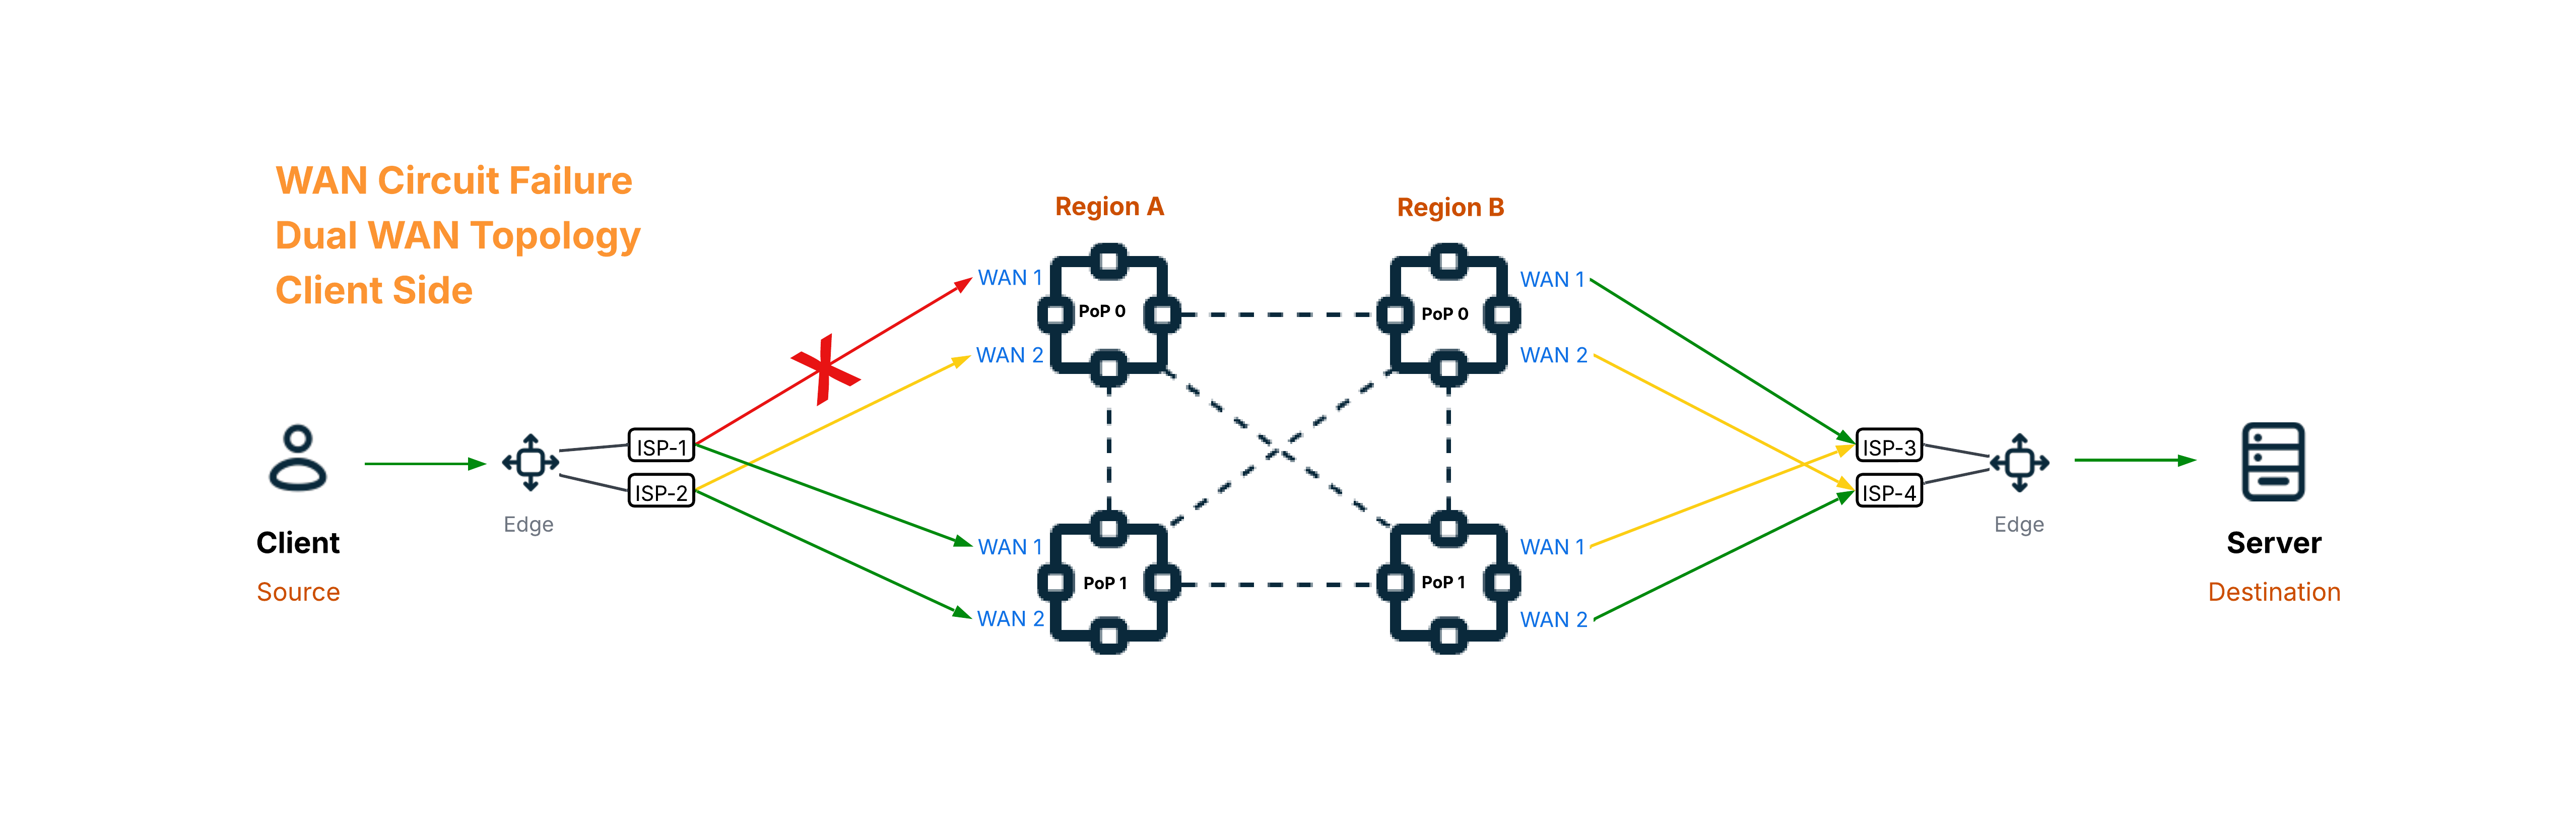
WAN Circuit Failure Test (Event 1)
In a WAN Circuit failure test, a WAN connection from the Edge to the Core is brought down.
WAN Circuit Failure in Single WAN
Topology
In the case of a single WAN topology experiencing a primary WAN disconnection, the traffic will move:
From: The primary path to/from the Graphiant PoP
To: The backup path to/from the other PoP in that same region.
Red arrows = Blocked path
Green arrows = New Primary path
Yellow arrows = Backup path
.png)
.png)
Performance Results: WAN Circuit Failure (Event 1) in Single WAN Topology
Year | Topology | Ping Recovery Time (seconds) | Iperf3 TCP Recovery Time (seconds) |
|---|---|---|---|
2024 | Client Side | 3 | 3 |
2024 | Server Side | 4 | 2 |
Year | Topology | Ping Recovery Time (seconds) | Iperf3 TCP Recovery Time (seconds) |
2025 | Client Side | 3 | 3 |
2025 | Server Side | 2 | 3 |
WAN Circuit Failure in Dual WAN
Topology
In the case of a dual WAN topology experiencing a primary WAN disconnection, the traffic will move:
From: The primary path to/from the Graphiant PoP
To: The backup path to/from the other PoP within the same Graphiant region.
Red arrows = Blocked path
Green arrows = New Primary path
Yellow arrows = Backup path
.png)
Performance Results: WAN Circuit Failure (Event 1) in Dual WAN Topology
Year | Topology | Ping Recovery Time (seconds) | Iperf3 TCP Recovery Time (seconds) |
|---|---|---|---|
2024 | Client Side | 3 | 3 |
2024 | Server Side | 3 | 2.8 |
Year | Topology | Ping Recovery Time (seconds) | Iperf3 TCP Recovery Time (seconds) |
2025 | Client Side | 2 | 2 |
2025 | Server Side | 3 | 3 |
PoP Failure Test (Event 2)
In a PoP failure test, all connections from the Edge to a given PoP are brought down.
PoP Failure in Single WAN
Topology
In the case of a single WAN topology PoP disconnection:
This is the same topology as the WAN circuit failure test, as the prior disconnection of the single WAN circuit results in that PoP no longer being reachable.
Red arrows = Blocked path
Green arrows = New Primary path
Yellow arrows = Backup path
.png)
.png)
Performance Results: PoP Failure (Event 2) in Single WAN Topology
Year | Topology | Ping Recovery Time (seconds) | Iperf3 TCP Recovery Time (seconds) |
|---|---|---|---|
2024 | Client Side | 0 | 0 |
2024 | Server Side | 0 | 0 |
Year | Topology | Ping Recovery Time (seconds) | Iperf3 TCP Recovery Time (seconds) |
2025 | Client Side | 0 | 0 |
2025 | Server Side | 0 | 0 |
PoP Failure in Dual WAN
Topology
In the case of a dual WAN topology, the original backup path to the PoP will be brought down, secondarily to the primary WAN circuit disconnect.
The traffic will move:
From: The primary path (originally the backup path prior to Event 1) to/from the primary PoP
To: The backup path to/from the other PoP within that same region.
Red arrows = Blocked path
Green arrows = New Primary path
Yellow arrows = Backup path
.png)
.png)
Performance Results: PoP Failure (Event 2) in Dual WAN Topology
Year | Topology | Ping Recovery Time (seconds) | Iperf3 TCP Recovery Time (seconds) |
|---|---|---|---|
2024 | Client Side | 0 | 0 |
2024 | Server Side | 0 | 0 |
Year | Topology | Ping Recovery Time (seconds) | Iperf3 TCP Recovery Time (seconds) |
2025 | Client Side | 0 | 0 |
2025 | Server Side | 0 | 0 |
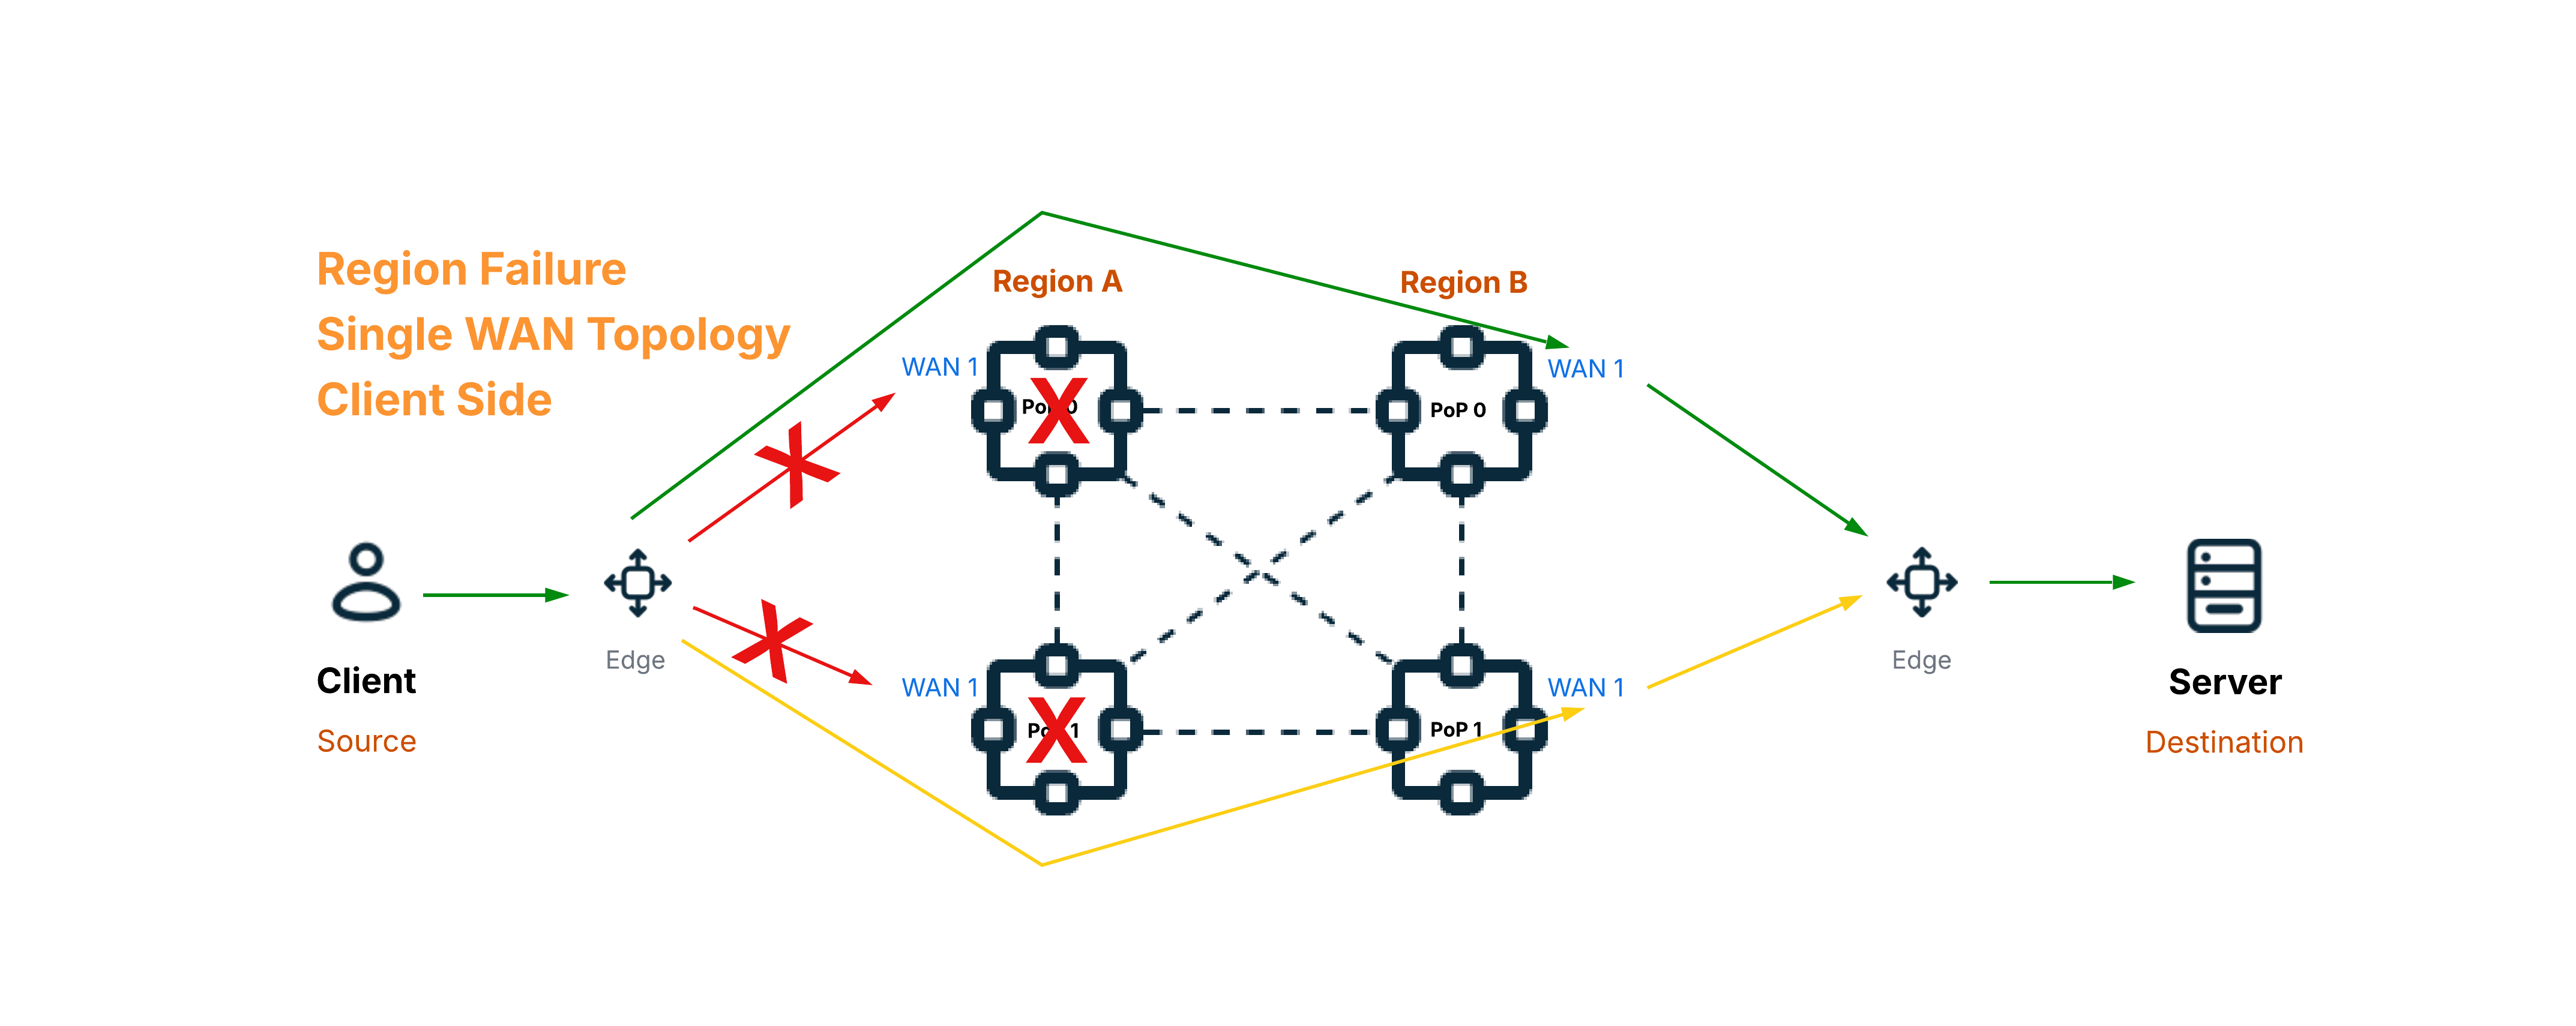
Region Failure Test (Event 3)
In a Region failure test, all connections from the Edge to the secondary PoP in a given region in the Graphiant Core are brought down.
Region Failure in Single WAN
Topology
In the case of a single WAN topology, the path to the secondary PoP in the region will be brought down, secondarily to the primary PoP disconnect.
The traffic will move:
From: The primary path (originally the backup path prior to Event 1) to/from the secondary PoP
To: The path to/from the next closest PoP in a different region within the Graphiant Core.
Red arrows = Blocked path
Green arrows = New Primary path
Yellow arrows = Backup path
.png)
Performance Results: Region Failure (Event 3) in Single WAN Topology
Year | Topology | Ping Recovery Time (seconds) | Iperf3 TCP Recovery Time (seconds) |
|---|---|---|---|
2024 | Client Side | 81 | 110 |
2024 | Server Side | 81 | 110 |
Year | Topology | Ping Recovery Time (seconds) | Iperf3 TCP Recovery Time (seconds) |
2025 | Client Side | 76 | 108 |
2025 | Server Side | 78 | 111 |
Region Failure in Dual WAN
Topology
In the case of a dual WAN topology, the paths to the secondary PoP in the region will be brought down, secondarily to the primary PoP disconnect.
The traffic will move:
From: The primary path (originally the backup path prior to Event 2) to/from the secondary PoP
To: The path to/from the next closest PoP in a different region within the Graphiant Core.
Red arrows = Blocked path
Green arrows = New Primary path
Yellow arrows = Backup path
.png)
.png)
Performance Results: Region Failure (Event 3) in Dual WAN Topology
Year | Topology | Ping Recovery Time (seconds) | Iperf3 TCP Recovery Time (seconds) |
|---|---|---|---|
2024 | Client Side | 58 | 112 |
2024 | Server Side | 68 | 111 |
Year | Topology | Ping Recovery Time (seconds) | Iperf3 TCP Recovery Time (seconds) |
2025 | Client Side | 59 | 111 |
2025 | Server Side | 52 | 56 |
Immediate Region Failure Test (Event 4)
In an Immediate Region failure test, all connections from the Edge to a given region in the Graphiant Core are brought down simultaneously.
Immediate Region Failure in Single WAN
Topology
In the case of a single WAN topology, after the region is immediately unreachable:
The traffic will move:
From: The path to the primary PoP within a given region
To: The next closest PoP in a different region within the Graphiant Core.
Red arrows = Blocked path
Green arrows = New Primary path
Yellow arrows = Backup path
Performance Results: Immediate Region Failure (Event 4) in Single WAN Topology
Year | Topology | Ping Recovery Time (seconds) | Iperf3 TCP Recovery Time (seconds) |
|---|---|---|---|
2024 | Client Side | 71 | 112 |
2024 | Server Side | 83 | 114 |
Year | Topology | Ping Recovery Time (seconds) | Iperf3 TCP Recovery Time (seconds) |
2025 | Client Side | 68 | 108 |
2025 | Server Side | 84 | 107 |
Immediate Region Failure in Dual WAN
Topology
In the case of a dual WAN topology, after the region is immediately unreachable:
The traffic will move:
From: The primary path to the primary PoP within a given region
To: The next closest PoP in a different region within the Graphiant Core.
Red arrows = Blocked path
Green arrows = New Primary path
Yellow arrows = Backup path
Performance Results: Immediate Region Failure (Event 4) in Dual WAN Topology
Year | Topology | Ping Recovery Time (seconds) | Iperf3 TCP Recovery Time (seconds) |
|---|---|---|---|
2024 | Client Side | 73 | 115 |
2024 | Server Side | 66 | 113 |
Year | Topology | Ping Recovery Time (seconds) | Iperf3 TCP Recovery Time (seconds) |
2025 | Client Side | 70 | 112 |
2025 | Server Side | 83 | 108 |
Complete Performance Results per Topology
Single WAN, Failure on Client Side
Year | Event # | Event Type | Ping Recovery Time (seconds) | Iperf3 TCP Recovery Time (seconds) |
|---|---|---|---|---|
2024 | 1 | WAN Circuit Failure | 3 | 3 |
2024 | 2 | add PoP Failure | 0 | 0 |
2024 | 3 | add Region Failure | 81 | 110 |
2024 | 4 | Immediate Region Failure | 71 | 112 |
Year | Event # | Event Type | Ping Recovery Time (seconds) | Iperf3 TCP Recovery Time (seconds) |
2025 | 1 | WAN Circuit Failure | 3 | 3 |
2025 | 2 | add PoP Failure | 0 | 0 |
2025 | 3 | add Region Failure | 76 | 108 |
2025 | 4 | Immediate Region Failure | 68 | 108 |
Single WAN, Failure on Server Side
Year | Event # | Event Type | Ping Recovery Time (seconds) | Iperf3 TCP Recovery Time (seconds) |
|---|---|---|---|---|
2024 | 1 | WAN Circuit Failure | 4 | 2 |
2024 | 2 | add PoP Failure | 0 | 0 |
2024 | 3 | add Region Failure | 81 | 110 |
2024 | 4 | Immediate Region Failure | 83 | 114 |
Year | Event # | Event Type | Ping Recovery Time (seconds) | Iperf3 TCP Recovery Time (seconds) |
2025 | 1 | WAN Circuit Failure | 2 | 3 |
2025 | 2 | add PoP Failure | 0 | 0 |
2025 | 3 | add Region Failure | 78 | 111 |
2025 | 4 | Immediate Region Failure | 84 | 107 |
Dual WAN, Failure on Client Side
Year | Event # | Event Type | Ping Recovery Time (seconds) | Iperf3 TCP Recovery Time (seconds) |
|---|---|---|---|---|
2024 | 1 | WAN Circuit Failure | 3 | 3 |
2024 | 2 | add PoP Failure | 0 | 0 |
2024 | 3 | add Region Failure | 58 | 112 |
2024 | 4 | Immediate Region Failure | 73 | 115 |
Year | Event # | Event Type | Ping Recovery Time (seconds) | Iperf3 TCP Recovery Time (seconds) |
2025 | 1 | WAN Circuit Failure | 2 | 2 |
2025 | 2 | add PoP Failure | 0 | 0 |
2025 | 3 | add Region Failure | 59 | 111 |
2025 | 4 | Immediate Region Failure | 70 | 112 |
Dual WAN, Failure on Server Side
Year | Event # | Event Type | Ping Recovery Time (seconds) | Iperf3 TCP Recovery Time (seconds) |
|---|---|---|---|---|
2024 | 1 | WAN Circuit Failure | 3 | 2.8 |
2024 | 2 | add PoP Failure | 0 | 0 |
2024 | 3 | add Region Failure | 68 | 111 |
2024 | 4 | Immediate Region Failure | 66 | 113 |
Year | Event # | Event Type | Ping Recovery Time (seconds) | Iperf3 TCP Recovery Time (seconds) |
2025 | 1 | WAN Circuit Failure | 3 | 3 |
2025 | 2 | add PoP Failure | 0 | 0 |
2025 | 3 | add Region Failure | 52 | 56 |
2025 | 4 | Immediate Region Failure | 83 | 108 |