Documentation Index

Fetch the complete documentation index at: https://docs.graphiant.com/llms.txt

Use this file to discover all available pages before exploring further.

Graphiant Stateless Core Performance

Prev Next

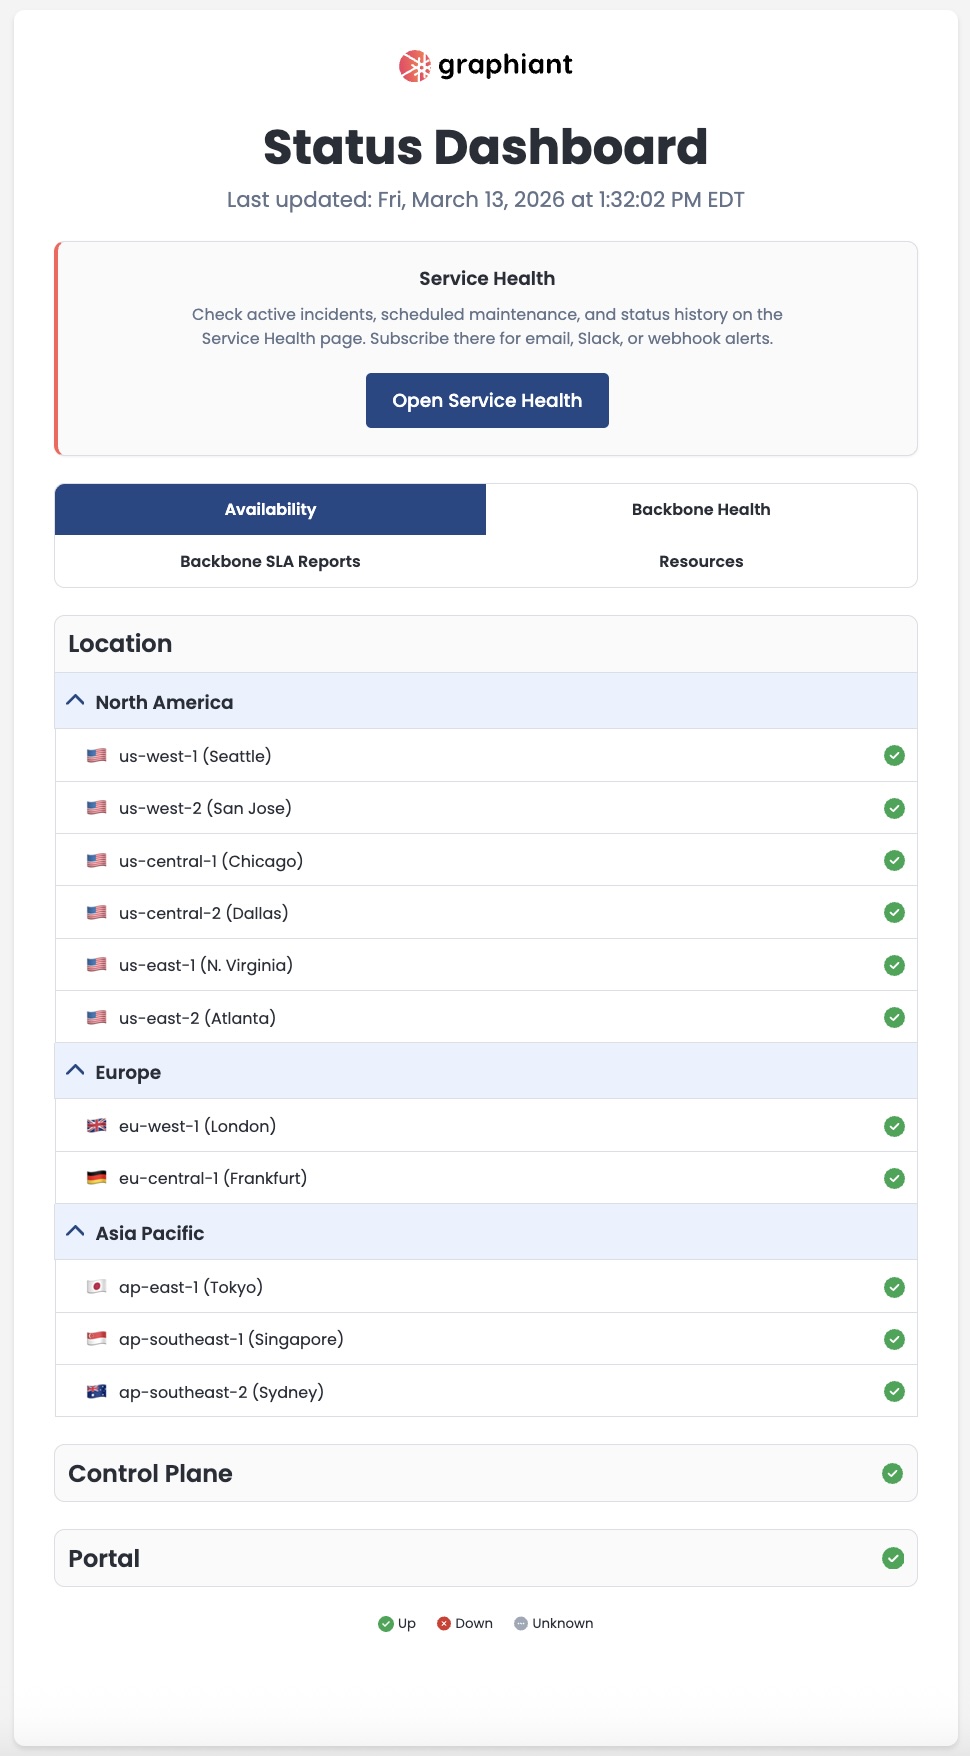
For the current status of the Graphiant network, check out the Graphiant Status Dashboard on our website.

Here you will find details about:
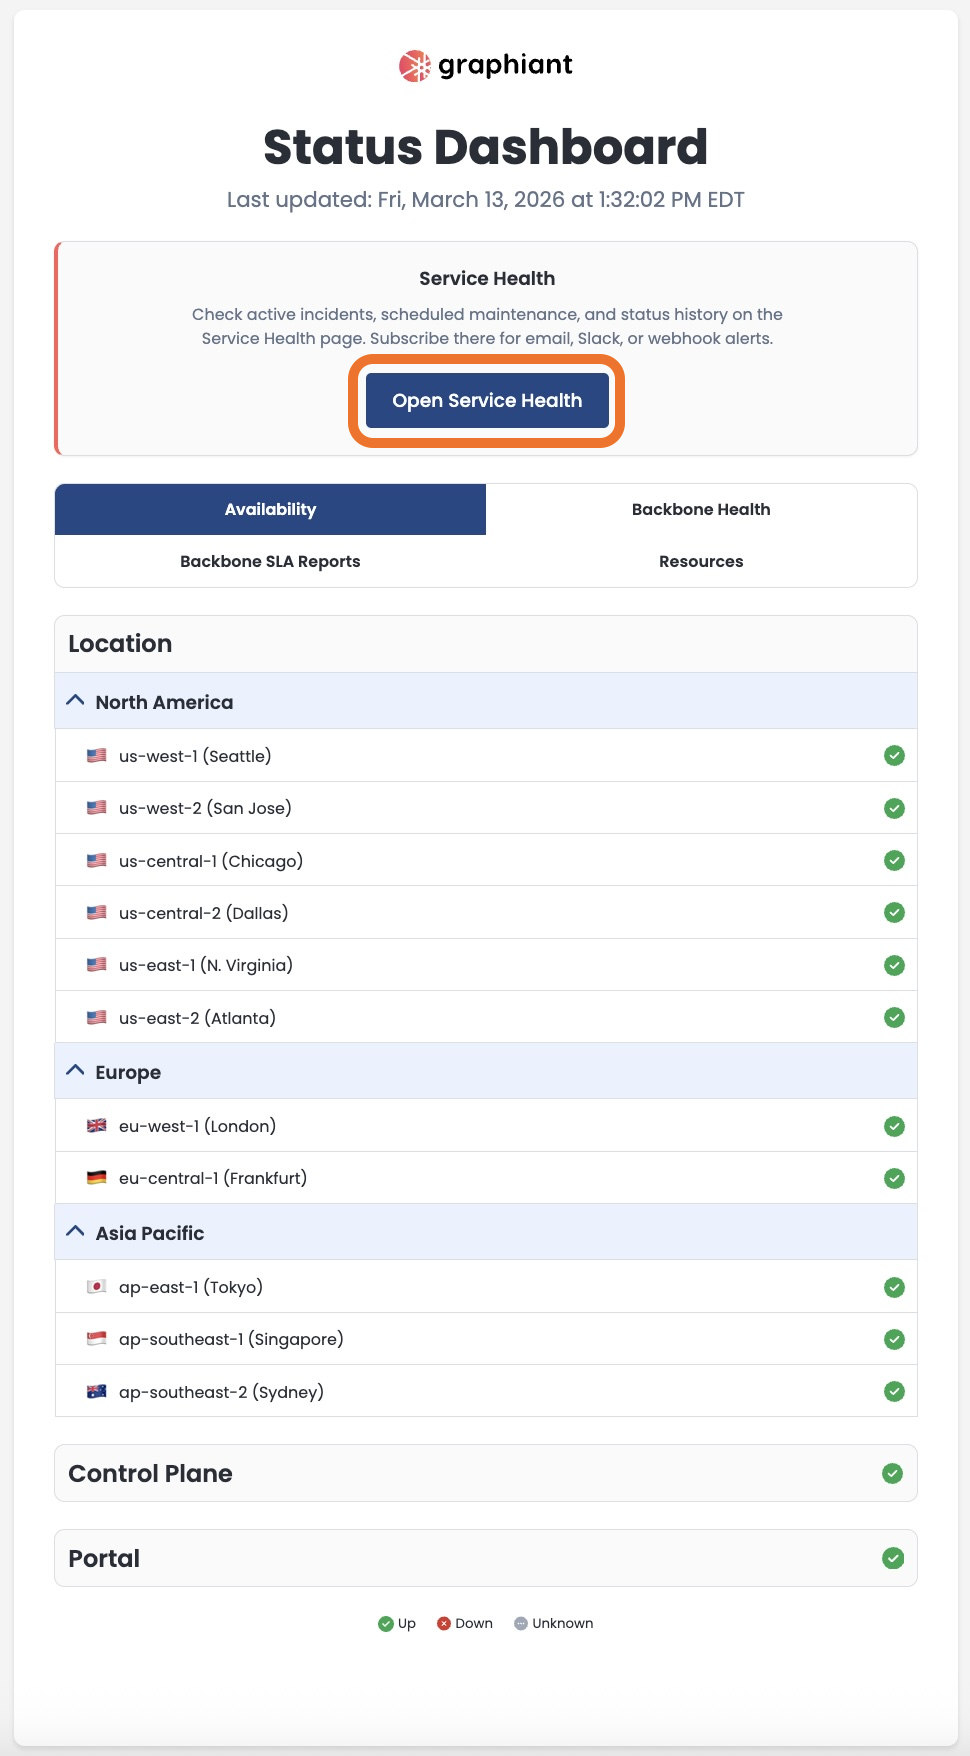
  • Availability

  • Backbone Health

  • Backbone SLA Reports

  • Resources

Maintenance notifications will be shared here as well.

Graphiant status dashboard showing service health and availability across various regions.

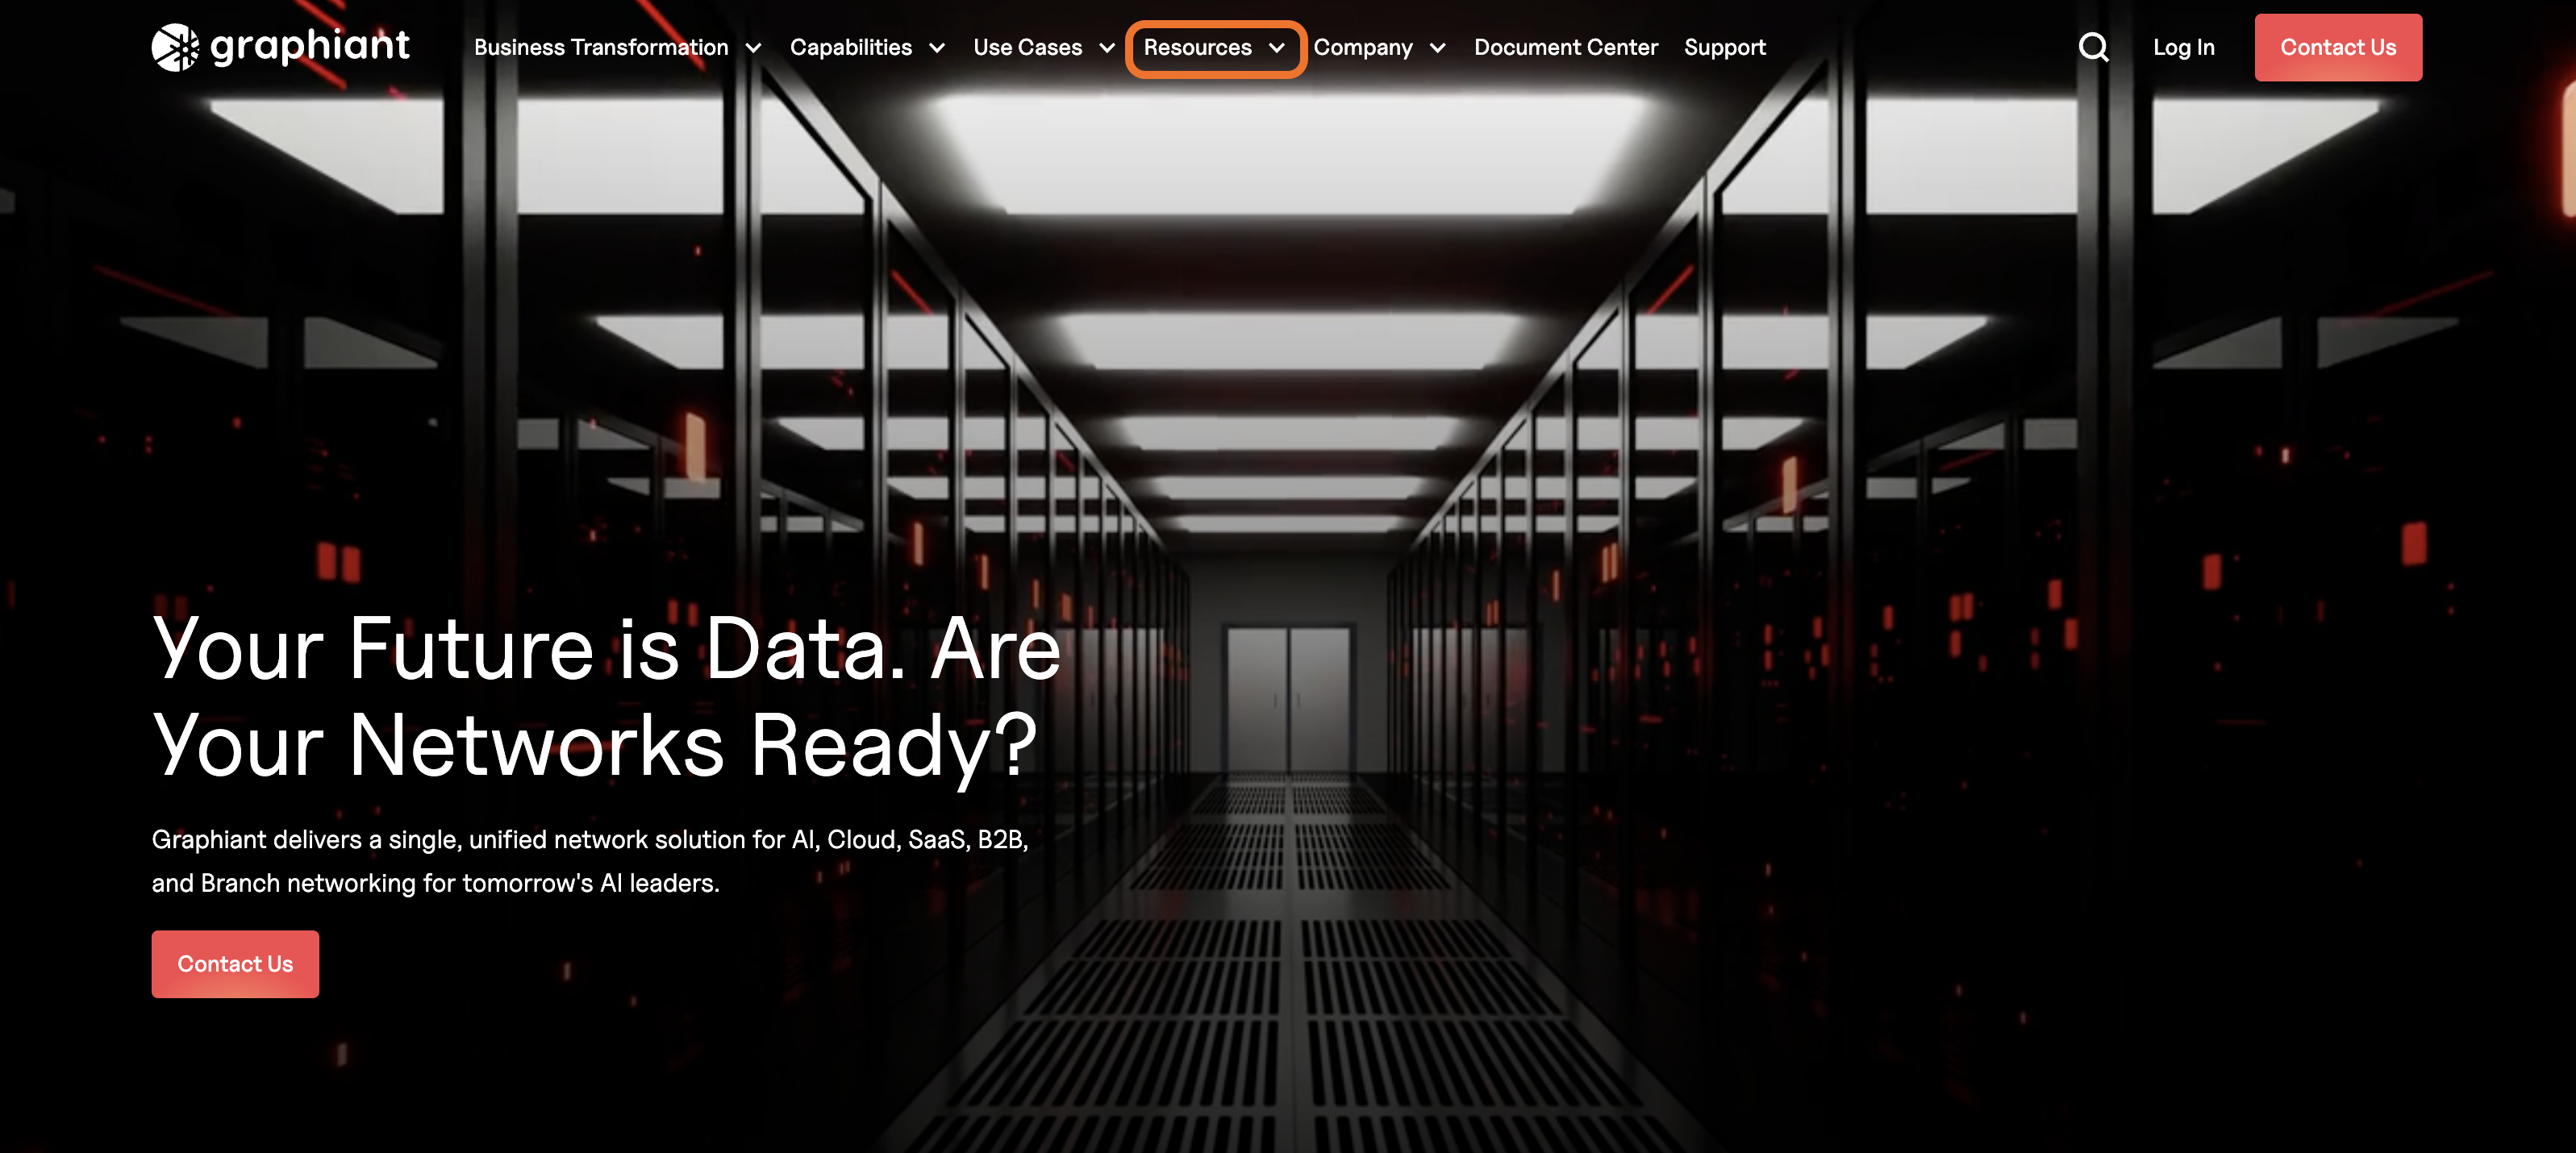
You can view this anytime by going to the Graphiant website and clicking ‘Resources’.

Graphiant's website emphasizes data networks and offers a contact option for inquiries.

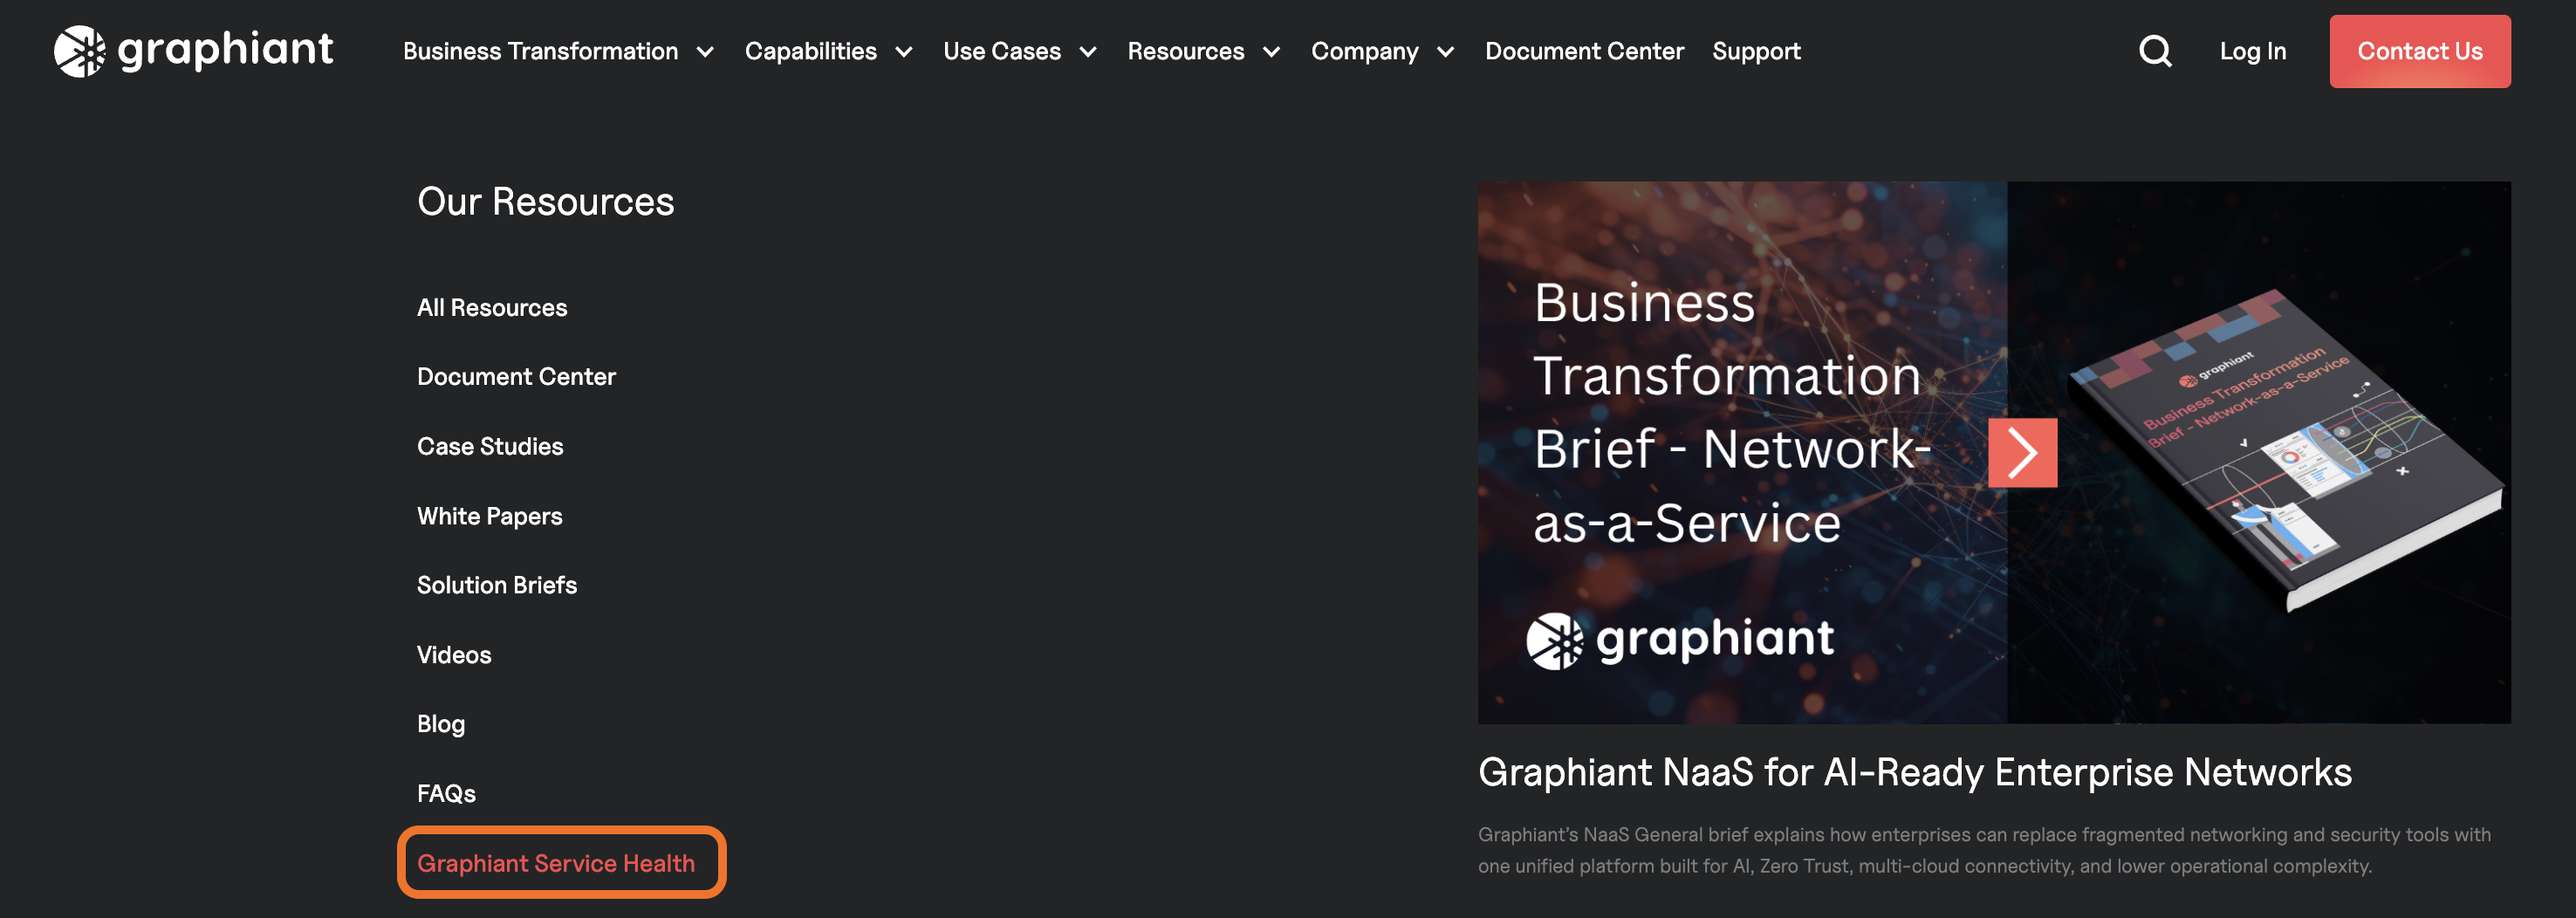
Select ‘Graphiant Service Health’.
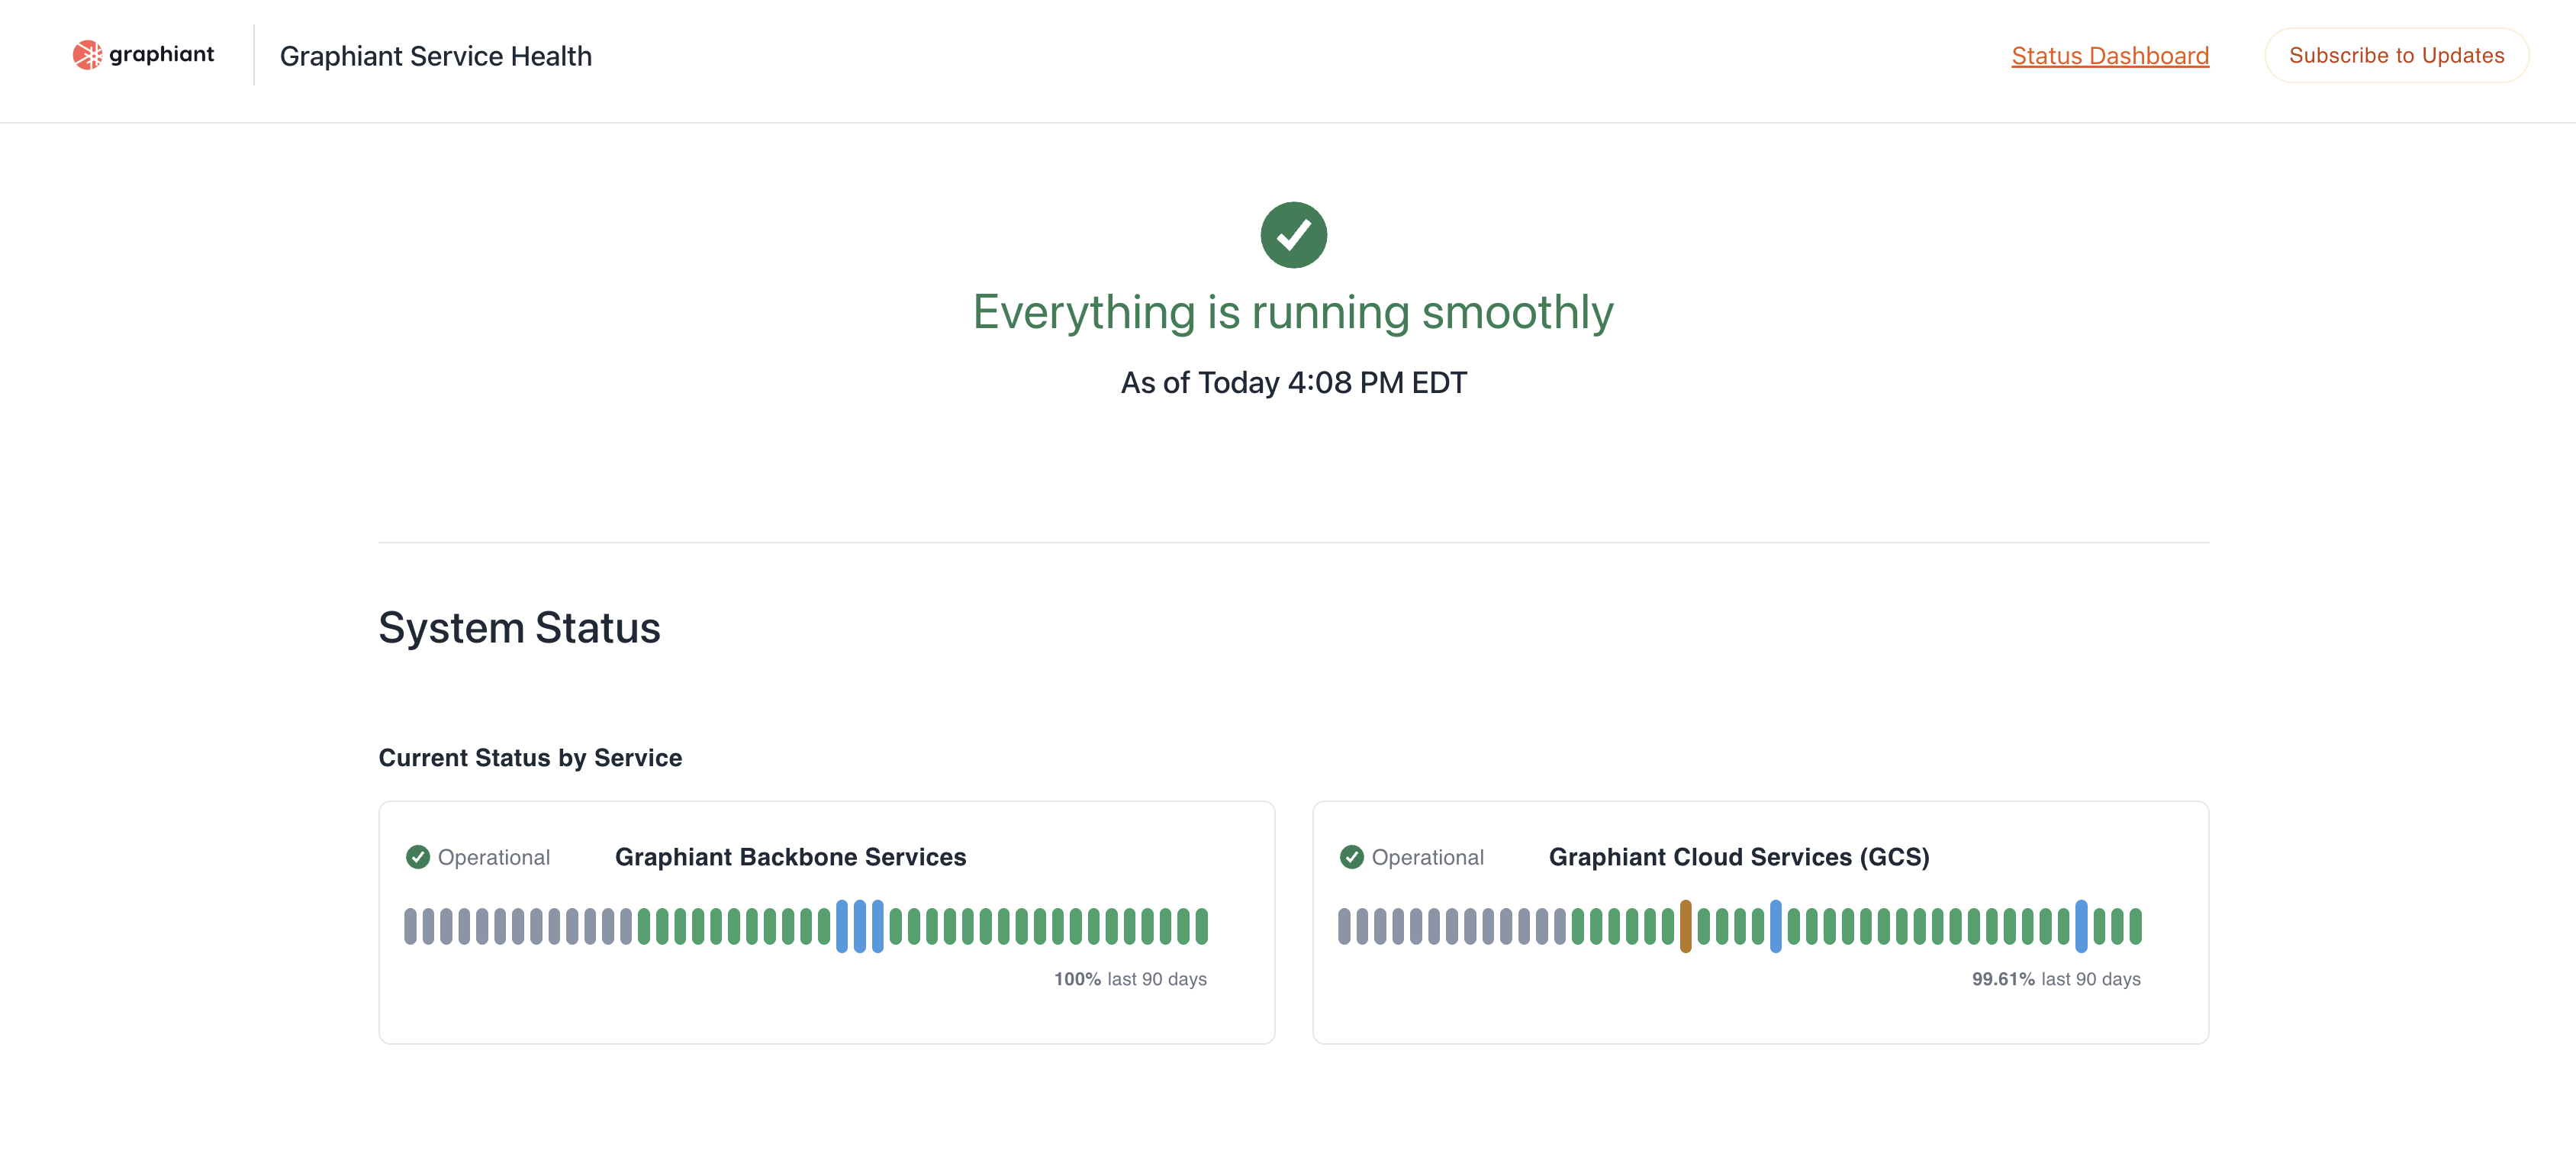
Graphiant's resources section highlights various documents and services for business transformation.

Service Health

The Service Health section allows you to view:

  • Active Incidents

  • Scheduled Maintenance

  • Status History

You can open this at any time by going to the Graphiant Status Dashboard and clicking ‘Open Service Health’.

Graphiant status dashboard showing service health and location availability across regions.

Here you will see the Current System Status by Service:

  • Graphiant Backbone Services

  • Graphiant Cloud Services

Graphiant service health dashboard showing operational status for services and current time.