Overview
This test plan defines 30+ test cases for the Graphiant private backbone, deployed under an MSP account within the Graphiant portal inside a simulated lab environment (hosted on KVM, ESXi, or Proxmox hypervisors).
Topology Configuration:
Points of Presence (PoPs) & Gateways: The architecture features three simulated PoPs, with at least two hosting dedicated Gateway (GW) infrastructures to simulate cloud on-ramp, multi-cloud, and third-party interconnect use cases. End-customer site devices (edges) are provisioned across two distinct enterprises under the MSP account within each PoP region.
Edge Terminators (ETs): Serving as the stateless core devices of the private backbone, ETs are deployed in pairs per region. A regional PoP footprint is collectively represented by its stateless core ET pair combined with its GW infrastructure.
Traffic & Connection Flow: Upon ET activation within the MSP account, all underlying enterprise edge devices automatically establish connections, homing directly to their corresponding regional stateless backbone core ETs.
The test cases covered in this document are broadly categorized into the following sections:
Backbone Provisioning & Life-Cycle
Backbone HA & Resiliency
Backbone Monitoring & Troubleshooting
Backbone Security & Performance
Scope and Responsibilities
Use this table to keep track of your pilot test plan progress:
Category | Customer Lead(s) | Graphiant Lead(s) | Estimated Effort (Hours) |
|---|---|---|---|
Backbone Provisioning & Life-Cycle | 6 Hours (Coordination required with Graphiant Team) | ||
Backbone HA & Resiliency | 4 Hours | ||
Backbone Monitoring & Troubleshooting | 2 Hours (Coordination required with Graphiant Team) | ||
Backbone Security & Performance | 3 Hours |
Marketplace Subscription and Registration
Subscribe to Graphiant's Pay-as-you-go offering in AWS Marketplace, click here for instructions.
Topology
.png)
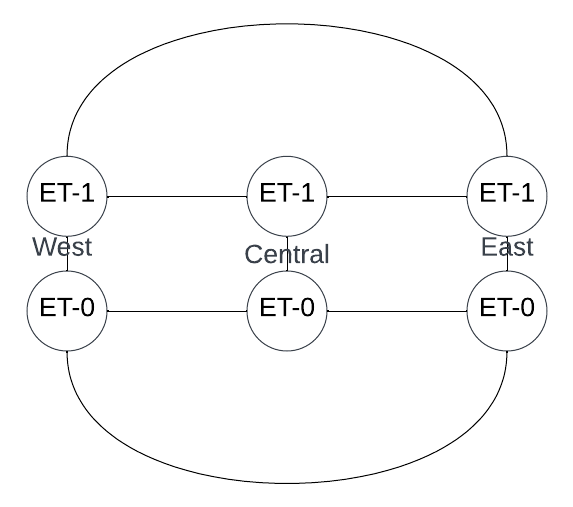
Topology Overview
The Graphiant private backbone is distributed across three simulated, geographically distinct Points of Presence (PoPs) in the West, Central, and East regions. Each regional PoP houses a pair of stateless core devices Edge Terminators (ETs) that establish the foundation of the backbone network.
Lab Internet Firewall Requirements:
To ensure proper connectivity to the Graphiant management, control, and data (backbone) planes, the lab environment's Internet firewall must permit outbound traffic for the specific IP addresses and ports listed in the Graphiant Service IPs and Ports for Firewall Rules
Backup Strategy and PoP Redundancy
West PoP (PoP-0): Primary region. First backup is Central PoP, second backup is East PoP.
Central PoP (PoP-1): Hub region. First backup is East PoP, second backup is West PoP.
East PoP (PoP-2): Primary region. First backup is Central PoP, second backup is West PoP.
This backup strategy ensures that if a primary PoP fails, traffic is automatically rerouted to the designated backup PoPs in order of preference.
Enterprise and Edge Device Configuration
The MSP hosts 2 enterprises with distributed edge devices across the regions.
Enterprise-1:
3 edge devices (Edge-1, Edge-2, Edge-3)
Location: West region (2 edges, dual homed) and Central region (1 edge)
Devices connect to their respective local PoPs with redundancy to backup PoPs
Enterprise-2:
2 edge devices (Edge-1, Edge-2)
Location: Central region (1 edge) and East region (1 edge)
Devices connect to their respective local PoPs with redundancy to backup PoPs
Multi-WAN Edge Connectivity (Central Region):
Central region edge devices are configured with 2 WAN interfaces to demonstrate advanced multi-path connectivity
Each WAN interface on a central edge device provides independent connectivity paths
WAN Interface 1: Connects to the active Central PoP (primary connection)
WAN Interface 2: Connects to the corresponding backup PoP (secondary connection for redundancy and load balancing)
This configuration allows testing of link failover, load distribution, and multi-path resilience across WAN interfaces
Traffic Hosts and Simulation
Traffic hosts deployed behind the gateways (GW-0 and GW-1) simulate cloud-hosted applications and services, enabling testing of backbone connectivity to cloud resources. Traffic hosts connected behind the edge devices can generate traffic for both site-to-site and site-to-cloud connectivity scenarios, allowing validation of end-to-end data flows across the backbone infrastructure.
Network Architecture Details
PoP Regions:
PoP-0 (West): Located in Azure and AWS clouds
PoP-1 (Central): Centrally positioned backbone hub
PoP-2 (East): Located in Azure and AWS clouds
Core Devices per PoP:
Each PoP contains 2 core devices deployed as a pair for redundancy
ET-0 and ET-1 are the two core devices in each region
Within each region, ET-0 and ET-1 are directly connected to each other
Mesh Connectivity Across PoPs:
ET-0 Full Mesh: All ET-0 devices across the three PoPs are fully meshed — direct connectivity between West ET-0, Central ET-0, and East ET-0
ET-1 Full Mesh: All ET-1 devices across the three PoPs are fully meshed — direct connectivity between West ET-1, Central ET-1, and East ET-1
Gateway (GW) Deployment:
2 Gateways (GW-0 and GW-1) deployed in at least 2 PoPs (West and East regions in this topology)
Gateways provide additional routing and traffic management capabilities
WAN Connectivity:
Each core device has 2 WAN connections (wan-1 and wan-2) for enhanced redundancy and load balancing
All WAN connections converge through the Internet cloud
Enterprise Edge Integration:
Enterprise edges (Edge-1, Edge-2, etc.) in each region connect to the local ET-0 and ET-1 core devices
Edges automatically register with and connect to the geographically nearest core pair in their region
Multi-region enterprise sites have redundant connectivity paths through the backbone mesh
ET-to-ET Connectivity
Detailed topology diagram showing ET-to-ET connections and mesh architecture across all PoPs:
Automation
Documentation:
.png)
About Graphiant Backbone Health Dashboard
The Backbone Health Dashboard provides real-time visibility into the operational status and performance of the entire Graphiant backbone infrastructure. It aggregates metrics from all PoPs, core devices, gateways, and connected enterprise edges to enable proactive monitoring and rapid issue detection.
Capability | Description |
|---|---|
PoP Health Status | Real-time status indicators for each PoP (West, Central, East) showing core device availability, gateway status, and overall region health |
Core/ET Device Metrics | CPU, memory, and bandwidth utilization for all ET-0 and ET-1 devices across regions with threshold alerts for capacity planning |
Connectivity Status | Visual representation of mesh connectivity between PoPs, showing active and backup path status, inter-PoP tunnel health, and latency measurements |
Enterprise Edge Overview | Number of connected edge devices per enterprise and per region, connection status, and WAN interface health for multi-path edge configurations |
Alerts & Notifications | Critical alerts for device failures, connectivity issues, and performance degradation with severity levels and escalation paths |
Historical Trends | Time-series graphs of backbone performance metrics for capacity planning, SLA compliance tracking, and long-term trend analysis |
Test Case Summary
Test Case # | Test Case Code | Name | Category | Result | Notes |
|---|---|---|---|---|---|
1 | TC-01 | Create private backbone regions | Backbone Provisioning & Life-Cycle | ||
2 | TC-02 | Onboard ET devices | Backbone Provisioning & Life-Cycle | ||
3 | TC-03 | Onboard GW devices | Backbone Provisioning & Life-Cycle | ||
4 | TC-04 | Configure ET devices via API | Backbone Provisioning & Life-Cycle | ||
5 | TC-05 | Configure GW devices via API/GUI | Backbone Provisioning & Life-Cycle | ||
6 | TC-06 | Site devices onboarding and connectivity to ETs in Canary mode | Backbone Provisioning & Life-Cycle | ||
7 | TC-07 | Site devices connectivity to ETs when ETs are moved out of canary mode | Backbone Provisioning & Life-Cycle | ||
8 | TC-08 | ET device life cycle active/staging/maintenance | Backbone Provisioning & Life-Cycle | ||
9 | TC-09 | ET device upgrade | Backbone Provisioning & Life-Cycle | ||
10 | TC-10 | ET device as transit only | Backbone Provisioning & Life-Cycle | ||
11 | TC-11 | Moving site device from one region to another region | Backbone Provisioning & Life-Cycle | ||
12 | TC-12 | End to end connectivity within the same PoP | Backbone Provisioning & Life-Cycle | ||
13 | TC-13 | End to end connectivity between the PoPs and across multiple PoPs | Backbone Provisioning & Life-Cycle | ||
14 | TC-14 | ET to ET connectivity over IPSec tunnel | Backbone Provisioning & Life-Cycle | ||
15 | TC-15 | ET device reboot | Backbone HA & Resiliency | ||
16 | TC-16 | ET wan interface flap | Backbone HA & Resiliency | ||
17 | TC-17 | All ET wan interfaces flap | Backbone HA & Resiliency | ||
18 | TC-18 | ET to ET interface down | Backbone HA & Resiliency | ||
19 | TC-19 | ET device power down | Backbone HA & Resiliency | ||
20 | TC-20 | Entire PoP power down | Backbone HA & Resiliency | ||
21 | TC-21 | Verify WAN failover on Edge to ET WAN link loss | Backbone HA & Resiliency | ||
22 | TC-22 | Edge WAN interface down | Backbone HA & Resiliency | ||
23 | TC-23 | Walkthrough backbone health dashboard | Backbone Monitoring & Troubleshooting | ||
24 | TC-24 | Alarms/Notification management | Backbone Monitoring & Troubleshooting | ||
25 | TC-25 | MSP backbone topology view | Backbone Monitoring & Troubleshooting | ||
26 | TC-26 | Throughput and traffic profile performance (Site-to-Site and Site-to-Cloud) | Backbone Security & Performance | ||
27 | TC-27 | Data exchange across enterprises (B2B) | Backbone Security & Performance | ||
28 | TC-28 | Secure cloud on-ramp and multi-cloud connectivity with MACsec | Backbone Security & Performance | ||
29 | TC-29 | End-to-end connectivity with PQC | Backbone Security & Performance | ||
30 | TC-30 | Data assurance and sovereignty policies | Backbone Security & Performance |
Total: 30+ test cases
Test Cases
TC-01: Create private backbone regions
Field | Detail |
|---|---|
Category | Backbone Provisioning & Life-Cycle |
Account | Graphiant Admin |
Objective: Create 3 regions (West, Central, East) with backup assignments.
Pre-conditions: MSP admin access, no regions exist.
Step | Action |
|---|---|
A | Portal: Create region "west (<>)" with backups: Central (1), East (2) |
B | Portal: Create region "central (<>)" with backups: East (1), West (2) |
C | Portal: Create region "east (<>)" with backups: Central (1), West (2) |
D | Verify: All 3 regions Active, backup assignments correct |
Expected Result: All regions created with correct backup configuration. Status: Active.
TC-02: Onboard ET devices
Field | Detail |
|---|---|
Category | Backbone Provisioning & Life-Cycle |
Account | MSP Admin |
Objective: Onboard 6 ET devices (WC-01, WC-02, CC-01, CC-02, EC-01, EC-02).
Pre-conditions: TC-01 complete, hardware available.
Step | Action |
|---|---|
A | Generate tokens for West ETs (WC-01, WC-02). Onboard → Status: Staging |
B | Generate tokens for Central ETs (CC-01, CC-02). Onboard → Status: Staging |
C | Generate tokens for East ETs (EC-01, EC-02). Onboard → Status: Staging |
Expected Result: All 6 cores in Staging status (2 per region).
TC-03: Onboard Gateway devices
Field | Detail |
|---|---|
Category | Backbone Provisioning & Life-Cycle |
Account | MSP Admin |
Objective: Onboard 4 gateways (GW-01/02 West, GW-03/04 East).
Pre-conditions: TC-02 complete.
Step | Action |
|---|---|
A | Generate tokens and onboard GW-01, GW-02 (West) → Status: Staging |
B | Generate tokens and onboard GW-03, GW-04 (East) → Status: Staging |
Expected Result: 4 gateways in Staging (West: 2, East: 2, Central: 0).
TC-04: Configure ET devices via API
Field | Detail |
|---|---|
Category | Backbone Provisioning & Life-Cycle |
Account | MSP Admin |
Objective: Push config to all 6 ETs via API (PUT). Move to Active status.
Automation:
Pre-conditions: TC-02 complete, admin API token.
Step | Action |
|---|---|
A | Prepare JSON config: device_id, ET.name, ET.regionName, interfaces (GigE3/5/6) |
B | PUT /v1/devices/{ET-id}/config → HTTP 200, status→Active. Repeat for all 6 ETs. |
C | Verify: All interfaces Up/Connected, config persists (GET request) |
Expected Result: All 6 cores Active, interfaces Up, config persists.
TC-05: Configure GW devices via API/GUI
Field | Detail |
|---|---|
Category | Backbone Provisioning & Life-Cycle |
Account | MSP Admin |
Objective: Configure all 4 GWs via portal (hostname, WAN, peer, BGP).
Automation:
Pre-conditions: TC-03 complete.
Step | Action |
|---|---|
A | GW-01: Hostname, Site, Region, WAN interface (GigE3 IPv4), Peer interface (GigE5), Cloud LAN, BGP config |
B | Repeat for GW-02 (West), GW-03/04 (East). Verify all configured and Online, BGP Established. |
Expected Result: All 4 GWs configured, Online, BGP Established.
TC-06: Site devices onboarding and connectivity to ETs in Canary mode
Field | Detail |
|---|---|
Category | Backbone Provisioning & Life-Cycle |
Account | MSP Admin |
Objective: ETs in Canary mode. Canary-enabled edges connect; non-canary edges cannot.
Automation:
Pre-conditions: TC-04/05 complete.
Step | Action |
|---|---|
A | Move all 6 ETs Staging→Active (automatic Canary entry). Deploy 3 canary edges, move to Canary mode. |
B | Verify canary edges connect to canary ETs. Deploy 4th non-canary edge — confirm it cannot connect. ✓ |
Expected Result: 3 canary edges connected, 1 non-canary isolated.
TC-07: Site devices connectivity to ETs when ETs are moved out of canary mode
Field | Detail |
|---|---|
Category | Backbone Provisioning & Life-Cycle |
Account | MSP Admin |
Objective: Disable Canary on ETs and edges. Verify standard connectivity.
Automation:
Pre-conditions: TC-06 complete.
Step | Action |
|---|---|
A | Disable Canary on all 6 ETs and all edges. Verify edges remain Online, connected to correct regional ETs. |
B | Verify monitoring shows ET connectivity details (IDs, region, tunnel, latency). Routes learned correctly. |
Expected Result: All edges connected in standard mode. Monitoring shows connectivity.
TC-08: ET device life cycle active/staging/maintenance
Field | Detail |
|---|---|
Category | Backbone Provisioning & Life-Cycle |
Account | MSP Admin |
Objective: Demonstrate lifecycle state transitions. Staging isolates connectivity, Maintenance suppresses alarms, Deactivated removes ET from data plane.
Pre-conditions: TC-04 complete, MSP admin portal access.
Step | Action |
|---|---|
A | WC-01 → Staging: All edge and inter-ET connections dropped. Edges fail over to WC-02. |
B | WC-01 → Active: Re-establishes peer and edge connections. Load balances with WC-02. |
C | WC-01 → Maintenance: Connectivity maintained. Alarms suppressed for WC-01 only. |
D | WC-01 → Active: Alarm suppression lifted. Alarms fire normally. |
E | WC-01 → Deactivated: Removed from dataplane. Edges fail over to WC-02. No alarms generated. |
Expected Result: Each lifecycle state behaves as designed.
TC-09: ET device upgrade
Field | Detail |
|---|---|
Category | Backbone Provisioning & Life-Cycle |
Account | MSP Admin |
Objective: Demonstrate PoP-level redundancy during a software upgrade. Verify failover and automatic reconnection to upgraded ET.
Pre-conditions: TC-07 complete. New software version available. Continuous traffic Host-1 → Host-2.
Step | Action |
|---|---|
A | Baseline: Note WC-01 software version. Traffic flows continuously. |
B | Initiate upgrade on WC-01. Failover to WC-02. Traffic continues post-convergence. |
C | WC-01 returns Active (new version). edge-1 auto-reconnects. New version confirmed. Alarms cleared. |
Expected Result: Automatic failover during upgrade. WC-01 running new version.
TC-10: ET device as transit only
Field | Detail |
|---|---|
Category | Backbone Provisioning & Life-Cycle |
Account | MSP Admin |
Objective: Demonstrate pure transit routing via Central PoP with WAN interfaces disabled. All changes reverted at end.
Pre-conditions: TC-07 complete. edge-1 → West PoP, edge-2 → East PoP. Direct West-East connectivity active. Continuous traffic Host-1 → Host-2.
Part A: Baseline – Direct West-East Path
Step | Action |
|---|---|
A1 | Verify direct West-East path. Central WAN Up. Traffic flows continuously, baseline latency noted. |
Part B: Test Setup
Step | Action |
|---|---|
B1 | Disconnect West-East inter-PoP links. Disable all WAN interfaces on CC-01 and CC-02. Verify Central WAN Down, inter-PoP ET interfaces remain Up. |
Part C–D: Transit Verification
Step | Action |
|---|---|
C1 | Traffic reroutes via Central PoP (West→Central transit→East). Traffic continues to flow. Byte counters increment on Central inter-PoP interfaces. |
D1 | Attempt edge connection to Central — fails (WAN Down). Transit traffic unaffected. |
Part E: Revert
Step | Action |
|---|---|
E1 | Re-enable Central WAN and restore West-East links. Routing re-converges to direct path. Alarms cleared. |
Expected Result: Central forwards transit with WAN Down. All changes reverted. System matches baseline.
TC-11: Moving site device from one region to another region
Field | Detail |
|---|---|
Category | Backbone Provisioning & Life-Cycle |
Account | MSP Admin |
Objective: Demonstrate make-before-break region move via portal. edge-1 moves West → Central while traffic flows to edge-2 in East.
Pre-conditions: TC-07 complete. edge-1 in West, edge-2 in East. All 3 regions active. Continuous traffic Host-1 → Host-2.
Part A: Baseline – edge-1 in West
Step | Action |
|---|---|
A1 | edge-1 active to WC-01. Traffic flows continuously. Note baseline West-to-East latency. |
Part B–C: Region Move and Re-optimization
Step | Action |
|---|---|
B1 | Portal → edge-1 → change region to Central. New Central PoP tunnels up before West tunnels drop. Record convergence time. |
C1 | Verify edge-1 region = Central, active tunnel to CC-01/CC-02. West tunnels dropped. Traffic continues to flow. Latency reflects Central-to-East path. |
Part D–E: Verify and Post-Move
Step | Action |
|---|---|
D1 | Confirm make-before-break (minimal disruption). Portal shows edge-1 = Central. West PoP unaffected. |
E1 | Sustained traffic via Central-to-East path. No unexpected alarms. Audit log records region change. |
Expected Result: Make-before-break confirmed. Minimal traffic disruption. Portal correctly reflects Central region assignment.
TC-12: End to end connectivity within the same PoP
Field | Detail |
|---|---|
Category | Backbone Provisioning & Life-Cycle |
Account | MSP Admin |
Objective: 2 edges same PoP (West). Ping successful.
Pre-conditions: TC-07 complete.
Step | Action |
|---|---|
A | Deploy edge-west-01 and edge-west-02 in West. Create LAN 10.0.1.0/24. Connect Host A and Host B. |
B | Ping Host A → Host B and reverse. Traffic flows continuously, ~10-15ms latency. Confirm routes exchanged via backbone. |
Expected Result: Host A ↔ Host B connectivity verified. Traffic continues to flow, consistent latency.
TC-13: End to end connectivity between the PoPs and across multiple PoPs
Field | Detail |
|---|---|
Category | Backbone Provisioning & Life-Cycle |
Account | MSP Admin |
Objective: 2 edges different PoPs (West, East). Demonstrate alternate routing through Central when West-East link down.
Pre-conditions: TC-12 complete.
Step | Action |
|---|---|
A | Deploy edges in West and East. Ping Host C → Host D (direct path): Traffic flows continuously, ~30-50ms. |
B | Bring down West-East link. Continue ping — brief convergence then recovery via Central. Traffic resumes, ~55-65ms. |
C | Restore West-East link. Verify convergence back to ~30-50ms direct path. |
Expected Result: Direct path 30-50ms, alternate path 55-65ms, failover <15sec.
TC-14: ET to ET connectivity over IPSec tunnel
Field | Detail |
|---|---|
Category | Backbone Provisioning & Life-Cycle |
Account | MSP Admin |
Objective: Demonstrate ET-to-ET connectivity over an IPSec tunnel as an alternative to direct point-to-point circuits.
Pre-conditions: TC-07 complete. All ET devices in Active status. Direct point-to-point circuit between WC-01 and CC-01 either unavailable or disabled. Both ETs have WAN connectivity over Internet.
Use Case: Direct point-to-point circuits between ETs may not be available, take too long to provision, or be too expensive. IPSec tunnels over Internet WAN provide an alternative backbone link.
Step | Action |
|---|---|
A | Disable Direct P2P Link: Disable or disconnect the point-to-point circuit between WC-01 and CC-01 to simulate unavailability. |
B | Establish IPSec Tunnel: Configure and bring up IPSec tunnel between WC-01 and CC-01 over their WAN interfaces. Verify tunnel status transitions to UP on both ETs. |
C | Verify Tunnel Connectivity: Confirm IPSec tunnel is established and shows as active in backbone topology. |
D | Traffic Over IPSec Tunnel: Generate traffic from Host-A (behind WC-01) to Host-B (behind CC-01). Verify traffic flows continuously through IPSec tunnel backbone link without loss. |
E | Restore P2P Link: If available, re-enable the point-to-point link and verify routing prefers P2P over IPSec tunnel. Confirm seamless transition. |
Expected Result: IPSec tunnel successfully established between WC-01 and CC-01. Backbone traffic flows continuously through tunnel without loss. Tunnel provides functional alternative to direct point-to-point circuit.
TC-15: ET device reboot
Field | Detail |
|---|---|
Category | Backbone HA & Resiliency |
Account | MSP Admin |
Objective: Demonstrate PoP-level redundancy when a ET reboots. Verify failover to backup ET and automatic reconnection on recovery.
Pre-conditions: TC-07 complete. Continuous traffic Host-1 → Host-2.
Step | Action |
|---|---|
A | Baseline: Verify traffic is recovered, edge-1 active on WC-01. |
B | Reboot WC-01. Verify failover to WC-02. Traffic continues post-convergence. |
C | WC-01 returns Active. edge-1 automatically reconnects. WC-02 reverts to backup. Alarms cleared. |
Expected Result: Automatic failover and reconnection. Traffic continues throughout.
TC-16: ET wan interface flap
Field | Detail |
|---|---|
Category | Backbone HA & Resiliency |
Account | MSP Admin |
Objective: Demonstrate ET WAN interface redundancy. Verify failover to alternate path and automatic reconnection on recovery.
Pre-conditions: TC-07 complete. WC-01 has WAN-1 and WAN-2. Continuous traffic Host-1 → Host-2.
Step | Action |
|---|---|
A | Baseline: edge-1 active via WC-01 WAN-1. Traffic flows continuously. |
B | Bring down WAN-1. Failover to WAN-2 or WC-02. Traffic continues post-convergence. |
C | Restore WAN-1. edge-1 auto-reconnects to WC-01 WAN-1. Alarms cleared. |
Expected Result: Automatic failover and reconnection on WAN-1 recovery.
TC-17: All ET wan interfaces flap
Field | Detail |
|---|---|
Category | Backbone HA & Resiliency |
Account | MSP Admin |
Objective: With both WAN interfaces on WC-01 down, verify failover to WC-02 and automatic reconnection on full WAN recovery.
Pre-conditions: TC-07 complete. WC-01 has WAN-1 and WAN-2. Continuous traffic Host-1 → Host-2.
Step | Action |
|---|---|
A | Baseline: Both WAN interfaces Up. Traffic flows continuously. |
B | Down WAN-1 (edge→WAN-2), then down WAN-2. edge-1 failover to WC-02. Traffic continues post-convergence. |
C | Restore WAN-1 (no premature reconnect), then WAN-2. edge-1 auto-reconnects to WC-01. Alarms cleared. |
Expected Result: Failover to WC-02. Reconnection to WC-01 on full recovery.
TC-18: ET to ET interface down
Field | Detail |
|---|---|
Category | Backbone HA & Resiliency |
Account | MSP Admin |
Objective: Demonstrate inter-PoP link redundancy when an ET-to-ET interface fails. Verify site-to-site traffic reroutes through alternate ET pair paths.
Pre-conditions: TC-07 complete. Enterprise-1 deployed with edge-1 (West) and edge-2 (Central) connected to their local PoPs with redundancy to backup PoPs. Host-A behind edge-1, Host-B behind edge-2. Continuous traffic Host-A ↔ Host-B.
Step | Action |
|---|---|
A | Baseline: Verify Host-A (behind edge-1, West) to Host-B (behind edge-2, Central) traffic flows continuously. Direct path via WC-01/ET-0 ↔ CC-01/ET-0. Note baseline latency (~20-30ms). |
B | Bring down the ET-0 to ET-0 interface between West and Central PoPs. Continue traffic monitoring. |
C | Verify traffic continues to flow via alternate paths (ET-1 to ET-1, or via ET-0/ET-1 in East). Brief convergence period (<5 seconds), then traffic recovers. Latency may increase (~35-45ms via alternate path). |
D | Restore the ET-0 to ET-0 interface. Verify convergence back to direct path. Traffic latency returns to baseline. |
Expected Result: Alternate paths absorb traffic seamlessly. Inter-PoP link failure does not isolate PoPs. Traffic continues to flow post-convergence via alternate paths. Direct path latency restored on recovery.
TC-19: ET device power down
Field | Detail |
|---|---|
Category | Backbone HA & Resiliency |
Account | MSP Admin |
Objective: Demonstrate PoP resilience during extended ET outage. WC-02 sustains traffic; edge reconnects automatically on recovery.
Pre-conditions: TC-07 complete. Continuous traffic Host-1 → Host-2.
Step | Action |
|---|---|
A | Baseline: edge-1 active to WC-01. Traffic flows continuously. |
B | Take down WC-01. Failover to WC-02. Traffic continues post-convergence. |
C | WC-01 down for extended period. Traffic continues to flow, WC-02 stable. No other PoP impact. |
D | Bring WC-01 back online. edge-1 auto-reconnects. WC-02 reverts to backup. Alarms cleared. |
Expected Result: WC-02 sustains traffic throughout. Automatic reconnection on recovery.
TC-20: Entire PoP power down
Field | Detail |
|---|---|
Category | Backbone HA & Resiliency |
Account | MSP Admin |
Objective: Demonstrate cross-PoP redundancy when entire West PoP goes down. Active tunnel remains down until West recovers; edge auto-restores active tunnel on recovery.
Pre-conditions: TC-07 complete. edge-1 active to West PoP, backup to Central PoP. Continuous traffic Host-1 → Host-2.
Step | Action |
|---|---|
A | Baseline: active to West PoP, backup to Central PoP. Traffic flows continuously. |
B | Take down entire West PoP (WC-01 + WC-02). Failover to Central PoP backup tunnel. Traffic continues post-convergence. |
C | Both West ETs down. Active tunnel to West stays down — no premature reconnect. Traffic continues via Central. |
D | Bring West PoP back online (at least WC-01). edge-1 auto-brings up active tunnel to West. Central reverts to standby. Alarms cleared. |
Expected Result: Cross-PoP failover. Active tunnel auto-restored on West PoP recovery.
TC-21: Verify WAN failover on Edge to ET WAN link loss
Field | Detail |
|---|---|
Category | Backbone HA & Resiliency |
Account | MSP Admin |
Objective: Demonstrate class-based WAN failover triggered by loss/latency thresholds. Verify that application traffic classified as Gold, Silver, or Bronze switches to the secondary WAN interface when quality degradation exceeds the threshold for its class, and reverts when the degradation is removed.
Pre-conditions: TC-07 complete. Enterprise-1 and Enterprise-2 deployed. Edge-3 (one enterprise) and Edge-1/Edge-2 (other enterprise) active with dual WAN interfaces. Traffic policies configured to classify application traffic into Gold (low-latency, low-loss tolerance), Silver (moderate tolerance), and Bronze (best-effort) classes. Continuous multi-class traffic flowing from Edge-3 host to Edge-1/Edge-2 hosts.
Traffic Class Thresholds: Gold: <10ms latency, <0.1% loss. Silver: <30ms latency, <1% loss. Bronze: <100ms latency, <5% loss. When a WAN link's loss/latency exceeds a class threshold, only traffic of that class switches to the alternate WAN. Other classes continue via the degraded link if their thresholds are not exceeded.
Step | Action |
|---|---|
A | Baseline: Verify all traffic classes (Gold, Silver, Bronze) flowing continuously from Edge-3 host to Edge-1/Edge-2 hosts across primary WAN. Monitor per-class latency and loss metrics — all within nominal thresholds. |
B | Introduce controlled loss/latency on primary WAN link: Simulate 5ms additional latency and 0.5% packet loss. Monitor per-class traffic behavior. |
C | Verify selective failover: Gold traffic switches to secondary WAN (exceeds <10ms threshold). Silver and Bronze continue via primary WAN (thresholds not yet breached). |
D | Increase loss/latency further: Introduce 35ms latency and 2% loss. Monitor per-class traffic. |
E | Verify hierarchical failover: Gold and Silver traffic switch to secondary WAN. Bronze remains on primary (threshold <100ms, <5% loss not exceeded). |
F | Remove all loss/latency degradation. Continue monitoring per-class metrics. |
G | Verify traffic reverts: All classes (Gold, Silver, Bronze) automatically switch back to primary WAN as conditions return to baseline. No traffic loss during reversion. All classes resume optimal paths. |
Expected Result: Class-based thresholds trigger selective WAN failover. Traffic within thresholds continues via primary WAN; traffic exceeding thresholds switches to secondary. All classes revert to primary WAN when conditions normalize. Failover/reversion is transparent to applications.
TC-22: Edge WAN interface down
Field | Detail |
|---|---|
Category | Backbone HA & Resiliency |
Account | MSP Admin |
Objective: Demonstrate edge dual-WAN load balancing and single-WAN failover. On recovery, tunnels re-established and load balancing resumes automatically.
Pre-conditions: TC-07 complete. edge-1 has two WAN interfaces with active and backup tunnels. Continuous traffic Host-1 → Host-2.
Step | Action |
|---|---|
A | Baseline: Both WANs Up. Traffic load balanced across both active tunnels. Traffic flows continuously. |
B | Bring down edge-WAN-1. All traffic moves to edge-WAN-2 active tunnel. Traffic continues post-convergence. |
C | Restore edge-WAN-1. Tunnels re-established automatically. Load balancing resumes. Alarms cleared. |
Expected Result: Automatic failover and load balancing restoration.
TC-23: Walkthrough backbone health dashboard
Field | Detail |
|---|---|
Category | Backbone Monitoring & Troubleshooting |
Account | Graphiant Admin |
The Backbone Health Dashboard provides real-time operational visibility across the entire backbone infrastructure. It is accessible via the Graphiant portal and comprises five main areas, each offering a different level of health and performance detail.
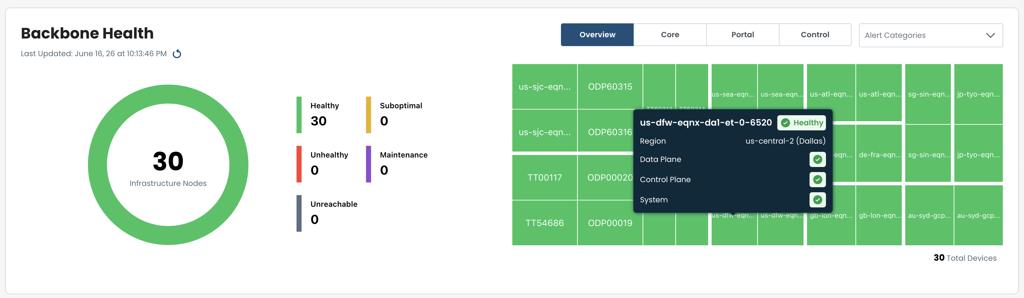
Part A: Backbone Health Overview
Infrastructure Node Count: Total node count in a circular ring chart, color-coded by health status.
Health Status Counters: Healthy (green), Suboptimal (yellow), Unhealthy (red), Maintenance (purple), Unreachable (grey). A fully operational backbone shows all nodes Healthy.
Device Treemap: Visual grid where each tile represents an infrastructure node. All-green confirms all devices healthy.
Dashboard Tabs: Overview, ET, Portal, and Control tabs for scoped views. Alert Categories dropdown filters by alarm type.
Last Updated Timestamp: Auto-refreshing with exact collection time.
Part B: Monitor Devices
Device Type Tabs: ETs, Edges, T2s, and ODPs — each showing device count.
ETs Table Columns: Hostname, Connectivity Status, Software version, Site, Region, Uptime. Clicking a hostname opens per-device drill-down.
Consistency Check: Consistent software versions confirm uniform release state. Uptimes flag unexpected reboots.
Search and Pagination: Filter by hostname or region; paginate for large inventories.
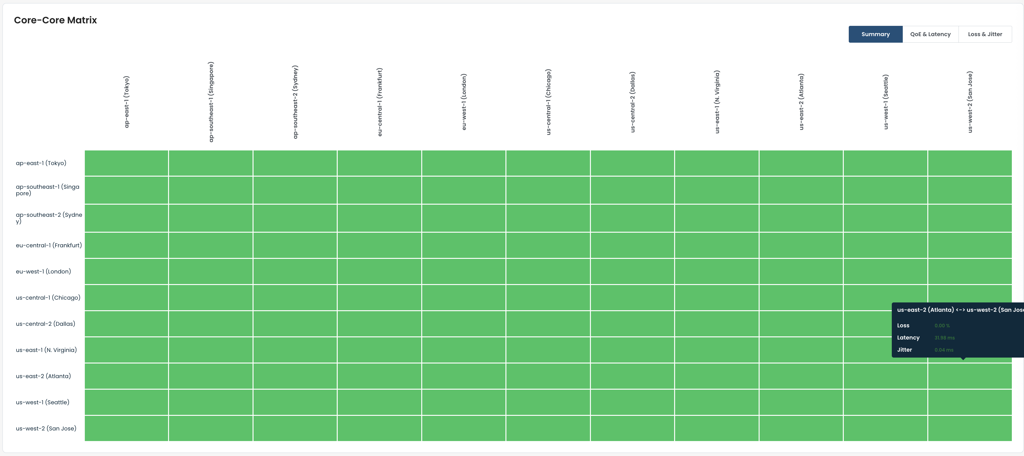
Part C: ET-ET Matrix
Region Grid: Each cell represents inter-region ET-to-ET health. All-green confirms no inter-region issues.
View Tabs: Summary, QoE & Latency, and Loss & Jitter tabs.
Cell Hover Tooltip: Loss, Latency, and Jitter per region pair.
Per-ET-Pair Drill-Down: Individual ET-to-ET metrics per region pair.
Part D: ET-WAN Matrix
Region List: Collapsible rows per region with green checkmark when all WAN connections healthy.
Expanded Region View: Per-ET table showing health per ISP/circuit provider.
QoE Status Column: Aggregated WAN quality signal for the entire region.
ISP-Level Fault Isolation: Degraded cells turn yellow/red — pinpoints specific ET and ISP without direct device access.
Part E: Per-Device Drill-Down
Device Header: Hostname, health badge, SW Version, Up Since, time-range selector.
Issues Tab: Active and historical issues. "No issues found" confirms clean status.
System Tab: CPU/Memory/Disk chart plus Up Time, Last Reboot Reason, Crashes, Temperature.
Data Plane, Control Plane, QoE Matrix Tabs: Deeper per-device diagnostics.
Device Troubleshooting Link: Launches CLI-level diagnostics from the portal.
TC-24: Alarms / Notification management
Field | Detail |
|---|---|
Category | Backbone Monitoring & Troubleshooting |
Account | Graphiant Admin |
The Alarms section of the Graphiant portal provides a comprehensive alarm and notification framework for the backbone, organized into four tabs: Alarms, Notification Management, Rules, and Excluded Entities.
Part A: Alarms Tab
Alarm List: Displays backbone alarms matching the selected time range. A healthy backbone shows "No alarms."
Active / Cleared Toggle: Filter between currently firing and auto-resolved alarms.
Time Range Selector: Past 5 minutes, Past 15 minutes, Past 30 minutes, Past hour, Past 4 hours, Past day, Past 2 days, Past week, Past month, and Custom Range.
Last Updated Timestamp: Shows last refresh time with manual refresh button.
Part B: Notification Management Tab
Notifications Summary Chart: Donut chart showing total notifications triggered (e.g., 405 time-triggered), color-coded by notification type.
Per-Notification Breakdown: Trigger count per type — e.g., Master Notification: 359, ET to ET Loss Beyond High Threshold: 27, ET to ET Loss Beyond Critical Threshold: 19.
Add Notification Button: Opens the notification creation form.
Part C: Creating a Notification
Enable Toggle, Name, Description: Enable/disable without deleting; identify and describe the policy.
Condition – Alarm Type: Dropdown to select the triggering alarm type.
Suppress After and Evaluation Window: Controls occurrence threshold and evaluation window (e.g., 5 minutes).
Action: Send an Email: Recipient addresses plus optional custom message.
Action: Send Additional Notification: Teams and OpsGenie integration dropdowns.
Part D: Rules Tab
Rule Count: 100 predefined rules covering all major infrastructure health dimensions.
Table Columns: Plane, Category, Alarm-Set condition, Alarm-Clear condition, Priority (P1/P2), Excluded Entities count.
Rule Enable/Disable Toggle: Per-rule on/off without removing the rule.
Examples: CPU/memory/disk at 85% = P2, at 95% = P1. Device to Portal Down, Choppy WAN Link = P2. Pagination across 5 pages.
Part E: Excluded Entities Tab
Entity Count: Total active exclusions (e.g., 192 items).
Table Columns: Device, Alarm-set Rule, Notes, Entity Details (Site, Device, Interface, Lan Segment, Enterprise, Peer, Peer Interface tags).
Exclusion Context: Entity Details tags make the suppressed alarm path explicit.
Search: Filter by device name, rule, or notes.
TC-25: MSP backbone topology view
Field | Detail |
|---|---|
Category | Backbone Monitoring & Troubleshooting |
Account | Graphiant Admin |
The MSP Backbone Topology View gives the MSP admin a visual representation of the backbone via the Graphiant portal. The view adapts based on whether the MSP account has ETs deployed — and when ETs are present, it shows inter-PoP latency and a historical record of path changes over configurable time windows.
Part A: Viewing the Graphiant Backbone (No MSP ETs Deployed)
Global Backbone Visibility: All Graphiant-operated PoPs and the interconnections between them are visible, even before any customer ETs have been provisioned.
PoP Locations: Each Graphiant PoP is represented as a geographically positioned node, identifying which regions are available for ET deployment.
Backbone Interconnects: Links between PoPs show how the Graphiant backbone is interconnected across regions.
Part B: Viewing MSP PoPs (With ETs Deployed)
MSP PoP Nodes: Each region where the MSP has deployed ETs appears as a PoP node — for example, West, Central, and East regions each represented on the map.
PoP-to-PoP Connectivity: Links between MSP PoPs reflect the actual inter-PoP connections established by the deployed ETs.
Node Detail: Clicking or hovering on a PoP node surfaces the number of active ETs, their health status, and the region name.
Part C: Inter-PoP Latency
Latency Labels on Links: Each link displays the measured latency between the two PoPs it connects (e.g., West ↔ Central: 12ms, West ↔ East: 45ms, Central ↔ East: 38ms).
Latency-Based Coloring: Links may be color-coded by latency health — green for nominal, yellow for elevated, red for degraded.
Part D: Path Changes
Path Change Log: Events where traffic paths between PoPs changed are recorded with the affected PoP pair, time, and trigger.
Time Range Selection: Last 24 hours, Last 2 days, and Last 1 week lookback windows.
Contextual Value: Useful after a backbone event to confirm routing reconverged correctly and no unexpected path changes persisted.
TC-26: Throughput and traffic profile performance (Site-to-Site and Site-to-Cloud)
Field | Detail |
|---|---|
Category | Backbone Security & Performance |
Account | MSP Admin |
Objective: Verify backbone performance and traffic handling under different traffic profiles — steady-state, bursty, and mixed patterns — across both site-to-site and site-to-cloud connectivity. Measure throughput, latency, jitter, and loss under varying traffic conditions.
Pre-conditions: TC-07 complete. Enterprise-1 deployed with Edge-1 (West) and Edge-2 (Central). Enterprise-2 deployed with Edge-3 (East). Gateways GW-0 and GW-1 deployed with traffic hosts behind them. Traffic generation tools (iperf, custom traffic generators) available for creating different traffic profiles. Monitoring tools available for real-time metric collection.
Traffic Profiles: Steady-State: Constant bitrate (e.g., 100 Mbps continuous stream for 60 seconds). Bursty: Traffic bursts (e.g., 500 Mbps bursts of 5 seconds followed by 5 second silence, repeated). Mixed: Combination of steady + bursty (e.g., 100 Mbps baseline + 300 Mbps bursts every 10 seconds).
Step | Action |
|---|---|
A | Site-to-Site Baseline (Steady-State): Generate 100 Mbps steady-state traffic from Host-1 (behind Edge-1, West) to Host-2 (behind Edge-2, Central) for 60 seconds. Monitor and record: throughput, latency, jitter, packet loss. Verify all metrics within expected baseline. |
B | Site-to-Site Bursty Traffic: Generate 500 Mbps bursts (5 seconds on, 5 seconds off) between same hosts for 5 minutes. Monitor per-burst metrics and inter-burst recovery. Verify backbone stabilizes between bursts. Record peak latency and jitter during bursts. |
C | Site-to-Site Mixed Profile: Generate 100 Mbps baseline traffic with 300 Mbps bursts every 10 seconds for 5 minutes. Monitor continuous metrics. Verify backbone handles sustained baseline plus intermittent peaks. Record response time to burst onset. |
D | Site-to-Cloud Baseline (Steady-State): Generate 100 Mbps steady-state traffic from Host-3 (behind Edge-3, East) to Cloud Host (behind GW-0) for 60 seconds. Monitor and record: throughput, latency, jitter, packet loss. Compare with site-to-site baseline. |
E | Site-to-Cloud Bursty Traffic: Generate 500 Mbps bursts (5 seconds on, 5 seconds off) between Edge-3 host and Cloud host for 5 minutes. Monitor per-burst metrics. Verify backbone recovers between bursts. Verify no traffic loss during burst transitions. |
F | Site-to-Cloud Mixed Profile: Generate 100 Mbps baseline + 300 Mbps bursts every 10 seconds between Edge-3 and Cloud for 5 minutes. Monitor continuous metrics. Verify backbone sustains mixed load. Compare convergence with site-to-site mixed profile. |
G | Concurrent Multi-Path Traffic: Simultaneously send steady-state traffic on site-to-site path (Edge-1 to Edge-2) and bursty traffic on site-to-cloud path (Edge-3 to Cloud) for 5 minutes. Monitor all paths independently. Verify no cross-interference or performance degradation. |
H | Analyze Results: Compile metrics from all test steps. Compare site-to-site vs. site-to-cloud performance. Verify no packet loss in any profile. Verify latency/jitter within acceptable ranges. Confirm backbone adequately handles all traffic patterns. |
Metrics to Monitor: Throughput (achieved bitrate vs. requested), Latency (min/avg/max RTT), Jitter (standard deviation of latency), Packet Loss (percentage per profile), Convergence Time (time to reach steady-state latency after burst onset).
Expected Result: Backbone handles steady-state, bursty, and mixed traffic profiles without packet loss. Throughput achieved as requested. Latency and jitter within nominal ranges. Site-to-site and site-to-cloud performance consistent. Concurrent multi-path traffic shows no interference.
TC-27: Data exchange across enterprises (B2B)
Field | Detail |
|---|---|
Category | Backbone Security & Performance |
Account | MSP Admin |
Objective: Verify enterprise routing table isolation by default, controlled inter-enterprise traffic via peering policy, and full isolation restoration on policy deletion.
Automation:
Pre-conditions: All ETs Active, multiple enterprise edges deployed, no existing peering policies.
Part A: Enterprise Route Isolation Verification (Default State)
Step | Action |
|---|---|
A1 | Verify enterprise-1 and enterprise-2 route tables are completely separate. Inter-enterprise ping fails. Firewall blocks cross-enterprise traffic. |
Expected Result (Part A): Complete route table isolation confirmed.
Part B: Backbone Peering Policy Configuration
Step | Action |
|---|---|
B1 | Create peering policy "Backbone-Peering-E1-E2": shared prefixes, firewall zone-pair (TCP 443/80 permit, all others deny, bidirectional). Apply and verify Active. |
Expected Result (Part B): Peering policy Active. Firewall zone-pair rules configured.
Part C–F: Route Visibility, Traffic Testing, Policy Removal, Re-apply
Step | Action |
|---|---|
C1 | Verify peered prefixes visible in both tables. TCP 443 flows bidirectionally. TCP 8080 blocked. |
D1 | Delete policy — verify routes withdrawn, traffic stops, isolation restored. |
E1 | Re-create policy — verify routes reappear, traffic resumes. Audit logs complete. |
Expected Result: Full peering lifecycle demonstrated. Isolation restored on deletion.
TC-28: Secure cloud on-ramp and multi-cloud connectivity with MACsec
Field | Detail |
|---|---|
Category | Backbone Security & Performance |
Account | MSP Admin |
Objective: Demonstrate GW LAG creation with MACsec via portal. Verify LACP negotiation, MACsec session, IP addressing, and encrypted traffic.
Automation:
Pre-conditions: TC-05 complete. GW has ≥2 physical LAN interfaces. Cloud-side supports LAG and MACsec. CAK/CKN prepared.
Part A: Baseline
Step | Action |
|---|---|
A1 | Verify GW Online, BGP established. No LAG or MACsec. |
Part B: GW LAG Configuration via Portal
Step | Action |
|---|---|
B1 | Create LAG-1. Enable Admin Status. Associate LAN segment. Set LACP mode Active. Bind physical members (GigE1, GigE2). |
B2 | Configure MACsec: Must-Secure mode, CAK, CKN, cipher suite (GCM-AES-128/256). Save and apply. |
Part C: Cloud-Side Configuration
Step | Action |
|---|---|
C1 | Create matching LAG with same LACP mode and members. Configure same CAK/CKN/cipher. Assign IP on LAG or sub-interface. |
Part D–E: Verify LACP, MACsec, BGP, Traffic
Step | Action |
|---|---|
D1 | Verify LACP Up (both members Bundled). MACsec Secured/Active. BGP re-established over LAG IP. |
E1 | Run iperf/ping over LAG + MACsec. Traffic flows continuously. MACsec TX/RX counters incrementing. Load balanced. No unexpected alarms. |
Expected Result: LACP Up, MACsec Secured, BGP Established, encrypted traffic confirmed.
TC-29: End-to-end connectivity with PQC
Field | Detail |
|---|---|
Category | Backbone Security & Performance |
Account | MSP Admin |
Objective: Demonstrate that an enterprise admin can enable Post-Quantum Cryptography (PQC) for an entire enterprise via the Graphiant portal, and verify that end-to-end dataplane connectivity is maintained after PQC is enabled. PQC protects the dataplane tunnels against quantum-computing threats by upgrading the key exchange mechanism used in the encryption negotiation. The setting is applied enterprise-wide — all edges and their tunnels within the enterprise adopt PQC-protected encryption upon enablement.
Pre-conditions:
TC-07 complete — all ETs Active, edges Online
At least two edges in the same enterprise deployed in different regions (e.g., edge-1 in West, edge-2 in East), each with a host behind them
Continuous traffic stream (e.g., ping or iperf) running between Host-1 (behind edge-1) and Host-2 (behind edge-2)
Enterprise admin portal access with permission to modify enterprise security settings
PQC is currently disabled for the enterprise (baseline state)
Part A: Baseline Traffic Verification – PQC Disabled
Step | Action |
|---|---|
A1 | Verify edge-1 and edge-2 are Online. Confirm end-to-end traffic flowing continuously and stable. |
A2 | Navigate to Enterprise Security settings. Confirm PQC is currently Disabled. Note current encryption state as baseline. |
Expected Result (Part A): Traffic flows continuously. PQC confirmed Disabled. Dataplane tunnels operating with standard encryption.
Part B: Enable PQC for the Enterprise
Step | Action |
|---|---|
B1 | Portal → Enterprise Settings → Security → Enable PQC. Apply enterprise-wide. |
B2 | Monitor continuous traffic during PQC enablement. Observe any brief disruption as tunnels renegotiate. Record convergence time. |
B3 | Verify portal shows PQC status as Enabled. Confirm setting propagated to all edges in the enterprise. |
Expected Result (Part B): PQC enabled enterprise-wide. Tunnels renegotiate with PQC-protected key exchange. Any disruption is brief. Portal reflects PQC Enabled.
Part C: Verify End-to-End Dataplane Connectivity with PQC Active
Step | Action |
|---|---|
C1 | Verify edge-1 and edge-2 Online with tunnels re-established after PQC renegotiation. |
C2 | Confirm end-to-end traffic between Host-1 and Host-2 continues to flow with stable performance — dataplane fully operational under PQC encryption. |
C3 | Run iperf between Host-1 and Host-2. Confirm acceptable throughput — PQC should not materially degrade dataplane performance. |
Expected Result (Part C): Edge tunnels re-established with PQC active. Traffic continues to flow. Acceptable throughput. Dataplane fully operational.
Part D: Verify PQC Encryption on Dataplane Tunnels
Step | Action |
|---|---|
D1 | In portal tunnel details for edge-1 and edge-2, verify PQC-enabled key exchange is shown for each active tunnel. |
D2 | Confirm all edges in the enterprise have adopted PQC — no edge remains on legacy (non-PQC) encryption. Verify consistent PQC status across all enterprise edge tunnels. |
Expected Result (Part D): All tunnels show PQC-enabled encryption. No edge on legacy key exchange. Enterprise-wide PQC adoption confirmed.
Part E: Post-PQC Traffic Verification and Audit
Step | Action |
|---|---|
E1 | Run sustained traffic (iperf or continuous ping) for an extended period with PQC enabled. Confirm traffic continues to flow with stable performance throughout. |
E2 | Review alarm dashboard. Confirm no unexpected alarms related to PQC enablement or tunnel renegotiation. |
E3 | Verify portal audit log captures the PQC enablement event with enterprise admin account, timestamp, and the change (PQC: Disabled → Enabled). |
Expected Result (Part E): Sustained traffic continues to flow. No residual alarms. Audit log records PQC enablement with full attribution and timestamp.
Monitoring / Verification:
Portal Enterprise Security settings show PQC transitioning from Disabled to Enabled
All enterprise edge tunnels renegotiate with PQC-protected key exchange upon enablement
End-to-end dataplane connectivity maintained post-PQC enablement
Tunnel security details reflect PQC-enabled encryption for all active tunnels
No edge in the enterprise retains legacy (non-PQC) key exchange after enablement
Dataplane throughput remains acceptable under PQC encryption
Audit log captures PQC enablement event with enterprise admin account and timestamp
TC-30: Data assurance and sovereignty policies
Field | Detail |
|---|---|
Category | Backbone Security & Performance |
Account | MSP Admin |
Objective: Verify that a Flex Algo policy can be created to select a group of ETs to enforce end-to-end flow of traffic only through that selected group of ETs.
Pre-conditions: TC-07 complete. All ETs Active. Enterprise admin portal access.
Step | Action |
|---|---|
A | Portal: Navigate to Flex Algo policy configuration. Create a new Flex Algo policy selecting a specific group of ETs (e.g., WC-01, CC-01, EC-01). |
B | Apply the policy enterprise-wide. Verify the portal shows the policy as Active. |
C | Generate traffic between Host-1 and Host-2. Verify that the traffic flows only through the selected group of ETs (confirm via portal path view or flow stats). |
D | Verify that traffic does not traverse ETs outside the selected group. |
E | Remove the policy. Confirm traffic reverts to default ET selection and all ETs are eligible. |
Expected Result: Flex Algo policy enforces end-to-end traffic flow exclusively through the selected group of ETs. Traffic is blocked from traversing non-selected ETs. Policy removal restores default behavior.