There are two types of Services that are available for Monitoring
Peering Service
Client to Server Service
Peering Service
Once a customer accepts a Data Exchange Service and begins exchanging data with the publisher, the publisher’s enterprise administrator can monitor its health and usage.
Monitoring Your Data Exchange Partner Service
You can monitor service performance and adjust configurations based on your role:
Service Publisher
Service Subscriber
Monitoring Your Published Data Exchange Partner Service
After a customer accepts and begins using your service, you can track its health and usage metrics by clicking on the relevant Service Name.

The landing page for the Monitoring section of your Data Exchange Service will show you:

Service Health
The Service Health table reflects the reachability of the producer / publisher and customer / subscriber prefixes.
.jpg)
Healthy values indicate that all prefixes are reachable.
Should a Health value be showing Impaired or Unhealthy, you can hover over the symbol to view the reason behind each issue:
Impaired:
Producer Prefix: Reveals the prefixes that are unreachable by the customer / subscriber
Customer Prefix: Reveals the prefixes that are unreachable by the producer / publisher
Unhealthy: No prefixes are reachable by either / both sides.
.jpg)
Service Consumption
The Service Consumption chart itemizes the following:
Total Consumption: Bandwidth being utilized across all subscribers to this service
Subscribers: Number of subscribers to this service
Top Subscribers: Your top five utilizers of the bandwidth for this service along with their usage levels; exact usage revealed upon hover
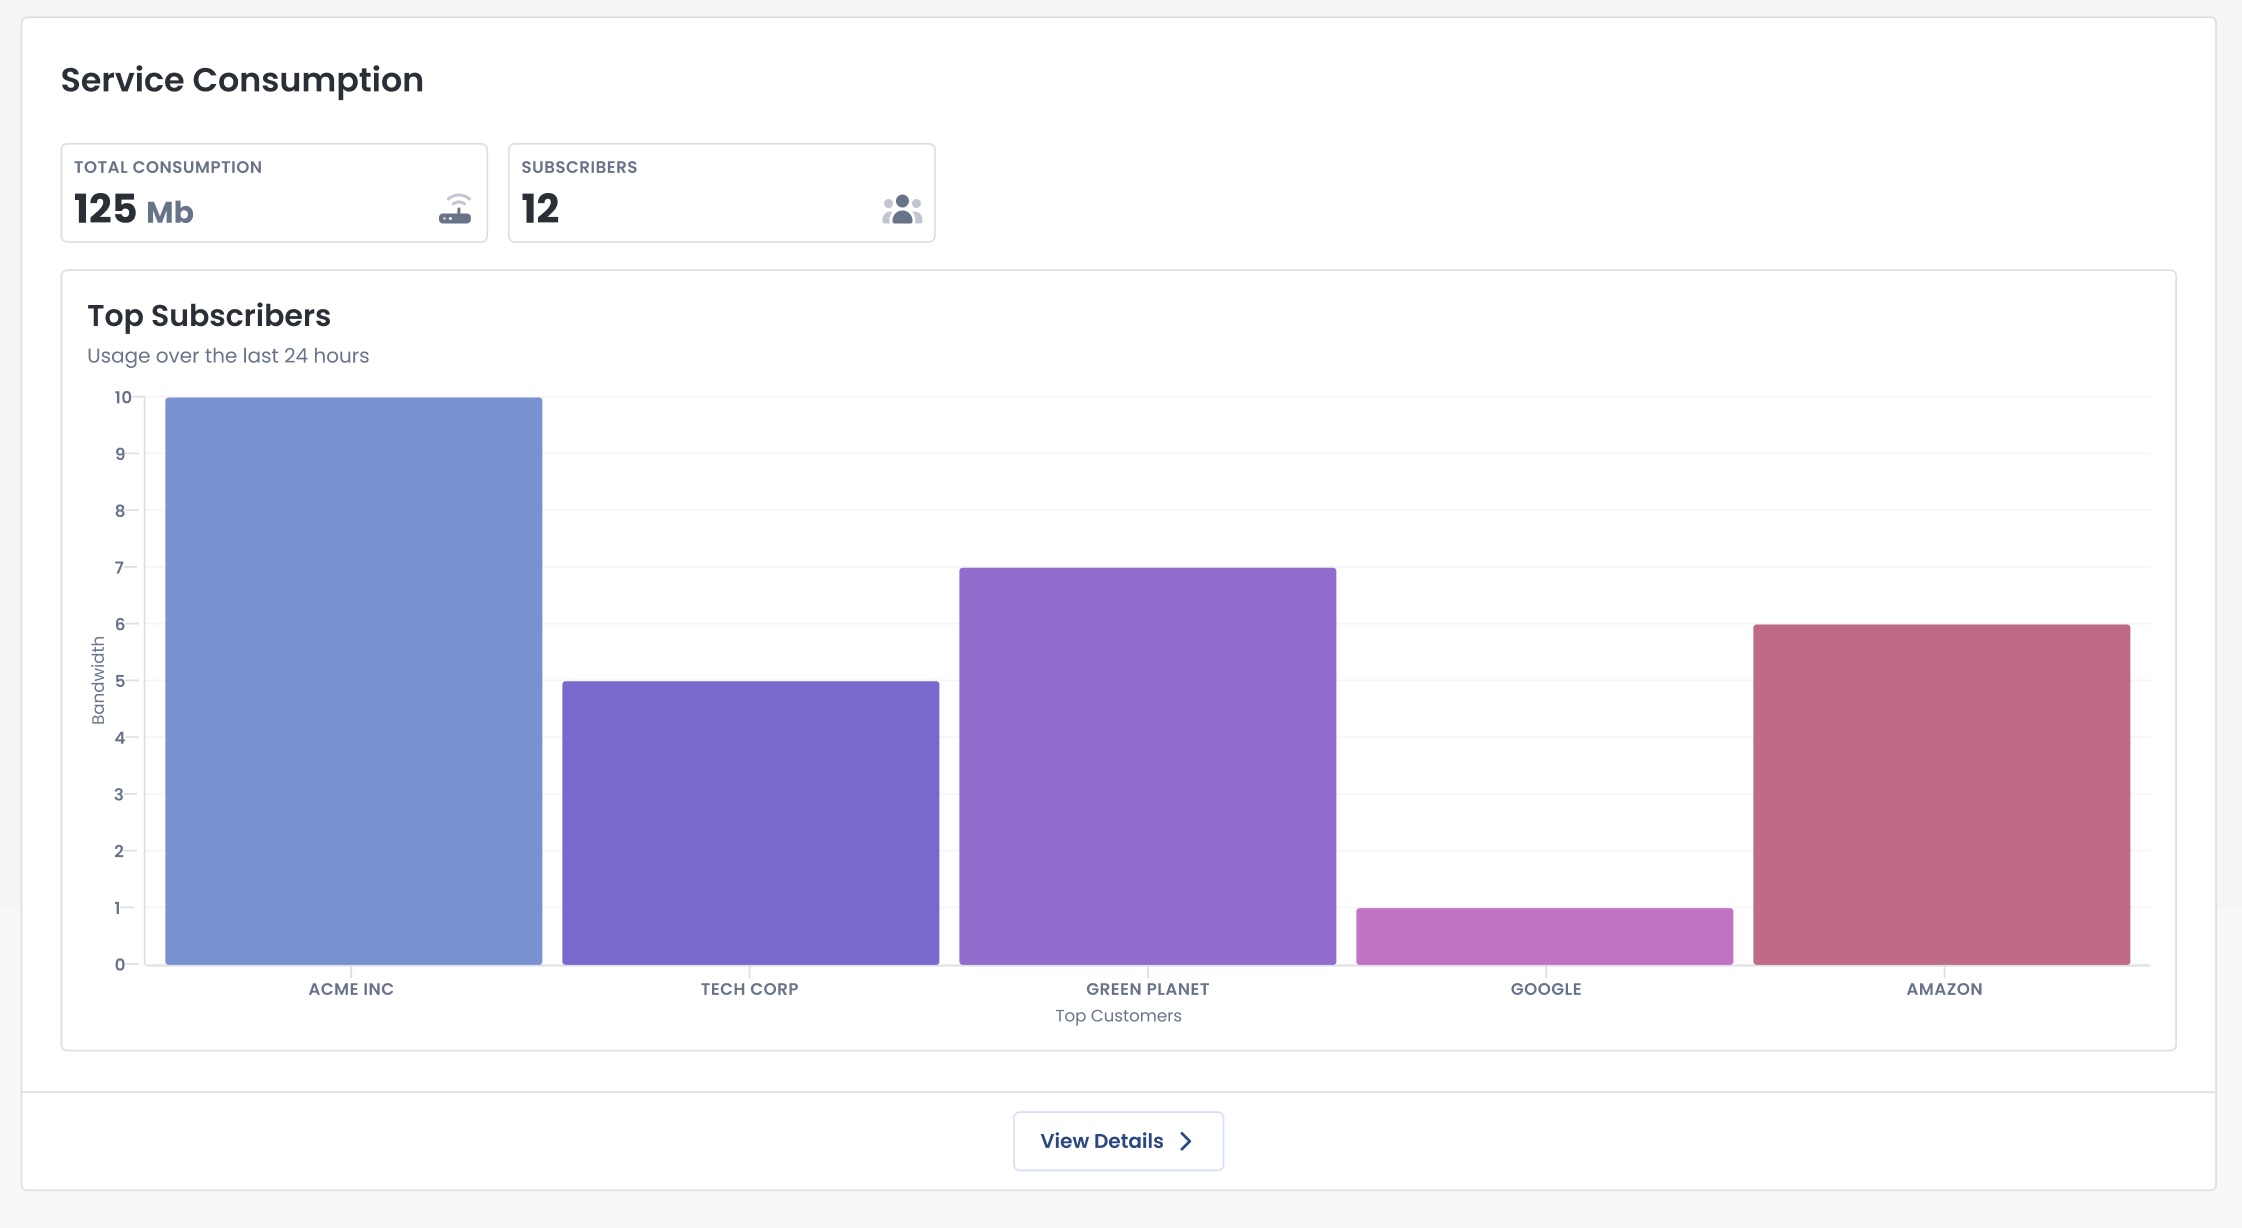
You can delve deeper into the consumption details of your service from the Service Consumption chart by clicking ‘View Details’.
The landing page for the Service Consumption Details of your Data Exchange Service will show you:
Bandwidth Usage:
Consumption Overview:
Overtime Consumption:
.jpg)
Monitoring Your Data Exchange Partner Service Subscription
The Customer when exchanging the data with the Publisher the data consumption can be seen at the customer’s tenant. The Customer data monitoring view is exactly similar to the Publisher Monitoring view.

The Service Health and the Service Consumption shows data that is consumed by the Customer

The View Details in the Service Consumption shows the monitoring view of the customer based on the time scale that is being selected.

The Consumption Overview shows the data for the customer for the specific Service, it shows the customer site the Service is consumed, and the Region where the site is attached.

The Overtime Consumption shows the monitoring data that is consuming over the period of time.

In the Case of the Non-Graphiant Workflow where the customers are not Graphiant Enterprises and it is a Proxy Tenant there could be multiple customers consuming the Service, in such case the Non-Graphiant customers are connected to the Proxy tenant using the IPSec Tunnels.

The Service is consumed by multiple Customers and the # of Customers shows the number of non-graphiant customers that are consuming the service via the Proxy tenant.
The Service Health shows the Customers consuming the service and the status of each customer and the Service Consumption shows the Total Consumption of the Specific service along with the Top Subscriptions.


The Consumption Overview shows the Monitoring view of each customer, it gives the Total Consumption along with the total data each and every customer consumed, in addition to that the Customer Site reflects the Site location of the Graphiant Gateway devices and the Region to which the Gateway Devices are connected to.

The Entire Monitoring view of the Data Exchange Partner gives a complete detail of the service and the consumption of the service by both Graphiant and Non-Graphiant customers.
Client to Server Service
The Monitoring for the Client to Server Data Exchange Service is similar to the Peering Service
Publisher of the service is shown under the Services

The Service Health and the Service Consumption shows monitoring data similar to the Peering Service

The Service consumption Details shows the details of the Bandwidth usage for the service, Consumption Overview shows the data for the each customer, Overtime Consumption shows the total download of data for the specific Client to Server Service over the period of time for Uplink and Downlink


In the Consumer Enterprise the Client to Server Service Consumption is similar to the Peering Service
Service Health shows the Health for each customer consuming the Service and the Service Consumption shows the Total Consumption along with the Top Subscriptions of the Service

Service Consumption Details, the Consumption Overview and the Overtime Consumption shows the consumption of the service for the customers and the connectivity of the customers and the overtime download and upload of the data witht he


